

 PDF
PDF ePub
ePub Citation
 Print
Print


INTRODUCTION
The hepatitis B virus (HBV) is a small DNA virus belonging to the Hepadnaviridae family. The viral genome has 4 open reading frames (ORFs: S, C, P, and X) and the virus replicates through an RNA intermediate using a viral polymerase with reverse-transcriptase activity. Upon entry into the cell, HBV sheds its protein coat and the relaxed, partially double-stranded genome is transported into the nucleus. In the nucleus, the DNA genomes are converted to a covalently closed circular (ccc) form, which serves as the transcriptional template for host RNA polymerase II. The cccDNA resides in an infected hepatocyte nucleus in the form of a stable, resistant, and enduring non-integrated minichromosome, where it acts as a template for the transcription of viral genes and is responsible for viral persistence [1, 2]. Several studies have shown a clear correlation between levels of serum hepatitis B surface antigen (HBsAg) and cccDNA [3-5].
Currently, 2 automated diagnostic assays are available for quantification of HBsAg. The most widely used is the Architect HBsAg assay (Abbott Diagnostics, Abbott Park, IL, USA), and the most recently developed is the Elecsys HBsAg II quant assay (Roche Diagnostics, Indianapolis, IN, USA) [6, 7]. The aim of the present study was to evaluate the performance of the Elecsys HBsAg II quant assay and the correlation of its results with the level of HBV DNA in follow-up patients with chronic hepatitis B (CHB) virus infection.
METHODS
1. HBsAg quantitative assay
HBsAg was quantified using the Elecsys HBsAg II quant assay. HBsAg testing was performed according to the manufacturer's instructions and with test kits from a single lot. Detection of HBsAg by Elecsys uses a sandwich principle: first, a complex is formed with 2 monoclonal HBsAg-specific antibodies, 1 of which is biotinylated, and the other labeled with a ruthenium complex. After addition of streptavidin-coated microparticles, the complexes bind to the solid phase through interaction of biotin and streptavidin. The mixture is subsequently aspirated into a measuring cell, where application of a voltage induces chemiluminescent emission, which is measured by a photomultiplier. All samples were tested at a 1:400 dilution. The Elecsys HBsAg II quant assay is calibrated to give results in terms of international units per milliliter (IU/mL).
2. HBV DNA quantification
COBAS AmpliPrep/COBAS TaqMan™ HBV (CAP/CTM HBV) (Roche Diagnostics, Mannheim, Germany) is an automated real-time PCR test based on a dual-labeled hybridization probe targeting the pre-core/core region associated with an HBV DNA automated extraction based on the affinity of DNA for silica gel-covered magnetic beads. The procedure starts with 1,050 µL of plasma and consists of subsequent steps of lysis with chaotropic agents and proteinase K, glass-particle DNA capture, and purification. During the processing step, an internal quantification standard is added to the sample. After DNA elution at a high temperature (80℃), a robotic arm loads the nucleic acids in microvials containing the PCR master mix prepared by the same robotic arm. The real-time PCR test is performed by the Cobas TaqMan™ 48 using a TaqMan assay, simultaneously amplifying 2 targets: HBV DNA and the HBV quantification standard (QS), which is a noninfectious construct with primer-binding regions identical to those of the HBV target sequence but with known copy number and added after preparation of sample. Results are expressed as HBV-DNA IU/mL.
3. Performance evaluation of the HBsAg quantitative assay
1) Precision
Precision was determined according to CLSI document EP5-A2 [8], using positive control material (Level 2) and pooled serum of patients in which the results of the HBsAg qualitative assay were highly reactive. Each of 2 level samples was tested in 2 runs per day, in duplicate, for 20 days, for evaluating between-run and between-day precision. Intra-assay precision was assessed by testing the samples every 30 min 10 times, with replication, on 1 day.
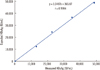
2) Linearity
Low level (0.50 IU/mL) and high level (48,696 IU/mL) of HBsAg from patients were mixed in the following ratios: 0:4, 1:3, 2:2, 3:1, and 4:0. The 5 dilution levels were assessed in replicate by CLSI EP6-A [9].
3) Carryover
The carryover rate was determined by 4 consecutive analyses of 2 samples at different levels (high-level quality control material and pooled serum), according to CLSI EP 10-A2 [10].
4) Limit of detection
The low limit of detection (LOD) was determined according to CLSI EP 17-A [11]. Mean value and SD were obtained by 20 consecutive analyses of HBsAg-negative and unspiked specimens (for the Roche HBsAg Qualitative assay) from healthy adults. Low LOD is defined as the mean plus 2 SD. Roche HBsAg II control Lot 16561101 (Roche Diagnostics) level I and level II were mixed for the spiked sample. SDspk was used to obtain 20 replicates of this spiked sample. Biological LOD was determined as the summation of low LOD and 2SDspk.
5) Potential interfering substances
Potential interference was assessed using 40 HBsAg-negative and unspiked specimens (for the Roche HBsAg Qualitative assay). Serum samples from the following categories were tested: viral infection (HAV, HCV, HIV, CMV, VZV, and HSV), autoimmunity (rheumatoid factor, antinuclear antibodies [ANA]), and other conditions (immunoglobulin from monoclonal and polyclonal gammopathy or multiple myeloma).
4. Correlation between HBsAg quantitative assay and HBV DNA quantification
During the study period from January 2006 to October 2009, patients diagnosed with CHB were enrolled (n=57; 21 women, 36 men) in this study. The median patient age was 45 yr (range, 18-68 yr). The patients were treated with adefovir (n=30) and entecavir (n=27). In total, 156 serum samples from HBV chronic carriers were obtained from 57 patients. From 10 patients, samples were obtained according to the study protocol at weeks 0, 12, 24, 48, 72, and 96. The results of HBsAg quantification were analyzed for correlation with quantification of HBV DNA. The usefulness of the HBsAg level during treatment as a predictor of sustained virological response was analyzed. Virologic response was defined as undetectable serum HBV DNA (<12 IU/mL) at 96 weeks after the start of the treatment. One participant showed levels below the detection limit for HBV DNA titer. For this participant, a level equal to the limit of detection divided by the square root of 2 was imputed [12].
5. Statistical analysis
Statistical tests were performed using SPSS software (version 18.0; SPSS, Inc., Chicago, IL, USA). The Spearman correlation coefficient was used to estimate the correlation between serum HBV DNA and HBsAg. The Mann-Whitney U test was used to compare means between responders and non-responders at 12 weeks, 24 weeks after the start of the treatment, and baseline. The repeated measures ANOVA was used for comparisons of the HBV DNA and HBsAg of 10 patients from serial samples taken during the 96 weeks of the study. The receiver-operating characteristic (ROC) curve was employed to identify an absolute HBsAg level associated with a high rate of response post-treatment. A P value of <0.05 was considered statistically significant. The P level was adjusted using a Bonferroni correction procedure for correlated dependent measures.
RESULTS
2. Cross-reactivity and carryover
To evaluate the cross-reactivity of the HBsAg assay, 40 serum specimens from hospital patients with medical conditions unrelated to HBV infection and specimens containing potentially interfering substances were evaluated. Cross-reactivity was not observed. The carryover rate was 0.00002%.
3. LOD
The lower LOD of the Elecsys HBsAg II quant assay with 20 consecutive analyses of HBsAg negative and unspiked specimens (for the Roche HBsAg Qualitative assay) from healthy adults was 0.564 (IU/mL). Biological LOD was 0.570 (IU/mL).
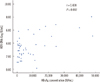
4. Correlation between Elecsys HBsAg II quant assay and the level of HBV DNA
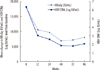
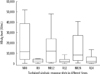
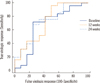
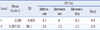
The first follow-up samples from 46 patients were evaluated for a simple correlation between HBsAg and HBV DNA. The correlation between measurements conducted with the Elecsys and HBV DNA PCR assays is shown Fig. 2; the correlation between the assays was weak (r=0.438, P=0.002). Mean changes in the HBV DNA and HBsAg of 10 patients in serial samples taken during the 96 weeks showed a significant difference between the 2 groups (repeated measures ANOVA, P=0.002). A significant difference was not observed with serial follow-up within each group (repeated measures ANOVA, F [1.4, 25.2]=1.438, P=0.251) or with interactions between the time and groups (repeated measures ANOVA, F [1.4, 25.2]=1.435, P=0.252) (Fig. 3). HBsAg levels at baseline, 12 weeks after the start of the treatment, and 24 weeks after the start of the treatment, were lower in patients achieving a sustained virologic response (5,224.10±7,495.27, 3,335.08±3,565, 4,523.26±5,036.56 IU/mL) than in non-responders (20,016.2±19,434.11, 15,775.89±15,489.65, 14,803.45±14,901.75 IU/mL; Mann-Whitney test, P=0.009, P=0.002, P<0.001, respectively; Fig. 4).
ROC analysis was used to identify baseline HBsAg levels associated with achieving a sustained virologic response 96 weeks after the start of the treatment. A lower level (3,749 IU/mL) at baseline was identified that resulted in a positive predictive value (PPV) of 72% for achieving a sustained virologic response after the start of the treatment and a negative predictive value (NPV) of 81%. Cutoff values at 12 weeks and 24 weeks after the start of the treatment of 10,275 IU/mL and 3,846 IU/mL showed PPVs of 77.1% and 85% and NPVs of 84.6% and 50%, respectively (Fig. 5).
DISCUSSION
The goal of treatment of CHB is to suppress replication of HBV. Because the duration of treatment is long, prediction of the response to treatment during the course of treatment is necessary. Theoretically, cccDNA is the best indicator of transcriptional activity of HBV in hepatocytes, and the level of cccDNA at the end of the treatment is associated with a sustained virological response following treatment cessation [13, 14]. According to previous studies, the level of HBsAg correlates with the level of cccDNA [3-5]. Until the development of automated quantification of HBsAg, measurement of HBsAg levels was laborious and needed serial dilution, lacked standardization, and was difficult to use in clinical practice [11]. Recently, an automated method for quantification of HBsAg has been developed, and the clinical use of HBsAg has now been highlighted [11]. There are 2 automated quantification assays for HBsAg. Milan et al. [6] and Karsten et al. [7] reported that the correlation between the assays was excellent (r=0.96 and 0.97, respectively; P<0.001).
In clinical use, quantification of HBV DNA by PCR can monitor the response to treatment. Several studies have shown the presence of a good correlation between HBsAg and HBV DNA levels [15, 16], but others have shown the absence of a correlation [17]. Rather than a simple correlation between HBsAg and HBV DNA levels, the correlation between mean changes in HBsAg and HBV DNA level is important [16, 17]. However, serial changes in HBsAg and HBV DNA of each patient during treatment do not always correlate well [16, 18, 19]. The pattern of changes in HBsAg and HBV DNA may differ owing to differences in disease status, in particular the presence of HBeAg and anti-HBe-antibodies, and the mechanism of action of the drug used [17, 20]. Therapy with interferon (IFN) gamma clears HBV-infected hepatocytes noncytolytically and leads to a greater reduction in HBsAg. Adefovir or entecavir are nucleoside analogues that target the HBV reverse transcriptase and selectively inhibit virion production. The efficacy of these drugs for lowering HBsAg and cccDNA levels is poorer than that of IFN therapy [13]. The patients involved in our study were treated with adefovir or entecavir. None were treated with IFN. Additionally, the disease status of the patients differed; some achieved seroconversion of HBeAg, whereas others did not. These differences led to the discordance between changes in HBsAg and HBV DNA levels during the 96 weeks of follow-up for each patient.
Quantification of HBsAg and HBV DNA levels enabled prediction of response to treatment. Even though the cut off value for the HBsAg level at baseline or the reduced levels from baseline differed between studies, the initial HBsAg level and reduced HBsAg levels could predict the response according to type of treatment. A lower HBsAg level at baseline or a greater reduction in HBsAg level from the baseline at 12 or 24 weeks after the start of the treatment was correlated with achievement of a sustained virological response [13, 14, 18, 20-24]. In our study, the level of HBsAg at pretreatment, 12 weeks, and 24 weeks after the start of the treatment was useful for the prediction of response to treatment. Thus, serial follow-up for HBsAg is useful for defining the level at baseline and analyzing the level of decline at a given time point, but not for determining a simple correlation with HBV DNA level.
According to our study, the Elecsys HBsAg II quant assay shows good performance in precision, linearity, carryover rate, and specificity. The level of HBsAg at baseline, 12 weeks, and 24 weeks after the start of the treatment is useful for predicting virologic response in patients with CHB virus infection. Therefore, the Elecsys HBsAg II quant assay can be applied for HBsAg quantification in clinical practice.
 XML Download