

 PDF
PDF ePub
ePub Citation
 Print
Print


INTRODUCTION
Reticulocytes are RNA-containing cells that are formed between the erythroblast and mature erythrocyte stages of red blood cell (RBC) maturation. The RNA of RBCs is lost upon cell maturation [1]. The reticulocyte count is a good marker of erythropoietic activity of the bone marrow. It is a useful tool to diagnose anemia or monitor bone marrow response to therapy [2, 3].
The reference method for reticulocyte enumeration is manual counting by microscopic examination of supravitally stained blood smears [4]. In the mid-1990s, automated flow-cytometric analysis replaced microscopic quantitation [5]. Each automatic hematological analyzer adopts different principles for reticulocyte counting [6]. Besides the reticulocyte count, the immature reticulocyte fraction (IRF) is one of the reticulocyte indices generated by automated analyzers [7]. The IRF is an early predictor of hematological recovery following iron therapy, chemotherapy, or bone marrow transplantation [8-11].
The XE-2100 analyzer (Sysmex, Kobe, Japan) is one of the commonly used instruments for hematological analysis. For reticulocyte enumeration, the XE-2100 analyzer uses fluorescence and light scattering properties. The fluorescent dye polymethine labels the RNA of the reticulocytes, platelets, and WBCs, and the DNA of other nucleated cells [12]. Reticulocytes are distinguished from RBCs on the basis of the fluorescence intensity. The fluorescence intensity is also used to segregate the reticulocyte population into 3 fractions - low, medium, and high fluorescence; the sum of the medium and highly fluorescent reticulocytes represents the IRF [13]. Signals with fluorescence intensity between that of reticulocytes and WBCs represent the upper particle portion (UPP) [14].
Abnormal numbers of WBCs, WBC fragments, nucleated RBCs, giant platelets, and platelet clumps may interfere with automated reticulocyte counting [15]. In our laboratory, for cases where the reticulocyte count is >10% by the automated analyzer and when interfering factors like hyperleukocytosis are present, we verify the count by using the manual reticulocyte counting method. However, the exact WBC count that results in an erroneously high reticulocyte count has not yet been reported. Moreover, a correction method by using the automatic hematology analyzer has not been reported.
Hence, we examined the influence of the WBC count on the reticulocyte count or the IRF by using the XE-2100 hematology analyzer to determine the WBC count for which reticulocytes should be counted manually and the method for correction of the error by using an automated hematology analyzer.
METHODS
1. Reticulocyte counting
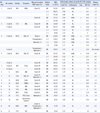
Twenty-one blood samples (sample nos. 1-21) were obtained from 16 patients with leukocytosis from November 2011 to February 2012 in Seoul St. Mary's Hospital, Seoul, Korea, and analyzed for complete blood cell (CBC) count (Table 1). Diagnosis was variable and included leukemia and benign non-hematological diseases. WBC counts varied from 29.64×10⁹/L to 725.14×10⁹/L. The blast counts in the manual WBC differential count ranged from 0 to 99%. The count of nucleated RBC per 100 WBCs ranged from 0 to 1. The reticulocyte count was performed on a XE-2100 hematology analyzer (Sysmex). Reference values for normal counts in our laboratory were as follows: total reticulocyte count, 0.2-2.0% and IRF, 2.0-15.0%. If the reticulocyte signal overlapped with the WBC signal on the reticulocyte scattergrams, the reticulocyte scattergram was regarded as abnormal; if the reticulocyte signal was well separated from the WBC signal, the scattergram was considered to be normal. An abnormal reticulocyte scattergram prompted the manual enumeration of reticulocytes. For the manual count, an equal volume of peripheral blood anticoagulated with K2EDTA was mixed with 1% brilliant cresyl blue solution. Following incubation for several minutes, a thin smear was prepared and each slide was examined using light microscopy. The number of reticulocytes in 1,000 RBCs was determined.
2. Correction of error
In case of an abnormal reticulocyte scattergram, the reticulocyte and WBC counts were verified by using the XE-2100 analyzer following serial dilution (1:2-1:10) with an isotonic solution (Sysmex). These reticulocyte counts were compared with the manual counts, and the minimal dilution that resulted in the same reticulocyte count was determined to be the corrective dilution.
RESULTS
The reticulocyte counts generated by the XE-2100 analyzer in the 21 samples varied from 0.06 to 42.8%. Five samples (nos. 1, 2, 4, 5, and 7) from 4 patients showed erroneously elevated reticulocyte counts on automated counting compared to the manual counts.
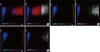
Sample no. 1 was obtained from a patient diagnosed with mixed phenotype acute leukemia (MPAL) with t (v; 11q23); MLL rearranged. The WBC count was 725.14×10⁹/L. The blast and nucleated RBC counts were 97% and 1 per 100 WBCs, respectively. The automated and manual reticulocyte counts were 42.8% and 1.2%, respectively. The IRF determined using the XE-2100 analyzer was 91.7% (Table 1). The reticulocyte scattergram on the XE-2100 analyzer was abnormal, without the associated "Abnormal reticulocyte scattergrams" flag. The WBC fraction appeared to overlap with the reticulocyte regions, especially with the IRF (Fig. 1). The reticulocyte count, IRF, and the reticulocyte scattergram became normal after a 1:2 dilution, following which, the WBC count decreased to 380.55×10⁹/L (Table 1, Fig. 1).
Sample no. 2, which was from the same patient, was obtained 1 day later, following hydration. The WBC count was 574.55×10⁹/L. The automated and manual reticulocyte counts were 4.69% and 1.2%, respectively. The IRF was 85.5%, and the reticulocyte scattergram was abnormal, with the flag. The erroneously elevated reticulocyte count, IRF, and the reticulocyte scattergram were normalized following a 1:3 dilution, and the WBC count decreased to 222.48×10⁹/L (Table 1). The 1:2 dilution was not performed since the sample was insufficient.
Sample no. 3 was from a patient diagnosed with AML with 99% blasts. The WBC count was 159.90×10⁹/L, and the reticulocyte scattergram was normal. The automated and manual reticulocyte counts were 0.09% and 0.1%, respectively, and the IRF was 11.5%.
Sample no. 4 was obtained from the same patient 2 days later following conservative care. The WBC count was 264.74×10⁹/L. An erroneously elevated reticulocyte count and IRF were evident, with an abnormal reticulocyte scattergram signaled by the flag. The automated and manual reticulocyte counts were 0.63% and 0.1%, respectively; the IRF was 81.8%. The erroneously elevated reticulocyte count, IRF, and the reticulocyte scattergram were normalized following a 1:2 dilution, which reduced the WBC count to 131.72×10⁹/L (Table 1).
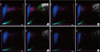
Sample no. 5 was obtained from a patient diagnosed with BCR-ABL1-positive chronic phase (CP) CML. The WBC count was 218.19×10⁹/L. The manual WBC differential count indicated the following: blasts, 6%; promyelocytes, 5%; and myelocytes, 12%. The automated and manual reticulocyte counts were 3.08% and 2.5%, respectively, and the IRF was 27.7%. The flag indicated an abnormal reticulocyte scattergram. The WBC fraction seemed to overlap with the reticulocyte regions, especially with the IRF (Fig. 2A). Even after dilutions of 1:2 (WBC count, 118.53×10⁹/L), and 1:3 (WBC count, 78.56×10⁹/L), the reticulocyte scattergrams remained abnormal, although the WBC region shifted to the right (Fig. 2B, C). After a 1:10 dilution (WBC count, 25.86×10⁹/L), the reticulocyte count and IRF were reduced to 2.17% and 23.9%, respectively. The reticulocyte scattergram was normalized without the flag (Fig. 2D).
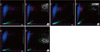
Sample no. 6 was from the same patient as sample no. 5, but was obtained following leukapheresis and hydroxyurea treatment. The WBC count decreased to 108.32×10⁹/L, and the reticulocyte scattergram was normal (Fig. 3B). The reticulocyte count and IRF were 1.22% and 14.6%, respectively, on the XE-2100 analyzer.
Sample no. 7 was obtained from a patient diagnosed with blast phase CML. The WBC count was 375.72×10⁹/L. Manual WBC differential count revealed 96% blasts. The automated and manual reticulocyte counts were 0.81% and 0.2%, respectively, whereas the IRF was 65.8%. The reticulocyte scattergram was abnormal as indicated by the flag. Following a 1:2 dilution (WBC count, 192.95×10⁹/L), the reticulocyte count and IRF decreased to 0.32% and 25.7%, respectively. The reticulocyte scattergram was normalized without the flag.
Sample no. 8 was obtained from the same patient as sample no. 7 following hydroxyurea treatment. The WBC count was reduced to 204.81×10⁹/L, and the reticulocyte scattergram was normal. The automated and manual reticulocyte counts were 0.19% and 0.1%, respectively. The IRF was 19.5%.
Comparison of the results obtained from the XE-2100 analyzer and from the reference method revealed that 13 samples (nos. 9-21) with a WBC count ranging from 29.64×10⁹/L to 299.22×10⁹/L displayed the correct reticulocyte count (Table 1). Of these, 6 displayed WBC counts of >100.00×10⁹/L; the corresponding diagnoses varied from hematological malignancy to benign non-hematological disease, and the blast counts also showed variation. The 13 samples displayed normal reticulocyte scattergrams. Automated counting resulted in a reticulocyte count varying from 0.06 to 9.23%. Since the difference between manual and automated reticulocyte counts fell mostly within acceptable limits (<10% of mean reticulocyte count), we did not dilute the samples.
DISCUSSION
The present study describes 5 leukocytosis cases associated with erroneously elevated reticulocyte counts, IRF values, and abnormal reticulocyte scattergrams obtained by using the Sysmex XE-2100 hematology analyzer. The samples differed with regard to patient diagnoses, WBC counts, and blast counts. However, all of them displayed an abnormal reticulocyte scattergram, indicated by flag messages in certain cases. The flag messages seemed to be less sensitive than abnormal reticulocyte scattergrams. In the reticulocyte and extended reticulocyte scattergrams, the WBC fractions appeared to overlap with the reticulocyte regions, especially with the IRF. This could possibly reflect the insufficiency of the fluorescent dye in samples with numerous nucleated cells. Abnormal numbers of WBCs, WBC fragments, nucleated RBCs, giant platelets, and several other factors have been reported to lead to inaccurate gating of RBCs and are hence regarded as possible factors interfering with automated methods for reticulocyte analysis [16-19]. In leukemia patients, erroneously elevated immature reticulocyte counts obtained by using the XE-2100 analyzer have also been reported [14]. In this study, reduction of the WBC counts by simple dilution with an isotonic solution was able to address the abnormal scattergrams. The WBC region shifted to the right, as the fluorescence intensity increased. However, the highest WBC count with an accurate reticulocyte count and normal scattergram differed between cases. A small number of cases showed erroneously elevated reticulocyte counts with a WBC count of <100.00×10⁹/L, whereas certain others showed normal reticulocyte counts and scattergrams despite a WBC count of 380.00×10⁹/L. Therefore, the degree of WBC labeling with the fluorescent dye polymethine differed among the WBCs, especially in samples from leukemia patients. It should be noted that the WBC count and the type of WBC affected reticulocyte enumeration by the automatic analyzer. Although the CML sample could not be corrected up to a WBC count of 70.00×10⁹/L, most cases with an erroneously elevated reticulocyte count determined using the Sysmex XE-2100 system were corrected when samples were diluted to a WBC count of about 100.00×10⁹/L. This difference may be associated with the differential labeling of blasts and CML cells by polymethine.
In conclusion, when leukocytosis samples display an abnormal reticulocyte scattergram flag or an abnormally high IRF, we recommend dilution of the samples with isotonic solution to a WBC count of about 100.00×10⁹/L, followed by reanalysis of the reticulocyte count as well as the scattergram.
 XML Download