

 PDF
PDF ePub
ePub Citation
 Print
Print


INTRODUCTION
Mercury exists in various forms including elemental mercury (Hg0), inorganic mercury (HgCl2), and organic mercury (CH3HgCl), and mercury toxicity varies according to the forms of mercury, entry route, exposure level, and individual susceptibility [1]. People may be exposed to mercury from a variety of sources and there are significant differences in the characteristics and duration of mercury exposure as well as metabolism of mercury between individuals. Thus, accurate measurement of exposure using biological indicators is very important.
Blood, urine, and hair can be used as biological indicators to measure mercury concentration in the body. Since mercury is absorbed differently in the body according to its specific molecular composition, such biological samples can be used to determine the type of mercury to which an individual was exposed. It is known that, while mercury in blood and hair reflects exposure to total mercury and organic mercury (including methylmercury) accumulated in the body, mercury found in the urine reflects exposure specifically to inorganic mercury [2, 3]. Mercury detected in the blood and hair reflects the level of exposure to organic mercury, short-term exposure can be measured by determining the mercury concentration in the blood, while long-term exposure can be measured by determining the mercury concentration in a person's hair [4, 5]. However, hair may not reflect the actual mercury concentration in the body because external factors, such as dyeing, hair dressing, and permanents, may result in mercury contamination [6].
When atmospheric mercury in the elemental state is discharged into the environment, it is deposited in water, soil and sediment and often accumulates in living organisms. Bacteria and planktons in aquatic ecosystems can methylate mercury, transforming it into methylmercury, a form of organic mercury [1]. Organic mercury of various forms, including methylmercury is a fat-soluble substance, and over 90% of organic mercury is absorbed into the alimentary tract. Since its half-life in vivo is around 70 days, it is excreted slowly and easily accumulates in the body. Furthermore, studies have shown that, once organic mercury has accumulated in the body, it is not easily removed and can pass through the blood-brain barrier to affect the central nervous system and peripheral nervous system [7].
Because of these risks relating to methylmercury, there are established recommendation criteria for total blood mercury in the USA, Canada, Japan, and other countries, and in order to control exposure to methylmercury in vulnerable populations, such as pregnant women and infants, these countries have established criteria for fish intake, water mercury content, etc. Korea has also recognized the risks of mercury exposure and the government is making efforts to assess accurate mercury exposure by analyzing biological indicators in various samples.
Some Korean laboratories are capable of conducting analysis of total mercury in blood, urine, and hair; however, no analysis method has been established for the measurement of methylmercury in blood because of difficulties in accurately assessing all exposure factors leading to mercury accumulation. Therefore, we conducted the current study in order to establish a method to analyze methylmercury concentrations in the blood using cold vapor atomic fluorescence spectrophotometry (CVAFS). In this report, we present our experience in developing this novel analysis method to measure blood methylmercury concentrations for the first time in Korea.
METHODS
1. Subjects and sample collection
In this study, we randomly selected 30 participants, age 20 yr or older, from Busan, Ulsan, and Gyeongsangnam-do, to analyze total blood mercury and methylmercury concentrations. All blood samples were collected using 3-mL vacuum blood collection tubes (Vacutainer®, Beckton & Dickton, Franklin Lakes, NJ, USA) treated with EDTA to prevent coagulation. Venous blood was collected directly and kept in a refrigerator at 4℃ until sample analysis. Whole blood samples were used for analysis.
2. Analysis method
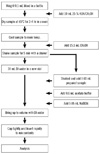
This study used the MERX model (Brooks Rand Co, Seattle, WA, USA) for blood methylmercury analysis (Fig. 1) according to analysis procedures suggested by the U.S. Environmental Protection Agency (EPA, Method 1630). The analysis process includes digestion (preprocessing), separation, and detection (the main analysis measurement).
Among the reagents used in this study, sodium tetraethylborate (NaBEt4), which is used as an ethylation reagent, is a highly flammable material that is easily ignited and degraded by moisture in the air. Thus, this reagent was freshly prepared during analysis. All deionized water used in the experiment was double deionized using Barnstead® US/A56220-8 to minimize contamination.
For preprocessing, 0.5 mL of sample (handled carefully so as not to stain the walls of the bottle) and 10 mL of methanol (25% potassium hydroxide [KOH]) were added into a Teflon bottle, and the bottle was capped in order to prevent evaporation. The sample was decomposed using a heating block set at 65℃ for 3-4 hr and methanol was added prior to analysis to bring the final volume to 25.6 mL. Next, 0.03 mL of the treated sample, 0.6 mL of acetate buffer, and 0.05 mL of NaBEt4 were added to 30 mL of deionized water in a brown vial. The remaining space was then filled with deionized water to remove headspace, and the vial was shaken up and down in order to sufficiently mix the contents. The preprocessing procedure was finished after this step (Fig. 2).
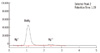
Next, the preprocessed sample was purged with nitrogen gas and moved to a Tenax trap. The absorbed trap was dried with nitrogen gas for approximately 7 min, and the dehydrated Tenax trap was then desorbed through heating at 450-500℃. The sample was removed from the trap, subjected to gas chromatography (GC) and decomposed in the order of Hg0, CH3Hg, and Hg2+. The samples were analyzed using a CVAFS detector.
Analysis took approximately 5 hr per sample, though the analysis time could be shortened by using an auto-sampler. Blood samples may be stored in a refrigerator for approximately 1 month without changing the concentration of mercury in the sample; however, the sample should be frozen at -70℃ if analysis is expected to be done after more than 1 month.
Total blood mercury analysis was performed using the gold amalgamation method with an automatic mercury analyzer (SP-3DS, Nippon Instruments Corp., Tokyo, Japan). This method decomposes the test samples via heating at high temperatures to gasify mercury and collect/concentrate the material to a mercury collector made of a multi-porous substance coated with gold (Hg-Amalgam). This method was chosen for the present study because it directly quantifies Hg without requiring wet decomposition of test samples and does not result in mercury loss in the process of pre-treatment of the test samples, ensuring outstanding sensitivity and reproduction.
Blood samples were slowly thawed at room temperature immediately before the analysis, and a roll-mixer was used to mix them for 0.5-1 hr. All samples were pre-mixed and added in 100-µL quantities to the sample boat, where additives aluminum oxide (BHT®, Nippon Instruments Corp., Tokyo, Japan), calcium hydroxide + sodium carbonate (MHT®, Nippon Instruments Corp., Tokyo, Japan) were applied.
Ten milligrams of L-cysteine and 2 mL of nitric acid were used to produce a 0.001% L-cysteine solution. A 1,000-ppm standard mercury solution (Wako Co., Tokyo, Japan) was then diluted with the L-cysteine solution to generate a 10-ppm solution. The solution was diluted again to yield standard samples at 2, 4, 6, and 8 µg/L concentrations, and a calibration curve was drawn [8].
3. Linearity
The methylmercury standard solution (1 ppm) was purchased from Brooks Rand Co. and kept in a refrigerator with light interruption until use. The 0.001% L-cysteine solution was prepared using 10 mg of L-cysteine and 2 mL of nitric acid. Working standard solutions were made by diluting the 1 ppm purchase solution to 1 ng/mL and 0.01 ng/mL using the prepared L-cysteine solution. The standard samples for the calibration curve were then diluted from working standard solutions (1 ppm) to 1, 2, 10, 50, 100, and 250 pg/mL and analyzed 10 times for each concentration according to the test procedure indicated by the stage and the analysis results. The 10 measurements for each concentration were averaged and these averages were used to make a calibration curve.
4. Precision and accuracy
The evaluation of within-run precision was performed 5 times by calculating the average, standard deviation, and CV using Toxic Metals in Caprine Blood (955c) as the certified reference material (CRM) from the National Institute of Standards and Technology (NIST). The within-day precision was evaluated 5 times at intervals of 10 analyzed samples by calculating the CV. The day-to-day precision was evaluated for 5 days by calculating the average, SD, and CV. Accuracy was evaluated by calculating the recovery rate in all repeated analyses using Toxic Metals in Caprine Blood (955c).
5. Limit of detection (LOD)
Seven test samples, with deionized water added, were analyzed according to the same preprocessing and analysis method, and we calculated the limit of detection using the results.
6. Quality control for analysis
In order to verify the test method, we examined the reliability of the measurement for each test using Toxic Metals in Caprine Blood (955c) CRMs from the NIST. Equipment maintenance and repair were checked regularly and confirmed by the medical specialists in charge. Before analyzing actual samples, we cleaned and stabilized the equipment by analyzing 3 calibration blanks, and then drew a calibration curve by preparing standard solutions. After the calibration curve was completed, we analyzed 3 calibration blanks, 3 method blanks, 3 CRMs, 1 matrix spike and 1 matrix spike duplicate, and then analyzed the actual samples.
7. Statistical analysis
For statistical analysis, we used STATA/SE version 11.1 (StataCorp., College Station, TX, USA). The correlation between total blood mercury and methylmercury concentration was analyzed. The significance level was set as 0.05. All experimental results are presented as the mean±SD.
RESULTS
1. Linearity
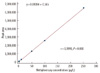
Calibration curves were made using the values obtained by analysis of the methylmercury-cysteine solution indicated by stage according to the test procedure. The calibration curve showed satisfactory linearity, with the r2 of the curve calculated as 0.9999 and the relative SD (RSD) found to be less than 4% (Fig. 3).
2. Precision and accuracy
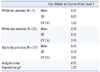
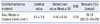
The CV was lower than 4% for all CRMs analyzed: 1.63% for within-run precision, 2.46% for within-day precision, and 3.09% for day-to-day precision (Table 1). Since the mean of all CRMs analyzed (N=125) was 4.46±0.14 µg/L in this study, compared with 4.5±1.0 µg/L as the certified concentration, the overall CV was 3.09%, and the accuracy (recovery rate) was 99.19% (range: 89.33-104.89%) (Table 2).
3. Limit of detection
The standard deviation for 7 samples was 0.037536998 pg/L, and the LOD of 0.1 pg/L was obtained by multiplying this value by 2.998.
5. Comparison of methylmercury versus total mercury in the blood
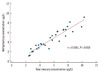
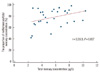
The total blood mercury concentration in the analyzed samples was 5.65±2.25 µg/L. The mean proportion of methylmercury to total mercury was 78.27% (range: 42.37-98.8%). A weak correlation was observed between the total blood mercury concentration and the proportion of methylmercury to total mercury concentration (r=0.35; Fig. 6).
DISCUSSION
This study established a blood methylmercury analysis method for the first time in Korea using automated MERX equipment and applying the method suggested by U.S. EPA Method 1630. The test method was verified using the 955c, CRMs from the NIST.
Well-known and established experimental methods have been used mostly to analyze methylmercury in fish and water. In research conducted by Lee et al. [9] that established a method for analyzing methylmercury in fish, 2 types of equipment were used. Gas chromatography-mass spectrometry (GC-MS) analysis resulted in an r2 value of 0.995 and a detection limit of 0.9 µg/L, and gas chromatography-electron capture detector (GC-ECD) analysis results in an r2 value of 0.993 and a detection limit of 0.8 µg/kg. In another study using GC-ECD, the detection limit was reported to be 5 µg/kg [10]. Furthermore, in a study that proposed a method for analyzing methylmercury in sediment using fuzzy and trap GC-MS, researchers reported that the detection limit was 0.06 ng/g, the quantitative limit was 0.20 ng/g, and precision and accuracy were 11.2% and 102%±11.4%, respectively [11]. In a study that established a method for analyzing methylmercury in water using GC-CVAFS, the detection limits were reported to be 0.042 ng/L for surface water and 0.033 ng/L for ground water [12]. In our experiment, we found the r2=0.9999, a higher linearity measurement than all of the analysis methods presented above. In addition, we found an LOD of 0.1 pg/L, suggesting that our novel method could be used to precisely analyze lower concentrations of methylcercury, and a yield of 99.19%. Thus, our method can be considered a more accurate analysis method. A study conducted in 1994 established a method for analyzing methylmercury in various biological samples using the same GC-CVAFS, and the detection limit was reported to be 0.0000006 µg/L, which is higher than that in our study [13].
Our analysis of 30 samples using this newly-established experimental method revealed that methylmercury comprised 78.27% of total blood mercury. This was similar to the results of a study that included 1,127 U.S. airmen with an average age of 53 yr, where methylmercury was found to account for around 75% of total blood mercury [14], but was lower than that of a Swedish study conducted in 2003 with 23 women and 5 men, where methylmercury was found to account for around 90% of total blood mercury [15]. A Korean study randomly sampled 16 students with high total blood mercury concentrations among approximately 2,000 elementary school students in 4th- to 6th grade in 26 regions, and 36 out of 141 parturient women in Seoul and Busan, and investigated the total mercury and methylmercury content in their whole blood and umbilical cord blood. They found that the proportion of methylmercury to total mercury was 85.1% in students with high total blood mercury concentrations, and 85% and 91% in maternal blood and umbilical cord blood, respectively [16]. Compared with these studies, our study revealed that a relatively low proportion of the total mercury is methylated. However, another study that investigated the total mercury and methylmercury content in blood and umbilical cord blood in 14 parturient women who ate fish twice or more a week reported that methylmercury accounted for 61.8% of total mercury in the blood and 69.5% in umbilical cord blood [13], and therefore, our results revealed a relatively high proportion of methylmercury compared with this study. These discrepancies are believed to come from differences in the subjects' characteristics and intake-related factors, and thus, more comprehensive research involving a variety of populations is required.
When blood organic mercury concentration was analyzed in 1,709 women in the U.S. National Health and Nutrition Examination Survey in 1999 and 2000, researchers concluded that the proportion of methylmercury was higher when the total blood mercury concentration was high [17]; however, this was not found in the 30 samples analyzed by our experimental method. This is probably because our study focused on the establishment of an experimental method. Thus, it is necessary to examine the potential association of total mercury concentration to methylmercury concentration using a larger number of subjects. The current study presents the development of a valuable novel experimental method to measure methylmercury concentration in bloods. Since methylmercury is the most toxic among mercury compounds, this method is a significant advancement. Furthemore, this is the first report from Korea to establish a method for analyzing methylmercury in the blood. We hope that continuous monitoring of blood methylmercury may allow for more comprehensive and effective control of mercury, and that our novel experimental method may contribute to the progression of these monitoring procedures.

 XML Download