

 PDF
PDF ePub
ePub Citation
 Print
Print


INTRODUCTION
The preanalytical phase is a critical step in the testing process because several procedures are performed and/or oriented by non-laboratory professionals (e.g., nurses, non-technicians, and administrative staff). Adequate fasting time before blood collection [1] is one of the many details [2-5] that should be considered because they may either singularly or collectively influence the reliability of test results and, thereby, affect the diagnostic outcome, follow-up, or even the therapeutic management of patients [6]. Clinical laboratory results are an essential part of healthcare. It has been estimated that up to 70% of medical decisions and procedures, e.g., drug prescriptions, assessments prior to and in the course of further investigations, or dialysis, are strongly dependent upon laboratory data [7]. An adequate time of fasting is typically required for glucose and lipid profile (triglycerides, total cholesterol, and fractions) assessment. The Clinical Laboratory Standards Institute/National Committee for Clinical Laboratory Standards (CLSI/NCCLS) H3-A6 [8] currently recommends to verify the patient's diet for particular restrictions and/or fasting. Moreover, the document contains important information, e.g., time and diet restrictions, which vary according to the test performed, restrictions that are necessary to ensure accurate test results, and procedures for holding meals and notifying appropriate personnel that the patient's blood specimen has been drawn. All measures mentioned above should be in agreement with the institutional policy. Nevertheless, the CLSI/NCCLS H3-A6 [8] does not contain clear indications about the standardization of fasting time and levels of discretion in establishing the most appropriate procedures. Lippi et al. [1] recently showed that a light meal can alter routine hematological tests. The aim of this study was, therefore, to assess whether a regular light meal might bias the results of routine clinical chemistry testing.
METHODS
The study population consisted of 17 healthy volunteers (8 women and 9 men; mean age±standard deviation: 29±4 yr), who were recruited among the laboratory personnel. The research was carried out according to the principles of the Declaration of Helsinki. The protocol was approved by the ethics committee and informed consent for testing was obtained from all participants.
1. Collection of diagnostic blood specimens
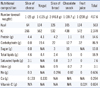
The collection of diagnostic blood specimens was carried out by a single expert phlebotomist, following the international CLSI standards [8]. All volunteers were maintained seated for 15 min prior to phlebotomy in order to eliminate possible interferences of blood distribution due to different postures [9]. After this interval, a vein was located on the forearm by using a subcutaneous tissue transilluminator device (Venoscópio IV plus; Duan do Brasil, Brazil) for preventing venous stasis interference due to the use of the tourniquet [2, 3]. All blood samples were collected directly into 3.5 mL vacuum tubes containing gel and lithium heparin (Terumo Europe, Leuven, Belgium) using a 20 gauge straight needle (Terumo Europe NV, Leuven, Belgium). To eliminate any possible interference due to either the contact phase or tissue factor, about 2 mL blood were preliminarily collected in a discard tube without additive (Vacuette®; Greiner Bio-One GmbH, Kremsmünster, Austria). The first blood sample was collected between 8:00 and 8:30 a.m. after an overnight fast. Immediately after blood collection, the volunteers consumed a light meal, containing standardized amounts of carbohydrates, protein, and lipids. The meal was based on commercial food regularly purchased at a shop and included 1 slice of cheese, 1 yogurt, 2 slices of bread, a chocolate snack, and a fruit juice as previously described [1]. The exact composition of the meal is shown in Table 1. Subsequent blood samples were collected at 1, 2, and 4 hr after the end of the meal. Each phase of sample collection was appropriately standardized, including the use of needles and vacuum tubes from the same type and lots. No specimens were discarded due to unsatisfactory attempts, e.g. problems in locating a suitable vein.
2. Processing of diagnostic blood specimens
All tubes were left in upright position for 30 min at room temperature (20℃) to ensure complete blood stability before centrifugation [10]. After centrifugation at 1,200 g for 10 min at room temperature (according to the instructions of the manufacturer), plasma was separated, stored in aliquots, and kept frozen at -70℃ until measurement. No sample showed hemolysis or lipemia at visual inspection.
3. Laboratory testing
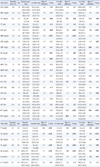
All plasma aliquots were thawed at the same time. The routine clinical biochemistry tests were performed in duplicate immediately after thawing on the same instrument cobas® 6000 〈c501〉 module (Roche Diagnostics GmbH, Penzberg, Germany), according to the manufacturer's specifications and using proprietary reagents. The panel of tests included the following: total cholesterol (COL), HDL cholesterol, triglycerides (TG), total protein (TP), albumin (ALB), blood urea nitrogen (BUN), creatinine (CRE), C-reactive protein (CRP), uric acid (UA), alkaline phosphatase (ALP), amylase (AMYL), pancreatic amylase (AMY-P), AST, ALT, γ-glutamyltransferase (GGT), lactate dehydrogenase (LDH), lipase (LIP), creatine kinase (CK), total bilirubin (BT), direct bilirubin (BD), P, Ca, Mg, Fe, Na, K, and Cl. The instrument was calibrated against appropriate proprietary reference standard materials and verified with the use of proprietary quality controls. Our evaluation of the within-run precision by internal quality control on the cobas® 6000 〈c501〉 module (Roche Diagnostics GmbH) showed low coefficients of variation (Table 2).
4. Statistical analysis
The significance of differences between samples was assessed by using the paired t-test after verifying normality by employing the D'Agostino-Pearson omnibus test. Because non-normal distribution was found for TG, TP, CRP, AMY-P, AST, ALT, GGT, LIP, CK, BD, Mg, and Cl, results were assessed by using Wilcoxon ranked-pairs test. The level of statistical significance was set at P <0.05. Finally, the biases at 1, 2, and 4 hr after intake of a standardized meal were compared with the current desirable quality specifications for bias (B), derived from biological variation [11].
RESULTS
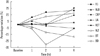
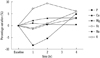
The results of this investigation are shown in Table 2; clinically significant variations are shown in Fig. 1 and 2. One hour after ingestion of the meal, significant increases were observed in TG, ALB, UA, ALP, Ca, Fe, and Na, whereas BUN and P were significantly decreased. However, a clinically significant variation according to the current desirable quality specifications [11] was only observed for TG, ALB, Ca, Na, P, and TP (the increase in TP was not statistically significant according to the Mann-Whitney test). Two hours after ingestion of the meal, TG, ALB, Ca, Fe, and Na remained significantly increased, whereas BUN, P, UA, and BT were significantly decreased. Clinically significant variations were recorded for TG, ALB, ALT, Ca, Fe, Na, P, BT, and BD (the increase in ALT and decrease in BD were not statistically significant according to the Mann-Whitney test). Four hours after ingestion of the meal, TG, ALB, Ca, Fe, Na, LDH, P, Mg, and K were significantly increased, while UA and BT were significantly decreased. Clinically significant variations were recorded for TG, ALB, ALT, Ca, Na, Mg, K, CRP, AST, UA, and BT (the increases in CRP, AST, and ALT were not statistically significant according to the Mann-Whitney test).
DISCUSSION
Clinical laboratory services are a vital part of healthcare systems [7]. Appropriateness in ordering and interpreting results of laboratory testing is an unquestionable part of the physician's clinical background, and is characterized by both her/his cumulated experience and updated scientific knowledge [12]. On the other hand, ensuring appropriateness requires increased feedback between clinicians and laboratory professionals [13]. Outpatients are usually referred to clinical laboratories with test request forms of the referring physician. In such a situation - if the physician had requested a lipid profile or glucose determination among other routine tests such as ions, proteins and/or enzymes - the laboratory staff recalls the need for indicating a fasting time before blood collection, as suggested by international and local guidelines. Alternatively, when the same outpatient shows a test request form without request for a lipid profile or glucose determination, no need of indicating a fasting time appears strictly justified, more so as the new instruments and diagnostic kit datasheets inform that there is no expected interference.
Nevertheless, this appears more of a habit rather than an evidence-based practice according to research findings. In fact, the influence of a regular meal has never been evaluated as reported in our protocol and to the best of our knowledge. Our results show that such a practice, on the basis of analytical information, is appropriate for many routine clinical chemistry laboratory tests (e.g. COL, HDL, CRE, AMYL, AMY-P, GGT, LIP, CK, and Cl). Consequently, the laboratory quality managers can accurately standardize the procedures. For other very important biochemistry markers, this is, however, unjustified. Food intake triggers several physiologic responses that could affect laboratory blood biochemical markers. A meal load increases hydrochloride acid in the stomach and bicarbonate in the blood ("alkaline tide") [14]. In addition, several hormones are stimulated (e.g., insulin, glucagon) and molecules from the gut enter the blood stream [15, 16]. Therefore, the resultant effect of food intake on serum marker concentrations reflects the interactions of several elements. In our study, the only component of the lipid profile affected by a light meal was TG. This neutral fat was absorbed and a clinically significant increase in serum levels was observed. Our lipid results are in agreement with those reported by Cohn et al. [17]. Of the major non-protein nitrogen compounds of clinical relevance in serum (BUN, CRE, and UA), only UA showed a clinically significant difference. TP and CRP showed no statistically significant variations. Serum ALB consistently increased after a light meal. This is in agreement with other studies, which showed that feeding stimulates ALB synthesis and this event might improve the storage of essential amino acids [18-21]. From the results of the enzyme panel studied, only AST and ALT showed a clinically significant increase after 4 hr of light meal ingestion. Ryan et al. demonstrated that the serum concentration of ALT decreases with alimentary restriction [22]. Meyer et al. [23] showed that the minimum BT concentration was measured 4 hr after supper. A fasting state increases hepatic uptake of non-esterified fatty acids and interferes with the hepatic clearance of bilirubin, thus, contributing to unconjugated hyperbilirubinemia of fasting [24]. Our results showed that after 2 hr of a light meal, serum levels of bilirubin were clinically significantly decreased as compared to the fasting state. Insulin secretion after a meal induces significant changes in ions [25-29], routinely measured in clinical laboratories.
When looking at the above results, these parameters might be regarded as clinically irrelevant. However, such a conclusion would be wrong with respect to the current quality specifications for bias, derived from biological variation (Table 2) [11]. Quality managers of medical laboratories consider the quality specifications derived from biological variation [11] both very important and useful in daily practice [30-33]. With regard to ALB, this assay is frequently prescribed by physicians in order to evaluate symptoms of liver disorders or kidney diseases, to assess an unexplainable weight loss with symptoms associated with malnutrition, or to screen prior to a planned surgery. Patients in critical care settings are sometimes in need of human ALB concentrate infusion [34], but the administration might be delayed due to inappropriate decisions based on inobservance of the fasting time. Patients with chronic kidney disease often experience secondary hyperparathyroidism [35] as a consequence of hyperphosphatemia, hypocalcemia, and reduced levels of 1,25-dihydroxy-vitamin D [36]. In end-stage kidney disease patients, secondary hyperparathyroidism is associated with renal bone disease as well as with increased cardiovascular morbidity and mortality [37, 38]. Clinical guidelines for the treatment of disturbances in mineral and bone metabolism in patients with chronic kidney disease and, in particular, with end-stage kidney disease include recommendations for clinical interpretation of plasma Ca levels [39]. The present results show that although the target concentrations for Ca, P, and Ca×P product are sometimes close to the normal range, even in patients with end-stage kidney disease [40], the fasting time before blood collection can significantly influence P and Ca levels. Even in this case, caring physicians unaware of the patient's real situation can adopt inappropriate treatments as a consequence of inadequate fasting time observance.
In conclusion, the significant variation of several clinical chemistry parameters after a regular meal demonstrates that the fasting time needs to be carefully considered when performing testing in order to prevent spurious results and reduce laboratory errors, especially in the emergency setting. We suggest that the laboratory management should standardize the fasting time for all laboratory tests, independent of a lipid profile request.
 XML Download