RESULTS
The chronic hepatitis B, inactive hepatitis B, and control groups were similar in terms of mean age of the subjects (P>0.05). There was no significant difference in gender characteristics between the CHB group and the other groups (IHBCS, Control) (P=0.103 and P=0.656, respectively). The gender distribution of the IHBCS and control groups were also similar (P=0.35).
Of the chronic hepatitis B patients, 32 (49.2%) were HBeAg-positive. The age and gender characteristics and ALT values of the patients are shown in
Table 1. The ALT level was higher in the CHB group compared to the other two groups (
P<0.001). A positive correlation was found between ALT and HBV DNA (r=0.308;
P=0.012). There was no correlation between ALT and oxidative stress (
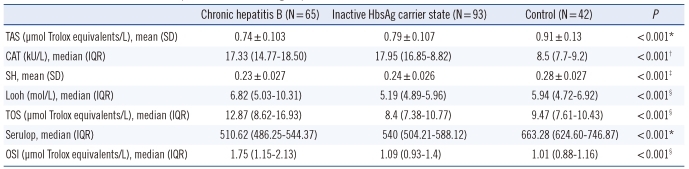
P>0.05). The oxidative and antioxidative parameters in each group are shown in
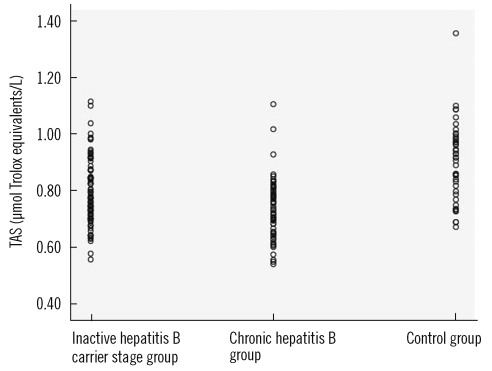
Table 2. The values of OSI, TAS, and ceruloplasmin of the patient and control groups are shown in
Figs. 1-
3, respectively. In the CHB group, no correlation was found between the fibrosis levels of the patients and oxidative stress (
P>0.05). In patients in the CHB group, HBV DNA was not correlated with OSI (
P>0.05). A strong negative correlation was observed between OSI and TAS (r=-0.404;
P<0.001) and between OSI and SH (r=-0.333;
P=0.015). A strong positive correlation was observed between OSI and LOOH (r=0.731;
P<0.001) and TOS (r=0.731;
P<0.001).
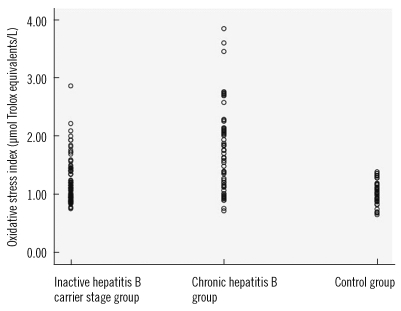 | Fig. 1Oxidative stress index values of patient groups and control group. 
|
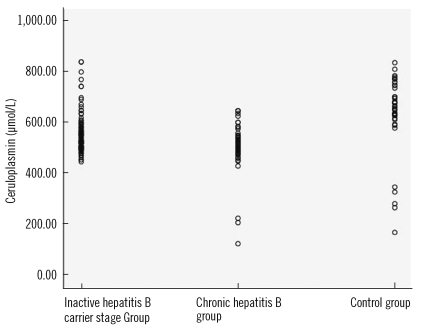 | Fig. 3Ceruloplasmin values of patient groups and control group.
|
Table 1
The clinical and demographic data of the study groups
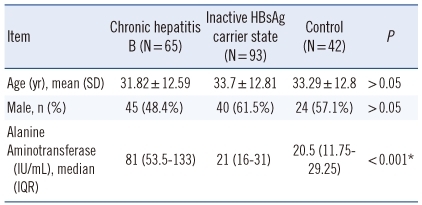

Table 2
Oxidative and antioxidative parameters in each group
Go to :

DISCUSSION
In this study, we showed that in hepatitis B infection, oxidative stress indices such as TOS, LOOH, OSI, and CAT are increased, and TAS, sulfhydryl, and ceruloplasmin levels, which are indicative of antioxidant status, are decreased.
The HBV is one of the important factors of acute/chronic hepatitis, cirrhosis and hepatocellular carcinoma. More than 400 million people are known to be chronically infected with HBV [
13]. Five percent of the world population are HBV carriers and CHB infection is cited by WHO to be the ninth most common cause of death [
1].
Hepatitis B infection exhibits a varied clinical course, which can range from asymptomatic infection to fulminant liver disease [
2]. The disease is diagnosed through clinical, microbiological (ELISA, PCR), biochemical (ALT, AST), and pathological assessment [
14]. In the present study, oxidative stress parameters in two different forms of the disease (CHB and IHBCS) were compared to those in healthy adults.
The liver fibrosis levels of the patients were determined through the histological assessment of the liver biopsy material. The diagnosis of the patients included in the study was made based on these four methods, i.e. clinical, microbiological, biochemical, and pathological method. HBV DNA analysis and histological assessments of liver biopsy samples were performed for all CHB patients.
Free radicals are defined as short-lived, unstable, and highly active molecules with one or more unpaired electrons, and with low molecular weight [
15,
16]. The substances that can prevent or delay the effects of molecules that may cause oxidation of essential substances in an organism are called antioxidants [
17]. Oxidative stress is defined simply as the imbalance between the body's antioxidant defense and the production of the free radicals, which can cause peroxidation of the lipid layer of the cells [
18,
19]. The main intracellular antioxidants in humans are the superoxide dismutase (SOD), catalase (CAT), and glutathione peroxidase (GPx) enzymes. In contrast to the intracellular environment, vitamins E and C, transferrin, haptoglobin, ceruloplasmin, albumin, bilirubin, β-carotene, and alpha-l-antitrypsin are responsible for antioxidant defense in the extracellular environment [
20].
The free fatty acid (FFA) oxidation products (lipid peroxide, superoxide, and hydrogen peroxide radicals) can generate oxidative stress and result in subsequent lipid peroxidation. Lipid hydroperoxide (LOOH), which is a non-radical free oxygen particle, is one of the indicators for oxidative stress [
21]. In recent years, the role of the imbalance between oxidative stress and the antioxidant status in cell destruction has become better understood [
3,
7,
22].
Free oxygen radicals are effective in the pathogenesis of many diseases such as carbon tetrachloride-associated liver damage, glomerulonephritis, arteriosclerosis, diabetes mellitus, vitamin C-E deficiency, malignancy, emphysema, hyperoxia, bronchopulmonary dysplasia, pancreatitis, and rheumatoid arthritis [
22-
24].
In infectious diseases, inflammatory cells have been shown to become activated and secrete reactive oxygen and nitrogen species. Studies on oxidative stress have been conducted in many infectious diseases and oxidative stress has been demonstrated to increase in leishmania, measles,
Neisseria gonorrhoeae infections, sepsis, urinary system infections, and
Paracoccidioides brasiliensis infections [
25-
30].
There have been various studies indicating that oxidative stress is increased in hepatitis B and hepatitis C infections and in liver disease [
31-
35]. Increased oxidative stress in HBV infection was demonstrated to have an effect on DNA damage and hepatocarcinogenesis [
16]. It is known that of the 530,000 hepatocellular carcinoma cases seen each year, 316,000 are associated with HBV [
2]. Therefore, we believe oxidative stress, which is known to play a significant role in hepatocarcinogenesis, is important in CHB patients.
Various indicators of oxidative stress have been studied in various clinical forms of hepatitis B and have been demonstrated to increase as the disease becomes chronic [
4,
35].
Measurement of the overall antioxidant status may yield more valuable information than the measurement of individual antioxidants. In our study, we chose to use the total antioxidant capacity measurement method developed in recent years by Erel, which measures total SH, vitamin C, uric acid, vitamin E, bilirubin, and many other antioxidants precisely, and the total oxidant capacity measurement method, which measures the oxidative stress caused by free radicals in the plasma such as hydroxyl (OH), hydrogen peroxide (H
2O
2), singlet oxygen (O
2↑↓), lipid hydroperoxide (LOOH), and superoxide (O
2.-), which can all be measured with ease due to the fact that these measurements can be performed by fully automated colorimetric methods [
7,
19]. In the present study, OSI, TOS, and TAS measurements were performed using this method. Additionally, ceruloplasmin, LOOH, and SH, which are also oxidative stress indicators, and SH and CAT enzymes, which are antioxidant status indicators, were assessed and compared in IHBCS, CHB and control groups.
The values of OSI, TOS, and LOOH, which are oxidative stress indicators, were higher in the CHB group compared to the other groups (P<0.001). The values of the antioxidant status indicator TAS, the intracellular antioxidant CAT, and the extracellular antioxidant ceruloplasmin were different in all three groups, and thus they decreased with increasing severity of the disease (P<0.001). This suggested that oxidative stress may play a role in the pathogenesis of CHB and in exacerbation of the disease. This study is the first study to compare oxidative stress with HBV DNA. Our data indicate no correlation between OSI and HBV DNA.
In chronic hepatitis B, the gold standard in assessing fibrosis is the histopathological examination of the liver biopsy material. The histological activity index (HAI) and fibrosis level in the liver indicates the progression of the disease toward cirrhosis. This study investigated the relationship of oxidative stress with fibrosis. We did not find a correlation between HAI and fibrosis and the indicators of oxidative stress. We believe this may be in part due to the homogeneity of the patients in whom the biopsies were performed, exclusion of patients with liver cirrhosis from the study, and the presence of moderate chronic active hepatitis in all patients.
In conclusion, oxidative stress increases and antioxidant values decreases as the disease becomes chronic in patients with hepatitis B infection. This study suggests that oxidative stress may be associated with hepatitis B activity.
Go to :


 PDF
PDF ePub
ePub Citation
 Print
Print


 XML Download