

 PDF
PDF ePub
ePub Citation
 Print
Print


Introduction
Obesity has become an important global health concern, and the increasing rate of obesity among women of reproductive age has a significant impact on the outcomes of their pregnancies [1]. In 2012, 29.7% of Korean women >18 years old had a body mass index (BMI) >25 kg/m2, and 21.9% of women of reproductive age (19 to 49 years old) were considered overweight [2]. Unfortunately, obesity during pregnancy is associated with adverse pregnancy outcomes, including miscarriage, preeclampsia, gestational diabetes mellitus (GDM), thrombophlebitis, congenital anomalies, macrosomia, preterm delivery, and an increased risk of cesarean section [3]. Compared to vaginal delivery, cesarean section is known to be associated with prolonged hospitalization, longer recovery time, increased risk of wound infection, and higher blood loss. In addition, cesarean deliveries that occur in critical situations (e.g., cephalopelvic disproportion or fetal distress) are at an increased risk of intraoperative complications, postoperative morbidity, and neonatal complications [45]. Excessive weight gain during pregnancy is also associated with complications that are related to maternal obesity and cesarean delivery [6]. Therefore, there is a need for more detailed knowledge regarding the impact elevated prepregnancy BMI and gestational weight gain on the outcomes that are associated with emergency cesarean section. Hence, the purpose of this study was to estimate the effect of obesity (using the World Health Organization criteria) and gestational weight gain (using the 2009 Institute of Medicine [IOM] guidelines) on the risk of emergency cesarean section during labor.
Materials and methods
We retrospectively analyzed data from 2,765 pregnancies who delivered at the obstetrics and gynecology department of Severance Hospital in Korea between June 2009 and December 2012. The study was approved by the Ethics Committee of Yonsei University Health System. The inclusion criteria were singleton pregnancies with cephalic presentation, term pregnancies (≥37 gestational weeks), and women who began labor and initially attempted a vaginal delivery. Women with preeclampsia, eclampsia, chronic hypertension, diabetes, placenta previa, planned cesarean section due to prior cesarean delivery and full-thickness myomectomy, or cesarean section due to fetal anomalies or intrauterine growth restriction defined as a fetus whose estimated weight is below the 10th percentile for its gestational age, were excluded from our analysis. The included subjects were then grouped according to their vaginal delivery or emergency cesarean section after an attempted vaginal delivery.
Prepregnancy body weight and height were reported at first visit, and we calculated the BMI as weight (kg)/height2 (m2). BMI was considered a categorical variable, and subjects were grouped according to the World Health Organization categories: underweight (<18.5 kg/m2), normal (18.5–24.9 kg/m2), overweight (25.0–29.9 kg/m2), obese (30.0–34.9 kg/m2), and extremely obese (≥35.0 kg/m2) [7]. Weight gain during pregnancy was also categorized into three groups based on the 2009 revision of IOM gestational weight gain guidelines (adequate, excessive, and inadequate weight gain) [8]. Infants who were small for their gestational age (SGA) or large for their gestational age (LGA) were defined as those that were in the <10% and >90%, respectively, of the 1999 Korean birth weight percentiles [9]. Data regarding other variables (e.g., maternal age, gestational age at delivery, parity, birth weight, and neonatal information) were obtained from the subjects' medical records.
The primary outcome for this study was the rate of emergency cesarean section, which we compared across the prepregnancy BMI and gestational weight gain categories. The secondary outcome was the risk of emergency cesarean section among the prepregnancy BMI and gestational weight gain categories. For an inter-group comparison of age, prepregnancy weight and BMI, gestational weight gain, gestational age at delivery and neonate birth weight, we used an independent t-test. For a comparison of parity, GDM, the incidence of LGA infants, each BMI status and each gestational weight gain status based on the 2009 IOM guidelines, a chi-square test was used. To evaluate the crude association between prepregnancy BMI or gestational weight gain and emergency cesarean section, logistic regression analysis was used to calculate the unadjusted odds ratios (ORs) and 95% confidence intervals (CIs). We also calculated the adjusted ORs after adjusting for potential confounding factors, including maternal age, parity, gestational age at delivery, birth weight, labor induction, LGA, fetal sex, and GDM. Additional regression models included prepregnancy BMI and gestational weight gain with the other confounders to evaluate the independent effect of prepregnancy BMI and gestational weight gain on the risk of emergency cesarean section. To further investigate the difference gestational weight gain-emergency cesarean section association stratified by maternal prepregnancy BMI, we calculated the adjusted ORs after adjusting for confounders with gestational weight gain in each prepregnancy BMI group. P-value of <0.05 was considered statistically significant. All analyses were performed using IBM SPSS ver. 20.0 (IBM Corp., Armonk, NY, USA).
Results
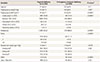
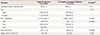
Among the 2,765 women we analyzed, 2,406 (87.0%) had a vaginal delivery and 359 (13.0%) had an emergency cesarean section. The subjects' demographic characteristics are listed in Table 1. Women who underwent emergency cesarean section had significantly greater prepregnancy weight and BMI (P=0.001 and P<0.0001, respectively). Gestational weight gain was also significantly greater among women who underwent an emergency cesarean section compared to those who experienced a vaginal delivery (13.4±4.9 vs. 12.8±4.1 kg, P=0.018), although there was no significant differences between the two groups when the gestational weight gain categories were compared (P=0.36).
The prevalence of nulliparity and GDM was higher in the emergency cesarean section group compared to those in the vaginal delivery group (88.0% vs. 54.2%, P<0.0001 and 10.5% vs. 4.6%, P<0.0001, respectively). There were no other significant differences between the two groups regarding any of the other demographic characteristics.
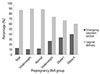
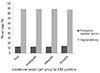
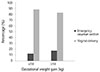
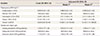
Table 2 lists the neonatal characteristics for the study groups. There was significant differences in the birth weight when emergency cesarean section was compared to vaginal delivery (3,275.3±382.4 vs. 3,396.3±536.7 g, P=0.0001). In addition, the prevalence of LGA was higher in the emergency cesarean section group compared to that in the vaginal delivery group (21.5% vs. 8.3%, P<0.0001). The incidences of a low neonatal Apgar score (<7 at 5 minutes) and admission to the neonatal intensive care unit were higher in the emergency cesarean section group compared to those in vaginal delivery (3.6% vs. 1.6%, P=0.007 and 23.4% vs. 11.2%, P<0.0001, respectively). The most common cause for an emergency cesarean section was cervical dilatation disorder such as a protracted of dilatation or arrest of dilatation (52.1%), followed by prolonged latent phase (31.2%), non-reassuring fetal heart rate pattern (9.8%), and arrest of descent (4.9%). Emergency cesarean section was more frequent among overweight and obese women, compared to among those of normal weight, and the risk of emergency cesarean section increased with increasing prepregnancy BMI (Fig. 1). Women with excessive gestational weight gain were likely to undergo emergency cesarean section, compared with women with inadequate or normal weight gain, although there were no significant differences among the gestational weight gain categories (Fig. 2). However, women with gestational weight gain of ≥18 kg had a significantly increased risk of cesarean section, compared with women with gestational weight gain <18 kg (Fig. 3).
Table 3 lists the risk of emergency cesarean section according to obesity and gestational weight gain, before and after adjusting for the various confounders. Overweight, obese, and extremely obese women had a significantly increased risk of emergency cesarean delivery, and this increased risk was still observed after adjusting for maternal age, parity, gestational age at delivery, GDM, birth weight, and sex. In particular, extremely obese women had the greatest risk of cesarean section (OR, 5.00; 95% CI, 0.83 to 30.04), and this risk increased after adjusting for the confounders (adjusted OR, 12.66; 95% CI, 1.14 to 140.66). Women who were overweight, obese, and extremely obese also had a significantly increased risk of emergency cesarean section, independent of their gestational weight gain (OR, 2.51; 95% CI, 1.68 to 3.73; OR, 2.50; 95% CI, 1.17 to 5.35; OR, 12.43; 95% CI, 1.11 to 138.68; respectively). In contrast, there was no significant interaction between emergency cesarean section and gestational weight gain categories. Women with inadequate and excessive gestational weight gain had a similar risk of emergency cesarean section, after adjusting for the confounding factors (OR, 0.94; 95% CI, 0.71 to 1.24; OR, 1.01; 95% CI, 0.74 to 1.38; respectively). However, when adjusted gestational weight gain-emergency cesarean section association stratified by prepregnancy BMI was different. Among women with inadequate gestational weight gain, overweight or obese women were related with increased risk of emergency cesarean section, compared to normal BMI women (Table 4). A similar result was observed among women with excessive gestational weight gain; OR of emergency cesarean section in obese women was 3.63 (1.05 to 12.54), compared to these with normal BMIs. Among obese women stratified by gestational weight gain, the risk of emergency cesarean section tend to increased 7.2-fold among women with inadequate weight gain and 5.7-fold among women with excessive weight gain, compared to women with adequate weight gain, although these were not statistically significant difference (OR, 7.28; 95% CI, 0.56 to 61.53; OR, 5.70; 95% CI, 0.69 to 46.81; respectively).
Discussion
Cesarean section is known to be associated with an increased risk of adverse maternal and neonatal outcomes, and several factors (e.g., low and high birth weight, advanced maternal age, high prepregnancy BMI, excessive gestational weight gain, and >40 weeks of gestation) are known to increase the risk of emergency cesarean section [5]. However, as prepregnancy BMI, gestational weight gain, and maternal weight at delivery may be controlled by the mother, they are important factors for reducing the prevalence of emergency cesarean section and the related complications.
Our results indicate that overweight and obese women, particularly those with extreme obesity, have a considerably increased risk of failed labor and emergency cesarean section compared to women of normal weight. This result remained significant even after we adjusted for maternal age, parity, GDM, gestational age at delivery, birth weight, and sex. In addition, prepregnancy BMI and emergency cesarean section were significantly associated after adjusting for gestational weight gain and the other confounders. Although women with excessive gestational weight gain were likely to undergo emergency cesarean section, inadequate or excessive gestational weight gain did not appear to significant affect the increased rates of emergency cesarean delivery (compared to those among women with adequate gestational weight gain).
Our results are consistent with those of previous studies, such as that by Crane et al. [10], who reported that the risk of cesarean section increased 1.6-fold among women who were obese before pregnancy, compared to that among women who were not obese before pregnancy. Similar results have been reported by Kerrigan and Kingdon [11], who observed a significantly higher rate of emergency cesarean delivery among obese women (16.7%), compared to that among non-obese women (10.9%) (P<0.001). Similarly, Wolfe et al. [12] have compared the rates of failed induction of labor (defined as delivery by cesarean delivery after an attempted induction) among obese and normal-weight women. They reported that failed induction followed by cesarean delivery was more common among obese women compared to among normal-weight women, and that the risk of cesarean delivery increased with increasing BMI. There are two possible explanations for this phenomenon. First, a relatively narrow pelvis (due to the mechanical pressure of the adipose tissue within the abdomen and pelvis) combined with a relatively large fetus could disturb the descent of the fetus, leading to cephalopelvic disproportion and prolonging the second stage of labor, thereby necessitating cesarean delivery. Second, it is possible that obese women experience inefficient uterine contractions, due to the release of inflammatory mediators from their abdominal and pelvic adipose tissue, as weak contractility can lead to labor arrest [101314]. In our study, the major causes of emergency cesarean delivery were cervical dilatation disorder, prolonged latent phase, and arrest of descent, which would appear to support the theory.
Few studies have evaluated whether gestational weight gain, combined with prepregnancy BMI, is associated with cesarean section. Morken et al. [13] reported that women with gestational weight gain of ≥16 kg had a significantly increased risk of cesarean section. In contrast, we found that women with gestational weight gain above the IOM recommendations were not at a significantly increased risk of emergency cesarean section. This discrepancy may be explained by the fact that Morken et al. [13] used gestational weight gain categories based on weight alone (<8, 8–16, and <16 kg), while we categorized gestational weight gain according to the 2009 IOM guidelines. Similar to our results, Tanaka et al. [15] reported that gestational weight gain according to the IOM guidelines did not significantly influence to the rate of emergency cesarean delivery among Japanese women. Interestingly, Jang et al. [16] evaluated the effects of prepregnancy BMI and gestational weight gain based on the IOM guidelines on the risk of emergency cesarean delivery among 1,024 nulliparous women, and reported that although the frequency of cesarean delivery was significantly increased among women with gestational weight gain >18 kg, gestational weight gain above IOM guidelines did not independently affect the frequency of emergency cesarean delivery. These results suggest that inappropriate gestational weight gain based on IOM guideline is less associated with the risk of emergency cesarean section, and that the absolute degree of gestational weight gain regardless of prepregnancy BMI affects the risk of emergency cesarean delivery more than the relative degree of gestational weight gain stratified by prepregnancy BMI.
In addition, prepregnancy BMI was increased, as was the risk of emergency cesarean section among our subjects with inadequate and excessive gestational weight gain, compared those with normal BMI. Particularly, even though obese women had gestation weight gain below IOM guidelines, they had a higher risk of emergency cesarean section. Similar to our study, Graham et al. [3] reported that obese women with low maternal weight gain had nearly a three-fold increased odds of cesarean delivery (OR, 2.58; 95% CI, 1.71 to 3.37). Li et al. [17] also reported that low gestational weight gain was associated with moderate-to-strong evidence of increased risk of cesarean section (OR, 1.6; 95% CI, 1.4 to 1.7). These suggest that prepregnancy obesity is highly associated with the risk of emergency cesarean section rather than gestational weight gain. In subgroup analysis among obese women stratified by gestational weight gain, the risk of emergency cesarean section tend to increased, compared to women with adequate weight gain, however these results were not statistically significant difference. In our study, obese women who had undergone emergency cesarean section was too small to calculate the OR and 95% CI, so the results may undergo profound impact by confounders. Actually, the rate of GDM women or LGA infants was higher in women with inadequate weight gain compared to those with adequate weight gain, although there were no significant differences among study groups. Fetal distress was also more common in women who had gestational weight gain below IOM guidelines. These results suggest that the mechanisms by which obesity increases the risk of cesarean section are not simply based on excess weight gain, but it could be related various types of complication due to maternal obesity such as GDM or preeclampsia. Obesity causes practical difficulties including inaccuracies of abdominal palpation of the pregnant abdomen to assess the growth, lie, or presentation of the fetus, potential errors in sonographic prenatal diagnosis and errors in blood pressure measurement. Maternal obesity also has been associated with fetal distress and an increased risk of fetal meconium aspiration and has been reported to more than double the risk of stillbirth and neonatal death [181920]. Therefore, it is important to appropriate weight gain in obese women regarding suspected complications and further study is needed to investigate the difference gestational weight gain-emergency cesarean section association stratified by maternal prepregnancy BMI.
A significant strength of our study was the large population-based sample of pregnant women who attempted vaginal delivery. In addition, we excluded women with chronic hypertension, preeclampsia, diabetes, intrauterine growth restriction, and women who required cesarean delivery due to maternal or fetal conditions, thereby reducing the potential for bias. In addition, all women were screened for gestational diabetes, and our analyses were adjusted for potential confounding factors to evaluate the independent effects of prepregnancy BMI and gestational weight gain.
Despite these strengths, the study has several limitations. For example, we used a self-reported prepregnancy weight and the study groups consisted of predominantly Korean women. In our study, only 8.6% of the population was overweight or obese, which is significantly lower than the prevalence in developed countries and the rate of women with excessive gestational weight gain was relatively low, compared to that in previous other studies [21]. This may be due to differences in Asian versus Western populations. Thus, the relevance of our findings may be limited to similar Asian populations, and it may be difficult to generalize our results to Western populations.
The global incidence of cesarean delivery is increasing, although cesarean delivery is considered a safe procedure in developed countries. However, the prevalence of emergency cesarean section should be reduced, as it is associated with adverse effects, including bladder injury, longer recovery times, increased blood loss, postpartum hemorrhage, increased risk of infection, and higher medical costs. In addition, primary cesarean section is a major cause of repeat cesarean delivery. Therefore, it is important to identify the risk factors for emergency cesarean delivery, thereby reducing its incidence. In this study, women who were overweight or obese prepregnancy had an increased risk of emergency cesarean section compared to women with normal prepregnancy BMI. In addition, although there was no association between gestational weight gain (based on the 2009 revised IOM guidelines) and the risk of emergency cesarean delivery, obese women with inappropriate gestational weight gain could have a high risk of emergency cesarean section combined with other complications due to maternal obesity, such as GDM or fetal distress. Therefore, overweight and obese women should be advised to modify their lifestyle (e.g., diet and exercise) to achieve and maintain a normal body weight before and during pregnancy, as this may increase their chance of a successful vaginal delivery. Furthermore, obese women should be counseled suspected complication regarding appropriate gestational weight gain, as it may affect their mode of delivery.

 XML Download