

 PDF
PDF ePub
ePub Citation
 Print
Print


Introduction
Labor induction is one of the most common obstetrical procedures, involving nearly 20% of all deliveries; and the rate continues to rise [1]. In the US, the rate of labor induction has increased steadily from 9.5% in 1990 to 22.8% in 2007 [2]. This increase is attributed to a rise in elective induction [13]. Induction of labor is indicated when benefits (maternal or fetal) of elective early delivery outweigh potential risks imposed by continuing the pregnancy [4], typically in instances of postterm pregnancy, premature rupture of membranes (PROM), oligohydramnios, fetal growth restriction, hypertension, diabetes mellitus, and other maternal or fetal diseases.
A major concern of labor induction is that elective labor induction may increase the risk of cesarean section (CS). A number of studies indicate a higher risk of CS in nulliparous and multiparous women undergoing labor induction, compared with instances of spontaneous labor [3456], while others suggest that labor induction is not a factor in determining the risk of CS [127]. Although this topic has long been debated world-wide, there are only a few published reports on the risk of CS after labor induction in Korean population and they are limited to nulliparous women with PROM or women at or beyond 41 weeks of gestation [89].
The purpose of this study was to evaluate the risk of CS with labor induction in nulliparous and multiparous women without PROM at term. It was also important to discern whether induction itself or the circumstances leading to induction were critical as correlates of CS rate. Additionally, we focused on whether progression of labor was associated with labor induction by assessing the duration of labor and CS rate during the first and second stage of labor.
Materials and methods
A retrospective analysis was conducted at our tertiary prenatal center, in which we recruited women whose labor was either electively induced or spontaneous at 37+0 to 41+6 weeks of gestation between January 2008 and June 2009. This study was approved by the Institutional Review Board for Clinical Research in our institute. Exclusion criteria were 1) multiple pregnancies, 2) planned CS, 3) PROM, 4) placental abruption, 5) in utero fetal death, and 6) non-obstetrical medical diseases. Gestational age was estimated by the date recorded as the first day of the last menstrual period or gauged using prenatal ultrasound measurements.
Patients were stratified by the nature of labor into induction and spontaneous groups. Indications of labor induction were classified into eight categories: past the due date, hypertension, diabetes, small-for-gestational age, large-for-gestational age, oligohydramnios, patient's demand, and others. Past the due date was defined as a gestational age at 40+0 to 41+6 weeks. Hypertension included gestational hypertension, preeclampsia, superimposed preeclampsia, and chronic hypertension. Diabetes included gestational diabetes and overt diabetes. Small-for-gestational age and large-for-gestational age were defined as estimated fetal weight by ultrasound smaller than the 10th percentile and greater than the 90th percentile for gestational age, respectively.
Labor was induced using a vaginal prostaglandin E2 pessary (10 mg of dinoprostone) or oxytocin, either alone or in sequence. Cervical ripening status was given a Bishop score on admission. At a score of 4 or less, a vaginal prostaglandin E2 pessary was inserted for cervical ripening and maintained for up to 10 hours, unless rupture of the membranes, signs of fetal distress, or regular contractions necessitated earlier withdrawal.
Women with spontaneous active labor pain on admission were assigned to the spontaneous group. Active labor pain was defined as regular, painful uterine contractions with progressive cervical dilatation. Oxytocin was used to augment inadequate uterine contractions. Continuous electronic fetal monitoring was used for all patients. Epidural analgesia (if elected) was provided as a continuous infusion of ropivacaine plus fentanyl.
The following data were extracted from the medical records: demographic and obstetric characteristics, pregnancy-related complications, indications for labor induction, cervical examination, gestational age (on admission and at delivery), duration of labor by stage, mode of delivery, and neonatal outcome. The duration of the first stage of labor was calculated from the initiation of active labor with a cervical dilatation of 3 cm or more to full cervical dilatation, and the duration of the second stage of labor was calculated from the full cervical dilatation to the delivery of the baby. However, in order to analyze the effect of labor induction on the duration of labor, patients who had undergone CS before completing the first or second stage of labor were excluded in the comparison of labor duration between the two groups. Induction failure was diagnosed when a woman did not enter active labor pain 1 or 2 days after oxytocin infusion, but the decision to perform a CS for induction failure was made with the discretion of the attending physician.
All statistical analyses relied on standard software (IBM SPSS ver. 19, IBM Corp., Armonk, NY, USA). Student's t-test was employed to compare continuous variables, and categorical variables were compared between groups via chi-square or Fisher's exact test. Multiple logistic regression analysis was utilized to indicate whether labor induction correlated independently with the risk of cesarean delivery once adjusted for CS-related confounders. All tests were two-tailed, with statistical significance set at P<0.05.
Results
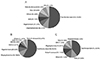
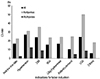
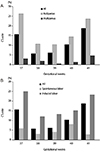
During the study period, 2,500 women had term deliveries at our institute. A total of 1,125 were excluded using exclusion criteria. Labor was induced in 497 women, and 878 women had spontaneous labors (Table 1). The most common indication for labor induction was the past the due date (Fig. 1A). The indications of labor induction were different for nulliparous and multiparous women (Fig. 1B, C). CS rate by indication for labor induction was variable (Fig. 2); highest for hypertension (27%), followed by large-for gestational age (24.3%) and diabetes (24.0%). CS rate by gestational age showed a "J-shaped" curve (Fig. 3); 15.7% in 37 weeks, lowest in 38 (5.8%) and 39 (6.2%) weeks, and a steadily increasing rate after 40 weeks of gestation (10.4% and 18.8%, at 40 and 41 weeks of gestation). However, higher CS rates in nulliparous women (vs. multiparous women) and in the induction group (vs. spontaneous group) were observed in all gestational weeks (Fig. 3).
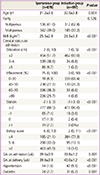
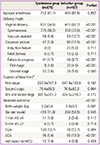
The demographic and obstetrical characteristics of the study population at the time of admission are shown in Table 1. Compared to women in the spontaneous group, women in the induction group were older, had a higher body mass index, and had a more favorable cervix at the time of admission. More women in the induction group had hypertension and diabetes than those in the spontaneous group.
Labor outcomes are detailed in Table 2. CS rate was nearly three times higher in the induction group compared to the spontaneous group (17.3% vs. 5.3%, P<0.001), with primary indications of failure to progress (9.7%), failure of labor induction (5.0%), and fetal distress (2.6%) in the induction group and failure to progress (4.7%) and fetal distress (0.7%) in the spontaneous group. The CS rate due to failure of progression during the first stage of labor was significantly higher in the induction (vs. spontaneous) group. In contrast, there was no statistically significant difference in the CS rate due to failure of labor during the second stage of labor. The two groups did not differ significantly in terms of duration of labor.
The mean birth weight was larger and large-for-gestationalage neonates were more common in the induction group compared to the spontaneous group, whereas other neonatal outcome variables, including gender, Apgar scores (1 minute and 5 minutes), and neonatal intensive care unit admission rate, were similar.
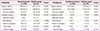
In nulliparous women, induced labor was associated with a significantly higher CS rate and vacuum-assisted delivery (Table 3). The indications of CS were significantly different between the two groups, but the CS rate for failure to progress during the second stage of labor was similar in the two groups. In multiparous women, induced labor was also associated with a significantly higher CS rate and vacuum-assisted delivery, but induction failure was the only factor that resulted in a higher CS rate.
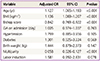
Once adjusted for potential confounding factors, the independent risk factors for CS in both groups were as follows: maternal age, body mass index (BMI), Bishop scores, and parity (Table 4). We used multiple logistic regression analysis for potential confounders. Higher maternal age, higher BMI, lower Bishop scores, and nulliparity were shown to increase the risk of CS. In contrast, gestational age on admission, hypertension, diabetes, and neonatal body weight did not affect the CS rate. In particular, labor induction and CS rate were unrelated.
Discussion
This study was conducted to determine whether induction of labor (as opposed to spontaneous onset) in singleton term deliveries with cephalic presentation heightens the risk of CS in nulliparous and multiparous women. In group comparisons of factors affecting CS and labor outcomes, the CS rate was three times higher with induced (vs. spontaneous) labor, regardless of parity, and significant between-group differences were evident in relation to maternal age, BMI, Bishop score, gestational age, hypertension, and diabetes. Once adjusted for confounding factors, however, only maternal age, BMI, Bishop scores, and parity correlated significantly with a higher CS rate. Importantly, labor induction in itself had no significant impact on CS rate.
Our study also examined progression of induced labor in conjunction with CS rate. The most common indication for CS was failure to progress, especially at the first stage of labor. We found that patterns of labor progression did not differ substantially in induction and spontaneous labor groups. On the other hand, there has been considerable controversy in the literature surrounding the risk of CS. A number of studies have indicated that labor induction is independently associated with a higher (2- to 3.5-fold) risk of CS in nulliparous and multiparous women alike [341011121314]. Our data support this contention, although in the adjusted analysis of factors correlating with this higher rate, labor induction had no bearing at all.
Ehrenthal et al. [3] have reported that labor induction raises the risk of CS twofold, having adjusted for confounding factors (i.e., gestational age, maternal age, and maternal body weight). However, their cohort study was limited to nulliparous women, and they did not address patient management with PROM. An investigation by Seyb et al. [12] corroborated these outcomes with labor induction while including pregnancies with PROM in the study population. Studies often show that the course of labor is impacted by PROM [1516], which should be categorized separately, in addition to induction and spontaneous labor groups. Indeed, findings may be altered by doing this. In our study, we excluded women with PROM because: 1) Among women with PROM, some may already have spontaneous labor pain at the time of admission to hospital and some may undergo labor induction, but it is difficult to discriminate between the two conditions by reviewing the medical records retrospectively, and 2) PROM itself may have some effect on the progression of labor and the CS rate.
In another retrospective study, Caughey et al. [17] discovered that the CS risk in a labor induction group (at 38 to 41 weeks of gestation) was lower than that in a control group of women who were expectantly managed. However, the major limitation of this study is the lack of data on cervical Bishop scores, making it vulnerable to considerable selection bias. In general, labor induction is more common in women with an unfavorable cervical status. These authors also reviewed 36 related studies and concluded that labor induction actually lowers the CS rate [2].
Michelson et al. [15] further maintained that parity, hypertension, diabetes, older maternal age, and higher birth weight influence the rate of CS, but not the induction of labor, and Osmundson et al. [7] also agreed that labor induction does not result in a higher CS rate. Collectively, the above studies show that parity, cervical status (Bishop scores), maternal age, and birth weight may affect delivery approach.
Several aspects of our study confirm its strength. First, the charts were individually reviewed by one investigator to assure group assignment precision to minimize the misclassification bias. In addition, we were able to monitor cervical status during labor progression, which is the chief index of labor induction outcome.
In terms of limitations, this study was retrospective in design, thus selection or confounding bias may exist. Especially, the definition of induction failure and decision to perform a CS was not made uniformly, but made with the discretion of the attending physician. Although the sample size was sufficient for group comparisons, it is possible that slight differences might go undetected. Finally, generalization is problematic, given the single-center construct. Because labor induction procedures differ from center to center, universal reproducibility is unlikely.
In conclusion, our PROM-exempted analysis indicates that labor induction does not affect CS rate. Patient parameters, namely maternal age, BMI, Bishop score, and parity, were instead associated with a higher CS rate. During the course of labor, failure to progress and induction failure correlated with a higher CS rate, whereas duration did not contribute to it significantly. These findings have a significant bearing when counseling pregnant women on the risk of CS associated with labor induction.
 XML Download