

 PDF
PDF ePub
ePub Citation
 Print
Print


INTRODUCTION
With ageing process, bone mineral density (BMD) and muscle mass progressively reduce. Significant BMD downward, osteoporosis, is related with fragile bone fracture and has been empathized in previous literatures.[12] Recently not only bone density, quantitative and qualitative muscular impairment, known as sarcopenia, is drawing attentions and is related with muscle strength decrease, functional impairment, risks of daily activity fall and fracture, delayed recovery from injury, and even mortality.[3456]
Distal radius fracture (DRF) accounts for approximately 16% of all fractures treated by orthopedic surgeons.[7] Contrast to high energy induced DRF, relatively young (5–24 years old) and predominantly male population, DRF in an elderly, predominantly female population commonly occurred with low energy like trivial daily activity.[8]
On the contrary, rotator cuff tear (RCT) of shoulder are prevalent in aged, dominant arm, and male patient, overuse, micro-trauma, impingement.[9101112] Occupational health data have shown that physically demanding work tasks are an independent risk factor for the development of symptomatic rotator cuff disease.[131415] Moreover, dominant arm prevalence indirectly means activity level has a risk factor for RCT.[10]
There have been studies in lower extremity about muscle mass and resulting sarcopenia, however, relatively rare studies were carried out in upper extremity.[51617181920] Therefore, we started surveying of muscle mass in patients of osteoporotic DRF and symptomatic degenerative RCT.
Roh et al.[18] reported a higher prevalence of sarcopenia in patients with DRF compared to age- and sex-matched controls.[72122] Authors assumed that as well as BMD, muscle mass in lower and upper extremity can affect osteoporotic upper extremity fracture, distal radius, compared with overuse and rather activity related RCT in women population.
Dual energy X-ray absorptiometry (DXA) can assess body composition, fat and muscle mass as well as BMD. Though several tools for measurement of muscle mass including bioelectrical impedance analysis, DXA, magnetic resonance imaging (MRI), and computed tomography (CT), DXA are relatively inexpensive and easy to access with low radiation exposure.[423242526]
Authors assessed lean body mass (fat free tissue), upper and lower, and BMD in female patients of DRF and RCT. We predict inferior muscle mass and osteoporosis are more frequent in DRF group than RCT group.
METHODS
1. Methods
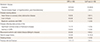
We conducted retrospective case control study under Institutional Review Board approval. Patients of DRF and symptomatic RCT of shoulder over 50 years have been recommended of BMD as well as body composition assessment under patient's consents in one hospital. Between January 2016 and June 2017, we found 70 patients of DRF and 105 patients of RCT with above examination. Patients of male gender, 8 of DRF and 55 of RCT, and age under 50 years, 2 of DRF and 1 of RCT, were excluded remaining in 60 of DRF and 49 of RCT patients. We reviewed medical records by 4 of orthopedic surgeons and identified patient's history including medical diseases, current occupation and activity of daily life, medication history, previous fall and fracture, smoking. Through this process, we attempted to rule out confounding factors which can affect BMD and muscle mass in both groups (Table 1). Overall 38 of DRF and 30 of RCT were eligible for this comparison study.
BMD and other body composition, fat and lean body mass, were assessed with a single DXA in one hospital following manufacturer guideline (Lunar Prodigy Advance; GE Lunar, Madison, WI, USA). BMD from lumbar 1 (L1) vertebral body to lumbar 4 (L4) vertebral body were measured for spinal BMD. The femur neck and total excepting ward triad from of hip joint were measured for femoral BMD. Determination of spinal and femoral bone mineral score were based on previously published protocol.[27] Especially in determine spine bone density score, we followed International Society for Clinical Densitometry vertebrae measurement tool.[27] We calculated average value from L1 to L4 score, however, we excluded vertebrae with fractures or degenerative changes, causing BMD more than 1 standard deviation greater or lower compared with the immediately adjacent vertebrae, cement or pedicle screw insertion site. At least two vertebral bodies should be eligible for mean value of spine BMD score.
Osteopenia, BMD T-score below −1.0, and osteoporosis, BMD T-score below −2.5, were diagnosed on at any site of the lumbar spine, femur neck and total hip lumbar spine BMD according to World Health Organization criteria.[28]
The upper and lower appendicular lean mass (ALM) were assessed for skeletal muscle mass. Furthermore, as an index of relative muscle mass, ALM, sum of upper and lower ALM, was divided by the height squared (ALM/ht2).[3] Instead of western people cuff-off value for sarcopenia diagnosis, men (<7.26 kg/m2) and women (<5.45 kg/m2), adjusted criteria was employed to diagnose sarcopenia in the Asian population (male, <7.00 kg/m2; female, <5.40 kg/m2).[329]
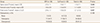
The DRF of 38 patients were all injured from low energy trauma, majority of simple fall from ground height and diagnosed with plain X-ray with or not CT radiograms. Symptomatic shoulder RCT of 30 patients were diagnosed with MRI. All patients of two groups were treated properly, conservative or operative management. Mean age of DRF and RCT were 61.8 and 65.9 with significant difference, respectively. Height and weight of each groups were assessed with subsequent body mass index (BMI) (Table 2). Even though significance were not secured, mean height (1.56 m of DRF, 1.54 m of RCT) and BMI (23.0 of DRF, 24.3 of RCT) presented more or less difference between two groups. Eight of 38 patients (21%) in DRF had current occupation compared with 10 of 30 patients (33%) in RCT.
2. Statistical analysis
The Pearson χ2 test and Fisher's exact test for categorical variables and the Student t-test for continuous variables were used for comparison between groups. Before the Student t-test was performed, the normality test (Shapiro-Wilk test) was applied to continuous variables. Willcoxon rank sum test was carried out in case of negative normality test of continuous value. Less than 0.05 of P-value was considered statistically significance. The statistical evaluation was conducted using software R (version 3.1.0; The R Foundation for Statistical Computing, Vienna, Austria).
RESULTS
Other than ALM of arm, all continuous variables were greater than P-value of 0.05 in the Shapiro-Wilk test, satisfying normality ahead of the independent t-test.
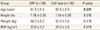
T-score of spine were −2.2 and −1.6 in DRF and RCT patients with significant difference (P=0.040), respectively. Although femoral T-score did not show significant difference (mean score, −1.8 of DRF and −1.5 of RCT), subsequent final BMD score, lower score of patient between spine and femoral score, of both group also presented difference with significance, −2.4 of DRF and −1.9 of RCT patients (P=0.047). Diagnosis of osteoporosis were confirmed in 19 patients (50%) from DRF compared with 9 patients from RCT group (30%) (Table 3).
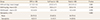
The median soft tissue mass of the arm was 3.7 kg and 3.8 kg in the DRF and RCT groups, respectively, without significant difference (P=0.882). The mean lean body mass of the leg was 11.0 kg and 10.5 kg in the DRF and RCT, respectively, without significant difference (P=0.189). The relative overall ALM was not significantly different between groups (DRF, 6.0 kg/m2; RCT, 6.0 kg/m2; P=0.976). Nine patient out of 38 patients (23.7%) in the DRF group were diagnosed with sarcopenia based on the Asian diagnostic criteria, compared with 5 individuals (16.7%) in the RCT; this difference was not significant by the chi square test (P=0.683) (Table 4).
DISCUSSION
Contrast to our initial argument, lean body mass, representative of muscle mass, did not result in significant difference between two groups. The ALM of arm and leg did not differ between two groups as well as adjusted parameter, sum of arm and lower leg ALM divided by square of height. Finally 9 (23.7%) of patients belonged to sarcopenia criteria compared with 5 patients (16.7%) of sarcopenia in RCT group.
Instead there were significant difference in T-score from spinal BMD and overall (lowest score from spina, femur neck, and total femur). Though without significance, 19 patients (50%) were diagnosed with osteoporosis in DRF compared with 9 patients (30%) were diagnosed in RCT group. Osteoporosis is well-kwon risk factor for fragile fracture; DRF, spine fracture, and hip fracture.[1] We expected lower BMD outcome in DRF before statistical comparison and corresponding results were followed. Although patents age, critical risk factor for BMD, of DRF (average of 61.8 years) were lower than RCT (65.9), outcome presented meaningful BMD inferiority.
The sarcopenia is an issue of recent interest and is more defined as syndrome, loss of muscle mass and function, rather than disease.[30] Despite of numerous attempts to identity sarcopenia affecting functional impairment, there are still controversies in definition, measurement, diagnosis algorithm, and criteria.[24253132333435]
Regardless of bone density, sarcopenia appears to be an independent risk factor for fragility fractures leading to a condition known as sarco-osteoporosis.[24] Authors assumed that inferior arm muscle mass is likely to induce DRF with trivial injury since its low protective function for distal radius. Besides the sarcopenia correlates with functional impairment in daily living; difficulty in walking, climbing upstairs, and moving slowly, it increases the risk of falls and subsequent fracture.[36] Therefore, we suspect patients of DRF also has implicit chance of compromised muscle mass as well as BMD. However, we did not find muscle mass difference between two groups.
Only a few studies about upper extremity patient were reported up to now.[181937] Especially, only one recent study is available about relationship between sarcopenia and RCT.[37] Chung et al.[37] reported sarcopenia was more severe in patients with a chronic symptomatic full-thickness RCT than in the age- and sex-matched control population. However, they even could not explain mechanism of relationship and merely presented results. Our initial assumption, lower muscle mass in DRF than RCT, could be wrong according to Chung et al.[37]. Overall, sarcopenia of upper extremity patients are not fully understood. Our result, no difference in muscle mass, might derived from both DRF and RCT inherently correlation with sarcopenia.
Although the aging process is a definite cause of sarcopenia, other reasons for sarcopenia have been reported, including reduced mobility, inadequate nutrition, neurodegenerative diseases, malignancy, chronic renal and endocrine disorders (mainly diabetes, abnormal thyroid function and low levels of vitamin D, sex steroids, growth hormone and insulin-like growth factor-1), cardiometabolic disease, and nutritional deficiency.[303638] Both osteoporosis and sarcopenia share various pathophysiological pathway and subsequent risk factors explaining synchronous loss of bone and muscle mass.[38] Authors attempted to exclude above confounding factors which can affect our comparison study.
There are several limitations of our study. We attempted to set aside compounding factures and excluded patients of relevant medical condition. As a result only 38 and 30 of DRF and RCT patients were enrolled and compared. Our study was also retrospective design. Though we meticulously reviewed medical records of patient by 4 of orthopedic surgeon, there has been chance of undetected past history. Muscle mass is not sufficient for sarcopenia diagnosis. Muscle strength and physical performance were not considered in this study.[3] Though there was statistical significance, height and BMI average difference between two groups were not adjusted. Further study considering above factors will be better.
Finally, in different with initial argument, patients with DRF did not have significantly lower lean body mass; instead, BMD was significantly lower in patients with DRF than in controls. Further study with more patients, possible prospective study, will be required in next step in upper extremity sarcopenia experiment.
 XML Download