

 PDF
PDF ePub
ePub Citation
 Print
Print


INTRODUCTION
Bisphosphonates (BPs) are agents currently used to treat osteoporosis and decrease the risk of osteoporosis-related fractures. Since the introduction and development of these drugs, increased bone mineral density (BMD) in the lumbar spine and hip (total hip or neck) has been the main focus for evaluation of their effectiveness along with decreasing the risk of fragility fracture.[1] Even though the effect of BP agents in preventing osteoporotic fracture is eminent, their strong association with atypical femoral fracture (AFF) after a long-term administration has recently been reported.[2345678] Excessive suppression of bone remodeling after a long-term BP intake has been thought to deteriorate bone quality and to cause pre-fracture lesions. The lateral femoral cortex is affected, not the medial femoral cortex, presenting as periosteal callus and the dreaded black line on radiographs.[9101112] The lateral femoral cortex in the subtrochanteric area is under a considerable tensile stress during the gait cycle, while the medial cortex in this area is under a compressive stress. Cortical bone is weaker upon tensile stress than in compressive stress, which means the lateral cortex is more subject to structural damage and repair.[13]
On the other hand, differences in the pharmacokinetics of alendronate and risedronate can cause difference in bone mineral deposition, which are known to be affected by mineral affinity, farnesyl pyrophosphate synthetase inhibition, and the effect of BP binding to hydroxyapatite on the surface charge [zeta potential].[14] Additionally, recent articles have reported the different risk of AFF according to different BPs.[615]
In this context, we speculated that the pharmacokinetic differences specific to each BP agent may cause different cortical responses at the subtrochanteric lateral cortex (STLC). This might be one of the plausible explanations for the differences in AFF risk among the BP agents. Therefore, the purpose of this study was to retrospectively assess whether the response of the STLC is different according to two kinds of BP agents by tracing the changes of BMD using serial dual energy X-ray absorptiometry (DXA) examinations.
METHODS
This research protocol was in compliance with the Health Insurance Portability and Accountability Act (HIPAA) and was approved by the Institutional Review Board (IRB). Informed consent was waived by the IRB for this retrospective study.
1. Subject enrollment
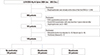
From January 2004 through June 2013, a total of 2,278 female individuals received DXA examination by a single technician at the Kyungpook National University Hospital. From these individuals, 149 subjects who had serial DXA examinations during two or more years after taking a BP (alendronate or risedronate) as naïve users or simply undergoing a health check-up were enrolled. Exclusion criteria were as follows. Subjects who were already taking a BP at the time of the first DXA examination (n=1,318) were excluded. Among the remaining 960 subjects, subjects who underwent DXA examinations just once (n=142) or had serial DXA examinations with less than a 2-year interval after BP use (n=657) were also excluded. From the remaining 161 patients, subjects who acquired an endocrine disease that could possibly affect BMD (n=2), taking a steroid (n=9), or with acquired Parkinson's disease (n=1) were excluded additionally. Finally, 149 subjects whose first and follow-up DXA examinations were separated by a 2-to 4-year interval were included (Fig. 1). Among them, 38 did not take any anti-osteoporotic drugs (control group), 48 were naïve alendronate users (the alendronate group), and 63 were naïve risedronate users (the risedronate group). The baseline characteristics of each group, including the mean age, time interval between DXA examinations, and body mass index (BMI), were recorded based on the medical record. The medication duration of the patients in the medication groups was regarded as the time interval between DXA examinations since the included patients were naïve patients and started the medication at the time of the first DXA examination.
2. DXA examination
Serial DXA examinations were performed in each patient by a technician using the same Lunar Prodigy scanner (GE Lunar, Medison, WI, USA) without changing the software or hardware of the DXA scanner. No events occurred that could have caused any changes in basic scanning skills during the study interval. Posteroanterior (PA) spine and unilateral hip (right hip in all patients) DXA examinations were performed. The DXA examination was performed according to the vendor-recommended protocol for the scanning method and patient positioning. The entire scanning data source was backed up on separate storage devices at the institution from which the data were collected. The source scanning data were used for the measurement of BMD in this study.
3. BMD measurement of the spine, hip, and subtrochanteric cortex
The pre- and post-medication BMDs for the spine and hip were measured in the alendronate and risedronate groups to validate whether the medication compliance was acceptable. The BMD of spine was measured at the L1-L4 spines; whereas, the hip BMDs were measured at the total hip, neck, trochanter, and Ward's area by placing region of interest (ROI) provided by the vendor. BMD measurement was performed using GE-Lunar Encore software (version 13.6) by the same technician who performed the DXA examination. Technician precision was assessed with the commencement of this study by measuring the BMD twice from the 30 DXA images from our study according to the recommendation stated in the International Society of Clinical Densitometry (ISCD) guideline 2005.[16] Precision for lumbar spine and femoral neck were 1.6% and 1.9%, respectively. All the measured BMD data were recorded as g/cm2.
The BMD of the subtrochanteric cortical bone was measured by the aforementioned technician who measured the BMD of the spine and hip. BMD was measured at the STLC and subtrochanteric medial cortex (STMC) for each patient at the level just distal to the lesser trochanter. Rectangular ROIs were drawn at the cortices. As for the width, ROIs were drawn not violating the boundary of the cortices. The proximal to distal length of the ROI was unified as 1 cm (Fig. 2). All of the measured BMD data were recorded as g/cm2. The BMD of the STMC was measured to assess whether that region was associated with changes in the STLC BMD.
To assess the reliability of this measurement, 30 patients were randomly selected, and the technician measured the BMD again as described above with a time interval of 2 months, not to be biased by the memory of the first measurement.
4. Measurement of hip axis length (HAL)
HAL reflects the hip moment arm and we speculated that this value would reflect the load on the subtrochanteric cortex of the femur where the maximal strain is known to be loaded [13] and could affect the change of BMD at the STLC. HAL was measured along the extended femoral neck axis until the edge of the bone in each direction (Fig. 2). The measurement was performed twice by an orthopedic surgeon on the image taken at the first DXA examination in each patient, and the mean values were recorded as cm.
5. Measurement of BMD change and its assessment
To test the difference in BMD changes between the first and the second DXA examinations, a standardization of the BMD change was needed because we believed that the same amount of BMD changes cannot be considered the same when the baseline BMD was different. Therefore, we obtained the percent changes. The percent changes were calculated for the STLC, STMC, spine, and total hip, and were assessed statistically as stated below considering two aspects: 1) to compare the percent changes of the total hip and spine BMD between the medication and control groups to ascertain the optimal compliance of the patients who took the medication, and 2) to test the difference in the lateral cortex percent changes according to the agents received.
6. Statistical analysis
Data were summarized as means±standard deviations with ranges for continuous variables and as counts and percentages for categorical variables. The reproducibility of the BMD measurement of the subtrochanteric cortex was evaluated using the intraclass correlation coefficient (ICC). An ICC value was evaluated as follows: 0 to 0.20, poor agreement; 0.21 to 0.40, fair agreement; 0.41 to 0.60, moderate agreement; 0.61 to 0.80, substantial agreement; 0.81 to 1.00, nearly perfect agreement. A single measures ICC value was obtained.
To test whether there was a difference the percent change of BMD in the hip, spine, or STLC among the groups (control, alendronate, or risedronate), an analysis of covariance (ANCOVA) model was adopted to control five independent variables. The variables were age, BMI, BMD percent change of STMC, HAL, and the time interval between DXA examinations. Concurrently, we assessed whether any of the variables other than medication (none, alendronate, or risedronate) could affect the percent change of BMD. HAL was included as one of the variables to be assessed to control geometry of the STLC that might affect the BMD change, which was mentioned above.[13] BMD of STMC was included as a variable to further control unexpected effects on BMD at the subtrochanteric cortices other than geometry. Using the ANCOVA model, the least square means of the percent change for the hip BMD, spine BMD, and STLC BMD were obtained for each group, and multiple comparisons were performed to assess the group differences. Subsequent post-hoc comparison t-tests with Bonferroni correction were also used. All statistical analyses were performed using SAS 9.2 software (SAS Institute, Cary, NC, USA). Statistical significance was assigned when the adjusted P-value was less than 0.05.
RESULTS
The subject's age, interval between the first and the second DXA examinations, BMI, and HAL are summarized in Table 1.
1. Reproducibility of the BMD measurement at the subtrochanteric cortex
In the representative 30 cases, in which the cortical BMD at the subtrochanteric area was measured twice, the mean BMD values of the medial cortices at the first and second measurement were 2.11±0.28 g/cm2 (range, 1.68-2.82) and 2.16±0.29 g/cm2 (range, 1.59-2.78), respectively. Those of lateral cortices were 1.86±0.31 g/cm2 (range, 1.25–2.61) and 1.80±0.36 g/cm2 (range, 1.24-2.54), respectively. Overall ICC values obtained from the two separate measurements of cortex BMD at the subtrochanteric area were 0.87, which was in the range of near perfect agreement.
2. Differences among the medication groups in BMD percent change of the spine and total hip
In the ANCOVA, the percentage change of the spine BMD was affected by medication (P<0.001) and the time interval between DXA examinations (P=0.026). On this analysis, the increase in percent change of the spine BMD per month of DXA interval, which corresponds to the correlation estimate±standard error, was 0.11±0.05. Additionally, in the ANCOVA of the percent change of the hip BMD, the percent change was also affected by medication (P<0.001) and the time interval between DXA examinations (P=0.029). The increase in the percent change of the hip BMD per one month of DXA interval, which corresponds to the correlation estimate±standard error, was 0.07±0.03.
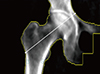
In the assessment of the BMD percent change difference of the spine among medication groups after the control of the dependent variables, the least square mean values±standard error of the BMD percent change of the spine in control, alendronate, and risedronate groups were -0.18±1.18, 6.11±1.01, and 4.90±0.90, respectively. The risedronate (adjusted P=0.003) and alendronate (adjusted P< 0.001) groups showed a significantly higher percentage change than the control group in the multiple comparison analysis (Fig. 3A).
In the assessment of the BMD percent change difference of the hip among medication groups after the control of dependent variables, the least square mean values±standard error of the BMD percent change of the hip in the control, alendronate, and risedronate groups were -1.83±0.75, 1.13±0.64, and 1.86±0.57, respectively. The risedronate (adjusted P<0.001) and alendronate (adjusted P=0.01) groups showed a significantly higher percentage change than the control group in the multiple comparison analysis (Fig. 3B).
3. Differences among the medication groups in the STLC BMD percent change
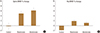
In the ANCOVA, the percent change of the STLC BMD (P=0.009) and the STMC BMD (P=0.004) were both affected by medication. On this analysis, the increase in the percent change of the STLC BMD with per 1% increase of STMC BMD, which corresponds to the correlation estimate±standard error between them, was 0.23±0.09. The least square mean values±standard deviation of the BMD percent change in the control, alendronate, and risedronate groups were 1.46±1.50, 2.23±1.26, and 6.96±1.11, respectively. The risedronate group showed a significantly higher percent change in BMD than the control (adjusted P=0.012) or alendronate (adjusted P=0.016) groups (Fig. 4).
DISCUSSION
Both drugs, alendronate and risedronate, increased the BMD of the spine and hip significantly after the years of administration on this study suggesting compliance of the patients enrolled was acceptable. After controlling the dependent variables of age, BMI, STMC percent change, HAL, and the time interval between DXA examinations, we observed that the increase in the STLC BMD of the risedronate group was significantly higher than that of the alendronate group. Our study can be considered disputable as BMD gain at the spine and hip has been known to be larger in alendronate user groups than in risedronate.[17] However, although there is no debate about the superiority of alendronate to risedronate in BMD gain at the trabecular bone, there is still debate about this superiority at the cortical bone.[18] Additionally, on the basis that the patient has a normal mechanical axis of the lower limb, the tension strain on the STLC of the femoral shaft is highest in the subtrochanteric area during the gait cycle. The strain is approximately 2,000 µε, which could cause a microcrack in the STLC during daily activities.[13] The cortical bone under tensile stress in the STLC is expected to be subject to high metabolic and remodeling demand. Considering this aspect, although several investigators raised objection, thickening of the STLC was once thought to be an important factor in the development of AFF in the long term BP users.[192021] We believe that the difference in pharmacokinetics between alendronate and risedronate can affect the increase in BMD differently at the STLC, where the metabolic and remodeling demand is high as mentioned above, and the difference supports our observation like follows.[1422] The kinetic binding affinity of BPs for hydroxyapatite in ascending order are clodronate<risedronate<ibandronate<alendronate<pamidronate<zoledronate. The inhibition power against farnesyl pyrophosphate synthetase in ascending order are clodronate<pamidronate<alendronate<ibandronate<risedronate<zoledronate. Zeta potential is regarded as an independent property that does not correlate directly with affinity, but rather influences binding capacity. Zeta potential is highest in alendronate and lowest in risedronate among the BPs mentioned above. [14] Another previous article also reported that mineral binding affinity significantly affects the distribution of BPs around the newly forming cortical bone osteons in the rib and trabecular hemiosteons of the vertebrae.[23] BPs with lower binding affinities to hydroxyapatite, such as risedronate, has a greater capacity to reach these areas deep in the bone, where the most vulnerable osteocytes reside. Even without affecting the osteocytes, more widespread distribution of drug throughout the cortex could provide a more uniform reduction in remodeling.[2324] Based on our results and the aforementioned articles regarding kinematics of these two BP agents, we postulated that the wide mineral distribution in the STLC and strong inhibition of farnesyl pyrophosphate synthetase resulted in larger BMD increase of STLC in the risedronate group than the alendronate group.
We believe that the difference of BMD increase on this study between risedronate and alendronate might give us a plausible explanation about the difference of the AFF risk between these BP agents. Long-term use of BP has been regarded as having possible correlation with AFF and osteonecrosis of the jaw.[102526] Most of the reported AFF cases were alendronate users, which might have been associated with the fact that alendronate was introduced in the market in 1995 and has been used for longer period of time compared to risedronate which was introduced in 2005. The first comprehensive case series of AFF associated with BP was reported in 2007 from Singapore. The case series reported that 9 patients took alendronate for several years among the 13 patients who sustained AFF.[3] As for the large investigation comparing AFF risk between the different BP user groups, an investigator group analyzed the data from the U.S. Food and Drug Administration (FDA) Adverse Event Reporting System (FAERS) and from the international safety efforts regarding BP and AFF. The investigators showed that the proportional reporting ratio and odds ratio were approximately two times higher in alendronate users than in risedronate users.[15] On the other hand, Schilcher et al. [7] analyzed 59 cases of AFF and found no differences in risk of AFF between alendronate and risedronate user. However, they recently reported that multivariable adjusted odd ratio was almost three times higher in alendronate users than in risedronate users.[6] Although further study is needed to determine whether difference in BMD increase is the only parameter that explains why the alendronate group showed larger AFF risk than the risedronate group, we believe that our result demonstrated that BMD at the STLC is worth including as one of the parameters. An article also demonstrated that various parameters including BMD gain and mechanical property was superior in risedronate group than in alendronate group, partly supporting our observation although the investigation was based on short-term experimental data obtained from ovariectomized rat.[18]
STLC has been attracting attention as the location for monitoring of AFF occurrence by using various imaging modalities. Localized periosteal or endosteal thickening of the STLC on radiograph was previously defined as a minor feature on the previous report released by a task force team of the American Society for Bone and Mineral Research in 2010.[27] However, the changes in the STLC have been recently upgraded to a major feature in their second report.[11] Among five major features of AFF, three are related to the lateral cortex.[11] Detection of subtle change at the STLC has been scrutinized whether it can be used as a predictor for AFF occurrence.[2829] We believe that our study results suggest that not only image-based morphological changes, but also BMD measurement at the STLC is feasible and can be used as a monitoring tool for investigation related to the occurrence of AFF. On the basis, we should address that the BMD measurement at the medial and lateral cortices of the subtrochanteric femur were reproducible. No software supplied by the vendors has been developed to automatically check the BMD at the STLC and STMC, so there are concerns about the errors in repeated measurements of BMD in sequentially captured DXAs. Nevertheless, the overall ICC value for the measurement of the cortical BMD was in the range of near perfect agreement.
There are several limitations on this study. First of all, the number of enrolled patients and follow-up years was not large enough, which was inevitable due to retrospective nature of the study. Second, direct evaluation of the mechanical strength of and stress on the femur in the subjects was impossible, which expectedly affected the changes in the BMD on the STLC. However, indirect mechanical consideration through HAL in our study revealed the independent influence of medication on the STLC BMD. Third, an additional study to verify the association between the subtrochanteric cortex BMD and AFF risk needs to be further performed before recommending routine use of this measurement in clinical practice. Fourth, we acknowledge that BMD measurement at the STLC and STMC is not an established method once more. However, we believe that this concern has been solved by reproducibility test for the measurement in our study. Fifth, there was wide range of observational period in each group, which might have been substantial bias for the results.

 XML Download