

 PDF
PDF ePub
ePub Citation
 Print
Print


INTRODUCTION
The current concept of sarcopenia was defined by Rosenberg (1989) as a condition involving a loss of muscle mass and strength due to age.[1] Age-related changes in body composition include decreased bone mineral density (BMD), sarcopenia, and hormonal fluctuations.[2] After 30 years of age, BMD decreases at an average rate of 1% per year. Muscle strength also declines during this time, with a gradual 10% loss from 25 to 50 years.[3] A progressive loss of muscle mass occurs from 40 years of age, which has been estimated at about 8% per decade until the age 70 years.[4] It is a complex medical condition that impacts on reduced mobility, increased disability, a higher risk of falls, reduced quality of life, increased health care costs, and ultimately, risk of mortality.[5-7]
Previous research has found the presence of an osteoporotic spinal fracture to be associated with reduced back extensor strength[8,9] decreased spinal mobility[10] and altered balance characteristics,[11,12] while few studies have addressed the changes of cross sectional area (CSA) in paraspinal muscles. Magnetic resonance imaging (MRI) and computerized tomography are the most specific techniques for the assessment of muscle mass or cross sectional muscle area.[13,14] Muscular strength is proportional to the CSA of the muscle, and measurement of the CSA of muscle is usually used to evaluate lumbar muscular strength.[15] Therefore, the aim of this study was to investigate the changes of CSA in paraspinal muscles upon MRI and BMD in postmenopausal osteoporotic spinal compression fractures.
METHODS
We retrospectively reviewed 81 postmenopausal women with osteoporosis, who had underwent a conventional lumbar spine MRI examination from June 2009 to December 2012 in a single hospital. The patients were divided into 51 patients who had osteoporotic spinal compression fractures (group I), and 30 patients without osteoporotic spinal compression fractures (group II). Group I were subdivided into 21 patients who were under 70 years of age (IA), and 30 patients who were over 70 years of age (IB). We excluded patients who had vertebral fracture by high velocity injury, such as a motor vehicle accident or falling down from a height, and previous spine fusion operation. The BMD (mg/cm3) of all patients was measurement for the lumbar spine. In each group, we determined age, body mass index (BMI, kg/m2) based on weight and height, and compared the data with a control group (30 premenopausal women under 50 years of age with no spinal fractures. BMD of the thoracolumbar vertebrae was measured utilizing peripheral quantitative computed tomography (P-QCT; Somatom sensation 16, Simens, Erlangen, Germany), which enables the separate analyses of cortical, trabecular and total bone density, including T-score. Osteoporosis was defined as the BMD below 80 mg/cm3 and T-score below -2.5.
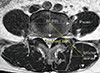
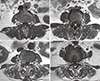
The axial scans were located through the lumbar intervertebral (IV) disc level using 1.5 Tesla MRI (Achieva; Philips Healthcare, Best, Netherlands). The images were pixel digital images with regions of interest (ROI) and they were stored in Picture Archiving and Communication System (PACS). The maximum anatomical CSA (mm2) was located between the L3/4 and L4/5 IV disc level in the neural posture, and the psoas major muscle (PT) was largest at the L4/5 IV disc level.[16] Therefore, the mean CSA from both sides of multifidus, erector spinae, paraspinal muscles (the multifidus and the erector spinae), PT, and disc were measured by drawing their outlines with ROI in the L4/5 IV disc level using axial T1 weighted MRI, which have been previously detailed.[16,17] The moment arm length (MAL, cm) was defined as the anterio-posterior distance between the center of the erector spinae and that of the IV disc (Fig. 1). Besides the measurement of the CSA, an assessment of fat composition can also be used to estimate the degree of atrophy of the paraspinal muscle.[18] The fat infiltration in the paraspinal muscle was measured semi-quantitatively with three visual scale grades at the L4/5 IV disc level.[19] The scale defined mild grade as a fat portion below 10%, moderate grade as 10-50% and severe grade as above 50% (Fig. 2). All measurements were independently performed by two orthopedics and one radiologist.
The result was obtained using independent t test and ANOVA. All values recorded in this study were presented as mean (standard deviation [SD]). SPSS software version 19.0 (SPSS Inc., Chicago, IL, USA) was used for all statistical calculations. The Shapiro-Wilk test was performed in order to choose the appropriate statistical test for further analysis of the data. The data was normally distributed, and statistical significance was set at P<0.05 for all tests.
Results
The mean age of group IA was 65.7 years (range, 60 to 69 years) and that of group IB was 77.7 years (range, 71 to 89 years). The mean age of group II was 67.4 years (range, 57 to 76 years) and that of the control group was 39.0 years (range, 20 to 50 years). The mean BMI of group IA was 22.2 kg/m2 (mean weight/mean height: 55.3 kg/157.9 cm), group IB was 22.1 kg/m2 (mean weight/mean height: 53.3 kg/155.2 cm), group II was 22.9 kg/m2 (mean weight/mean height: 56.8 kg/157.5 cm), and control group was 22.4 kg/m2 (mean weight/mean height: 58.7 kg/162.0 cm). The mean BMD and T-scores were: group IA, 56.6 mg/cm3 and -3.72; group IB, 50.9 mg/cm3 and -4.17; and group II, 70.4 mg/cm3 and -3.22.
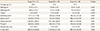
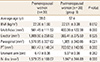
The BMD values of group I were significantly lower than those of group II (P=0.000). Also, the T-score of group I was significantly lower than those of group II (P=0.000). The mean CSA of erector spinae, paraspinal muscles, and PT in the group IA and IB were significantly smaller than those of group II. However, the mean CSA of multifidus was not significantly different between the two groups. The CSA of IV disc and MAL were not significantly different between the two groups (Table 1).
The mean CSA of multifidus, paraspinal muscles, PT and CSA of IV disc in the group II were significantly smaller than that of control group. However, the mean CSA of erector spinae and MAL were not significantly different between the two groups (Table 2).
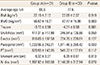
The BMD values of group IB were significantly lower than those of group IA (P=0.003). Also, the T-scores of group IB were significantly lower than those of group IA (P=0.001). The mean CSA of paraspinal muscles in group IB were significantly smaller than those of group IA (P=0.033). The mean CSA of erector spinae, multifidus, and PT in group IB were smaller than those of group IA, but the difference was not statistically significant. Rather, The CSA of IV discs was larger in group IB than in group IA with no statistically significantly different between the two groups (Table 3).
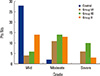
The fat infiltration grades in the paraspinal muscle of the control group were almost all mild grades, except for moderate grades determined in two patients. The numbers of patient of moderate and severe grades of group IA were 11 (52.4%) and 6 (28.6%) patients and those in group IB were 14 (46.7%) and 10 (33.3%) patients, and then severe grades of fat infiltration in the paraspinal muscle were more common in group I than in group II (Fig. 3).
Discussion
In recent years, numerous data regarding the size and properties of muscle in patients with low back pain have been published.[19,20] Advancing age is associated with profound changes in the spine, such as atrophied lumbar paraspinal muscle with a reduction of CSA, biochemical degenerative change of IV disc with decrease disc height which dehydration and increased intramuscular fat infiltration.[21] In the present study, we measured the CSA of paraspinal muscle, psoas major, and IV disc and MAL of the erect spinae in the lumbar spine, in order to quantitatively evaluate muscle atrophy.
Previous research has found the presence of an osteoporotic spinal fracture to be associated with reduced back extensor strength,[8,9] decreased spinal mobility,[10] altered balance characteristics compared to individuals with osteoporosis, and no history of vertebral fracture.[11,12] However, there are only a few of published studies relating to the quantitative evaluation of back muscles in osteoporotic spinal compression fractures. Sinaki et al.[8] compared the extensor muscle strength of the spine of postmenopausal women with and without osteoporosis. They reported that strength was reduced in women with osteoporosis, and that this reduction increased with age. These data show that reductions in extensor muscle strength and postural abnormalities are associated with osteoporosis. Muscular imbalance may also favor the aggravation of the sagittal curvature of the vertebral spine and limit the range of motion.[9] Hyperkyphotic posture is a well-known complication of osteoporosis.[22] According to the lower back biomechanical model, the lumbar disc compression force and trunk muscle load depend on the MAL and CSA of the trunk muscles.[23] The elongation of MAL is effective in suppressing the compression force by reducing muscle activity. Vertebral fractures have been associated with increased segmental spinal loads and trunk muscle forces may be predicted through biomechanical models using optimization routines.[24] Women with osteoporosis had reduced flexibility and mobility that affected their walking and limited daily activities, contributing to a greater risk of falling and fracture.[11,12]
The CSA and fat content of the muscles have been evaluated by ultra-sonogram, computed tomography (CT), and MRI. MRI and CT are considered the golden standard and the most accurate imaging methods to assess muscle mass, muscle CSA and muscle quality, as determined by muscle density and intramuscular fat infiltration.[13,14] However, the high cost and operative complexity limit their use in clinical trials and clinical practice. In this study, MRI was carried out to confirm the diagnosis of osteoporotic spinal compression fractures.
Quantitative evaluation of back muscle strength involves measuring the CSA of the multifidus and the erector spinae, and measuring the isometric and isokinetic strength of the trunk muscles. Muscular strength is proportional to the CSA of the muscle (and is also associated with histologic characteristics, such as muscle composition and muscle fiber type), and measurement of the CSA of muscle is usually used to evaluate lumbar muscular strength.[15] Lee et al.[20] reported that the CSA of back muscle influenced the strength of trunk flexors and total trunk muscles in middle aged chronic low back pain patients. A limitation of this study was that muscle strength was not measured, but we did determine the CSA of muscle.
Sarcopenia is considered to be one of the main features of the aging process. It is characterized by a reduction in muscle mass and muscle strength, and affects women more than men.[25] Individuals with both osteoporosis and sarcopenia (the hazardous duet), so-called "sarco-osteoporosis", might be at higher fracture risk than those with osteoporosis or sarcopenia alone, especially if frail.[6,26] Associations with sarcopenia and osteopenia/osteoporosis in women have been reported in several studies.[27,28] Sarcopenia is associated with low BMD and osteoporosis in middle-aged and elderly men.[27] In Japan, sarcopenia is significantly associated with osteopenia and osteoporosis in a total 2,400 women.[28] As reports of osteoporotic fracture patients with sarcopenia are rare, we studied the association of osteoporotic spinal compression fractures with sarcopenia.
There were further limitations in this study. First, the small number of the subjects may have affected the statistical analysis. Second, this study is retrospective in nature, due to the sampling problems that are inherent to this mode of investigation.
In conclusion, postmenopausal osteoporotic spinal compression fracture results in profound changes in the spine, such as atrophied lumbar paraspinal muscle with a reduction of mean CSA, increased CSA of IV discs with aging, and increased intramuscular fat infiltration. This suggests that the women with osteoporotic spinal compression fractures had reduced paraspinal muscle volumes, resulting in a greater risk of falling and fracture.
 XML Download