

 PDF
PDF ePub
ePub Citation
 Print
Print


Introduction
Human dental pulp cells (HDPCs) are considered a good source of multipotent mesenchymal stem cells (MSCs) to use in various clinical applications, including dental tissue engineering and regenerative endodontics.12 Most HDPCs are postmitotic, but some are still able to divide and give rise to new pulp cells, even odontoblasts to form new dentine.34 All HDPCs and blood vessels are embedded in a specific rich extracellular matrix that creates a microenvironment capable of promoting repair processes.5
Recently, HDPCs have been found to possess stem cell properties.5678 For example, HDPCs express MSC markers and can give rise to multiple lineages in vitro.5910 In addition, these dental pulp stem cells (DPSCs) produce tissue resembling the dentin-pulp complex when transplanted into immunosuppressed mice.11 In a pre-clinical study, deciduous DPSC/scaffold complex presented successful dentin regeneration in a direct pulp-capping model in swine.12 HDPCs had a stimulatory effect on host angiogenesis and enhanced wound healing during soft tissue regeneration.13 These results imply that DPSCs could be very useful in dental tissue regeneration. Dental pulp tissue regeneration using DPSCs has the potential to dramatically alter conventional approaches to endodontic treatment.414
HDPCs are derived from an easily accessible tissue source, which can be further expanded for tissue engineering purposes by using both deciduous and permanent teeth. The collection of HDPCs from extracted teeth is easier and safer than the collection of MSCs from bone marrow.15 HDPCs have been shown to provide immunological benefits in allogenic stem cell transplantation151617 and are also being evaluated as a source of stem cells for cell banking.1819
To establish the optimal protocol for dental tissue engineering and regenerative endodontics using DPSCs, it is important to examine the characteristics of the cells that may generate under different conditions. Stem cells have been isolated from dental tissue using either the outgrowth method (the OG method)32021 or by the enzymatic digestion method (collagenase/dispase/trypsin, the ED method).522 Both the isolation method and the culture conditions have been shown to affect the characteristics and types of stem cells formed during in vitro growth.16 Most studies comparing the two different HDPC culture methods have focused on comparing the osteogenic differentiation abilities of cells derived by the two methods.1623 However, few studies have analyzed the multilineage differentiation potentials and other stem cell properties of MSCs derived from human dental pulp using these two methods. Therefore, in this study, we compared the stemness of HDPCs derived from two different culture methods, both individually and in combination.
The aim of this study was to characterize HDPCs obtained by different culture methods to establish the most suitable methodology for dental tissue engineering and regenerative endodontic applications. We examined the morphology, immunophenotypic markers, and osteogenic/adipogenic/chondrogenic potential of these HDPCs to characterize the stemness of HDPCs derived by three culture methods (OG, ED, and Combined). The following null hypotheses were evaluated: 1) there would be no differences in morphological characteristics of HDPCs according to the culture methods and 2) there would be no differences in characterization of stem cells derived from HDPCs according to the culture methods.
Materials and Methods
Sample collection and cell culture
Intact caries-free premolars extracted for orthodontic purposes were obtained from five systemically healthy adults (19 - 45 years old, n = 10) at the Department of Conservative Dentistry, Kyung Hee University Dental Hospital at Gangdong. Tooth collection followed a protocol approved by the Institutional Review Board of Kyung Hee University Hospital at Gangdong (KHNMC IRB 2013-01-200), and written informed consent was obtained from all the patients. Immediately after extraction, the teeth were placed in basic medium (Dulbecco's modified Eagle's medium, DMEM), transported to the laboratory, and washed with phosphate-buffered saline (PBS, Invitrogen, Carlsbad, CA, USA). The tooth surfaces were cleaned and the pulp chamber was revealed by cutting around the cementoenamel junction with sterilized dental fissure burs. The pulp tissue was gently separated from the teeth and divided into fragments approximately 1 mm × 1 mm × 2 mm in size. HDPCs were then isolated and cultured by three different methods: the OG method,24 the ED method,525 and the Combined method.
For the OG method (HDPCs-OG), the dental pulp tissue was placed in 6 well plates in DMEM supplemented with 10% fetal bovine serum (FBS) and antibiotics. Upon reaching confluence, the outgrown cells were transferred to 5 × 10 cm culture dishes (passage 1). HDPCs-OG and HDPCs-ED were grown to confluence, continuously passaged at a three-fold dilution, and used at passages 2 - 4.
For the ED method (HDPCs-ED), the dental pulp tissue was digested in a solution of 3 mg/mL collagenase type I and 4 mg/mL dispase (Sigma, St. Louis, MO, USA) for 30 - 60 minutes at 37℃. HDPCs were obtained by passing the digested tissue through a 70 µm cell strainer (Falcon, BD, Franklin Lakes, NJ, USA). Single cell suspensions (1 × 10⁵ cells/flask) were seeded in α-minimum essential medium (α-MEM, GIBCO BRL Life Technologies, Gaithersburg, MD, USA) supplemented with 10% FBS, 2 mM L-glutamine, 100 µM L-ascorbic acid-2-phosphate, 100 U/mL penicillin-G, 100 µg/mL streptomycin, and 0.25 µg/mL fungizone (Gemini Bio-Products, Woodland, CA, USA). Cells were maintained at 37℃ in a 5% CO2 atmosphere.
For the Combined method (HDPCs-Combined), the pulp tissues were digested with ED method, and these digested tissues and cells were grown in the same medium as the OG method.
Flow cytometry
A Human MSC Analysis Kit (Cat. No. 562245, BD Biosciences, San Jose, CA, USA) was used. Flow cytometric analysis was conducted using FACSverse (BD Biosciences), and the data was analyzed by FlowJo (ver. 10). In brief, HDPCs-OG, HDPCs-ED, and HDPCs-Combined (3 × 10⁶ cells) were harvested using 0.05% trypsin/ethylenediaminetetraacetic acid (EDTA) and washed twice in ice-cold PBS, followed by resuspension in fluorescence-activated cell sorting (FACS) buffer solution (PBS supplemented with 0.1% BSA, 0.02% Azide, 1 mM EDTA, Sigma). The MSC positive cocktail (FITC mouse Anti-Human CD90, APC Mouse Anti-Human CD73, PerCP-Cy5.5 Mouse Anti-Human CD105) and negative MSC cocktail (PE CD45, PE CD34, PE CD11b, PE CD19, and PE HLA-DR) were used in accordance with the manufacturer's protocol.
Identification of MSCs by in vitro functional differentiation
HDPCs were induced to undergo adipogenic, osteogenic, or chondrogenic differentiation using an MSC functional identification kit (R&D Systems Inc., Minneapolis, MN, USA) according to the manufacturer's instructions. Control cultures were maintained in medium without inducers. Culture medium was changed every 3 - 4 days.
1. Osteogenic differentiation
To induce osteogenic differentiation, cells were plated in basal medium (α-MEM with 10% FBS, 100 U/mL penicillin, 100 mg/mL streptomycin, and 2 mM L-glutamine) at 4.0 × 10⁴ cells/cm2. Cells were incubated for 48 hours, after which the medium was changed to osteogenic supplementation medium containing dexamethasone, ascorbate-phosphate, and β-glycerophosphate. Cells were then incubated up to 28 days. The medium was replaced by differentiation medium every 2 - 3 days. To assess the extent of mineralization, cells subjected to osteogenic induction were stained with Alizarin Red S. Briefly, cells were washed with PBS, fixed in ice-cold 70% ethanol for 5 minutes, rinsed with distilled water, and stained for 10 minutes with 0.4 mL of Alizarin Red S (40 mM, pH 4.2, Sigma) with rotation. The cultures were rinsed three times with distilled water to reduce nonspecific staining.
2. Adipogenic differentiation
To evaluate the extent of adipogenic differentiation, HDPCs were plated as above and grown in basal medium to 100% confluence. The medium was then replaced with adipogenic medium containing hydrocortisone, isobutylmethylxanthine, and indomethacin in 95% ethanol, and cells were grown for 28 days. The extent of adipogenic differentiation was assessed by staining cells with Oil Red O. Briefly, cells were washed with PBS, fixed with 4% paraformaldehyde (Sigma) for 10 minutes, stained with 0.5% Oil Red O in isopropanol (Sigma) to detect lipid droplets in the differentiated cells, and washed with tap water.
3. Chondrogenic differentiation
To evaluate the extent of chondrogenic differentiation, aliquots of 106 cells were suspended in 0.5 mL of chondrogenic differentiation medium (DMEM and F12 medium [GIBCO, Karlsruhe, Germany] with 100 U/mL penicillin, 100 mg/mL streptomycin, 2 mM L-glutamine, 1% ITS Premix supplement medium (BD Biosciences), and chondrogenic supplement). The ITS + Premix is a commercially available medium supplement which contained insulin, transferrin, selenious acid, bovine serum albumin, and linoleic acid, whereas the chondrogenic supplement contained dexamethasone, ascorbate-phosphate, proline, pyruvate, and TGF-β3. After centrifugation at 500 × g for 5 minutes, the pelleted cells were incubated at 37℃. The caps of the tubes were loosened to allow gas exchange within the 5% CO2 atmosphere. HDPCs were cultured in chondrogenic medium for 28 days. All samples were fixed with 4% paraformaldehyde (Sigma), embedded in optimal cutting temperature (OCT) compound, and frozen at -80℃. Frozen samples were then cryosectioned at a thickness of 5 µm. For Alcian blue staining, cryosections of satellite cell micromass cultures were prewashed with 3% acetic acid for 15 minutes, incubated with 1% (w/v) Alcian blue solution in 3% acetic acid (pH 2.5, Sigma) for 30 minutes, and washed repeatedly with 3% acetic acid and distilled water.
Gene expression analysis by real-time quantitative reverse-transcription polymerase chain reaction
Total RNA was extracted from cells with TRIzol Reagent (Invitrogen). RNA concentrations were measured with a NanoDrop 2000 spectrophotometer (Thermo Scientific NanoDrop Products, Wilmington, DE, USA). One microgram of RNA was reverse transcribed with an iScript cDNA synthesis kit (Bio-Rad Laboratories, Hercules, CA, USA) according to the manufacturer's instructions. The following target gene primers and probes were used (Applied Biosystems, Foster City, CA, USA): glyceraldehyde-3-phosphate dehydrogenase (GAPDH), aggrecan (ACAN), alkaline phosphatase (ALP), bone sialoprotein 2 (BSP2), collagen type-I alpha-1 (COL1A1), collagen type-II alpha-1 (COL2A1), collagen type-X (COL10A1), lipoprotein lipase (LPL), osteocalcin (OCN), osteonectin (ON), osterix (OSX), osteopontin (OPN), peroxisome proliferator-activated receptor-gamma (PPARγ), runt-related transcription factor 2 (RUNX2), and sex-determining region Y-box 9 (SOX9) (Table 1). PCR cycling conditions included a 10 minutes polymerase activation step at 95℃, followed by 40 cycles at 95℃ for 15 seconds and 60℃ for 60 seconds. All real-time quantitative reverse-transcription polymerase chain reaction (RT-PCR) data were analyzed with Step One Software 2.1 (Applied Biosystems); transcript levels were normalized to those of the housekeeping gene GAPDH. Fold changes were calculated by the ΔCt method and used to compare mRNA expression levels. All experiments were performed in triplicate.
Western blot analysis
Total protein was harvested by lysing the cells in a cold cell lysis buffer (Cell Signaling Technology, Danvers, MA, USA) containing 20 mM Tris-HCl (pH 7.5), 150 mM NaCl, 1 mM Na2EDTA, 1 mM EGTA, 1% Triton, 2.5 mM sodium pyrophosphate, 1 mM β-glycerophosphate, 1 mM Na3VO4, 1 µg/mL leupeptin, 1 mM phenylmethylsulfonylfluoride (PMSF) for 1 hour on ice. Protein concentrations were determined with the Quick Start Bradford protein assay (Bio-Rad Laboratories) using bovine serum albumin as a standard. Proteins (10 g per sample) were separated by 10% SDS-polyacrylamide gel electrophoresis and transferred onto a nitrocellulose membrane (Millipore, Billerica, MA, USA) by electroblotting. Nonspecific binding sites on membranes were blocked with Tris-buffered saline Tween-20 buffer containing 5% nonfat dry milk powder at room temperature on a shaker for 1 hour. The blots were then incubated overnight at 4℃ with the following antibodies: mouse anti-ACAN (R&D Systems Inc.), mouse anti-ALP, mouse anti-BSPII, goat anti-COL1A1, rabbit anti-COL2A1, goat anti-COL10A1, mouse anti-LPL, rabbit anti-OCN, mouse anti-ON, mouse anti-OPN, goat anti-OSX, mouse anti-PPAR-γ, rabbit anti-RUNX2, rabbit anti-SOX9, and mouse anti-β-actin. All antibodies were used at a 1:1,000 dilution and all primary antibodies except ACAN were obtained from Santa Cruz Biotechnology Inc. (Santa Cruz, CA, USA). After washing, immunoreactive bands were visualized using ECL Plus Western Blotting Detection Reagents (Amersham, GE Healthcare, Buckinghamshire, UK).
Statistical analysis
All assays were performed in triplicate. Paired t-tests were performed to compare gene expression levels and the amounts of extracellular matrix produced by HDPCs-ED, HDPCs-OG, and HDPCs-Combined at various time points after the induction of odontogenic, adipogenic, or chondrogenic differentiation. Differences were considered statistically significant at p < 0.05. All data are expressed as means ± standard deviations.
Results
Morphological characteristics of HDPC cultures
We observed significant morphological differences between the pulp cells cultured by different methods. HDPCs-OG were morphologically homogeneous and exhibited a typical fibroblastic shape (Figure 1a). In contrast, HDPCs-ED were more heterogeneous in shape. They were predominantly fibroblast-like, although some appeared cuboidal or polygonal with multiple processes (Figure 1b). In addition, HDPCs-Combined were mixed phenotype with HDPCs-OG and HDPCs-ED (Figure 1c).
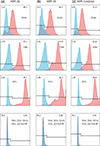
Characterization of MSC-associated antigens in HDPCs
To examine MSC phenotype of HDPCs isolated by different methods, we analyzed surface expression of CD105, CD90, CD73, CD45, CD19, CD11b, CD34, and HLA-DR in three types of cells. HDPCs derived from the three different culture methods shared similar surface expression profiles. More than 90% of the population in every group expressed CD105, CD90, and CD73. HDPCs cultured in these groups showed negative expression of CD45, CD19, CD11b, CD34, and HLA-DR (Figure 2).
In vitro functional differentiation
1. Osteogenic induction
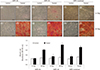
Alizarin Red S staining and quantification of mineralized cells in HDPCs on day 28 showed that osteogenic differentiation was significantly increased in calcium deposition in all the experimental groups, HDPCs-OG, HDPCs-ED, and HDPCs-Combined (Figure 3). Alizarin Red S staining showed that the osteogenic differention was higher in HDPCs-ED (Figure 3h) than HDPCs-OG (Figure 3d) or HDPCs-Combined (Figure 3l) on day 28.
2. Adipogenic induction
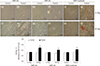
The positive Oil Red O staining of lipid droplets confirmed that the HDPCs had differentiated into adipocytes (Figure 4). Whole experimental groups showed induced adipogenic differentiation at day 28. At day 28, the induction of adipogenic differentiation was significantly higher in HDPCs-OG (Figure 4d) than in HDPCs-ED (Figure 4h) or HDPCs-Combined (Figure 4l).
3. Chondrogenic induction
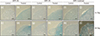
Alcian blue staining assay showed that HDPCs-OG, HDPCs-ED and HDPCs-Combined differentiated into chondrocytes (Figure 5). However, spectrophotometric quantification was not possible because of fragmentation process for dyeing.
Expression of differentiation markers in induced HDPCs
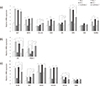
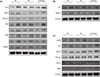
The expression levels of representative marker genes were analyzed by real-time RT-PCR (Figure 6) and western blotting (Figure 7). Most differentiation marker genes were upregulated at day 28 in the treated groups compared with the control groups.
1. Osteogenic differentiation
In osteogenic differentiation, COL1A1 and ON mRNA were expressed at a significantly higher level in HDPCs-Combined than in HDPCs-OG or HDPCs-ED at day 28. In contrast, OPN mRNA was expressed at a significantly lower level in HDPCs-Combined than in HDPCs-OG or HDPCs-ED. RUNX2 mRNA was significantly upregulated in HDPCs-ED compared with HDPCs-OG (Figure 6a). Western blotting analysis revealed that ALP, BSP2, and OCN proteins were more expressed in HDPCs-OG or HDPCs-Combined than in HDPCs-ED (Figure 7a).
2. Adipogenic differentiation
In adipogenic differentiation, the mRNA expression of adipogenic marker genes (LPL and PPAR-γ) in HDPCs-OG was significantly higher than HDPCs-ED at day 28. LPL mRNA level in HDPCs-Combined was significantly lower than in HDPCs-OG or HDPCs-ED whereas its PPAR-γ mRNA level was significantly higher (Figure 6b). The protein levels in the induced HDPCs-OG or HDPCs-Combined were higher than in HDPCs-ED (Figure 7b).
3. Chondrogenic differentiation
In chondrogenic differentiation, ACAN and COL10A1 mRNA were less expressed in HDPCs-Combined than in the HDPCs-OG or HDPCs-ED at day 28, while the level of ALP was significantly higher in HDPCs-Combined (Figure 6c). All HDPCs-OG, -ED, and Combined did not show any significant differences in expression of protein levels for all tested chondrogenic differentiation markers (Figure 7c).
Discussion
This study aimed to compare DPSCs derived from the pulp of human permanent teeth and to analyze the patterns of their multilineage differentiation under the different culture methods. Many previous studies of dental pulp have used the OG method.202124 These studies consistently found that HDPCs cultured by the OG method exhibit osteogenic differentiation ability in vitro, along with odontoblast-like morphology.2021 Alternatively, the ED method has typically been selected for the isolation of stem cells from various dental tissues.6252627 HDPCs cultured by the ED method can form dentin-pulp complexes in vivo.5 In a previous study, Huang et al.16 compared the characterization of stem cells derived from two different culture methods (HDPCs-ED vs. HDPCs-OG) via examination of the proliferation rate and gene expression pattern of human dentin sialophosphoprotein (DSPP), Cbfa1, and collagen type I and III. The study demonstrated that the proliferation rate was significantly higher in HDPCs-ED than HDPCs-OG, and that the two culture method yield different populations of HDPCs through the gene expression analysis. To analyze in detail the differences according to the culture method, we examined the morphologic, immunophenotypic, and multidifferential potential (osteogenic/adipogenic/chondrogenic) of HDPCs obtained by two different culture methods, both individually and in combination.
In terms of cellular morphology, HDPCs-OG exhibited a homogenous morphology and a typical fibroblastic shape. HDPCs-OG mainly consisted of fibroblast-like cells that had presumably migrated out of tissue fragments. HDPCs-ED were more heterogeneous in shape. Although most exhibited a fibroblast-like shape, others appeared cuboidal or polygonal. In contrast, HDPCs-Combined showed a phenotype of mixed cell with HDPCs-OG and HDPCs-ED (Figure 1). Thus, the first null hypothesis was rejected. Our result was expected because many different types of cells (fibroblast-like cells, endothelial cells, and pericytes) were presumably separated from the perivascular niche during the enzymatic tissue dissolution.28 Our result is in accordance with previous studies reporting that HDPCs-OG are more homogeneous in shape than HDPCs-ED.141628
Recently, the cell surface markers STRO-1, CD73, CD90, CD105, CD146, and Oct4 were reported to be suitable for identifying putative MSCs.4 Of these markers, we examined CD105, CD90, and CD73 expression in this study. These MSC surface markers were highly expressed on HDPCs obtained by all culture methods (HDPCs-OG, -ED, or –Combined) (Figure 2). These results coincide with a study in which the outgrowth and enzymatic digestion methods were used to characterize the stemness of HDPCs.29 This study demonstrated that HDPCs positively expressed the MSC markers CD73, CD90, CD105, and CD44, and negatively expressed the hematopoietic and endothelial markers CD34, CD45, and CD11b.
In our study, we examined the osteogenic, adipogenic, and chondrogenic immunohistochemical characteristics of HDPCs cultured by three different methods, and the result of study proved that those three groups presented different stem cell characterization except the HDPCs induced by chondrogenic differentiation; thus the second null hypothesis was partially rejected.
After the induction of osteogenic differentiation, Alizarin Red S staining showed that the osteogenic differention was higher in HDPCs-ED than HDPCs-OG or HDPCs-Combined (Figure 3). The mineralization of induced HDPCs-ED was accompanied by increased expression of osteogenic differentiation markers, including BSP, COL1A1, OCN, ON, OSX, and RUNX2, whereas HDPCs-OG showed higher level of ALP and OPN than HDPCs-ED or HDPCs-Combined (Figure 6a). ALP acts as an early indicator of cellular activity and differentiation, although it is a ubiquitous cellular protein and consequently cannot be considered bone-specific. BSP is mitogenic for preosteoblast cells and can promote their differentiation into mature osteoblasts, ultimately stimulating bone mineralization. OCN expression is restricted to cells of the osteoblast lineage. OPN is a secreted, highly acidic, calcium-binding, RGD-containing, phosphorylated glycoprotein originally isolated from bone matrix. RUNX2 is a DNA-binding subunit that heterodimerizes with core-binding factor (CBF)-β to form a transcription factor that plays a pivotal role in osteoblast differentiation. HDPCs-OG expressed these markers relatively earlier than HDPCsED, a finding that is consistent with the earlier and more extensive mineralized tissue formation in HDPCs-OG. BSP and OCN are commonly expressed in bones and teeth.303132 Though there are no specific odontoblastic differentiation markers, BSP, ALP, OCN, and ON have been used as indicators for odontoblastic differentiation.333435 These results indicate that HDPCs-ED have strong potential for hard-tissue regeneration aimed at producing organic and inorganic bone matrix components. Previous comparisons of HDPCs derived from different culture methods generally yielded results consistent with those of the present study. For example, HDPCs-ED were found to have improved stemness and osteogenic differentiation ability compared with HDPCs-OG.29 We hypothesize that the cell microenvironment (i.e. niche) could be one reason for this difference. The properties of any given cell depend on the genes that it expresses, which are regulated by both intracellular and intercellular signals. When the niche of a cell changes, these signals also change.35 This change in cellular signals produces different patterns of gene expression that can change the character of the cell. Chung et al. found that the chondrogenesis of dental pulp stem cells was influenced by the stem cell microenvironment.36 At the cellular level, the two different culture methods provide dramatically different microenvironments. In particular, the ED method disrupts intercellular connections between HDPCs, whereas the OG method maintains cellular connections relatively well. This fundamental difference of the HDPC microenvironments during isolation might underlie the different characteristics of HDPCs-ED and HDPCs-OG.
After the induction of adipogenic differentiation, the outcomes of HDPCs-ED or HDPCs-OG were comparable. Both induced HDPCs exhibited intracellular accumulation of lipid droplets and high expression of adipogenic marker genes. However, HDPCs-OG produced more lipid droplets and showed higher expression levels of the adipogenic marker genes LPL and PPAR-γ (Figures 4 and 6c). PPAR-γ is a lipid-activated nuclear hormone receptor with roles in adipocyte differentiation, whereas LPL is thought to be an early marker of adipogenesis and is highly expressed during adipogenic differentiation. These results indicate that HDPCs-OG have greater adipogenic and chondrogenic differentiation potential than HDPCs-ED. This result is in accordance with a study by Chung et al. that found that HDPCs-OG have chondrogenic and adipogenic differentiation capacity in vitro.36 HDPCs-OG are also capable of soft tissue regeneration for wound healing.37 This multifaceted differentiation ability of HDPCs-OG has great implications for future clinical soft tissue regeneration HDPC applications.
Regarding chondrogenesis, HDPCs-ED and HDPCs-OG both presented similar characteristics; no significant differences were observed between the two populations. Chondrogenesis marker genes, including ACAN, COL1A1, COL2A1, ALP, COL10A1, and SOX9 were highly expressed in both sets of HDPCs compared with control cells (Figures 6g - 6i). ACAN, COLA1, COL2A1, and ALP are essential factors during chondrogenesis. SOX9 (SRY [sex-determining region Y]-box 9) is expressed in mesenchymal progenitors that give rise to chondrocytes. The high expression level of this factor implies that HDPCs derived from both culture methods exhibit high chondrogenic differentiation potential.
This study confirmed that cell populations formed by two different culture methods and the combined culture method exhibit different properties. HDPCs-ED appeared to yield a higher number of DPSCs with strong osteogenic capacity. On the other hand, HDPCs-OG appeared to generate DPSCs suitable for adipogenesis. Developing culture methods for producing HDPCs with adequate differentiation potential is a critical step toward pulp tissue regeneration and dental tissue engineering. Moreover, understanding the distinct characteristics of HDPCs obtained by different culture methods promises to be useful for developing clinical HDPC uses in dental tissue engineering or regenerative endodontics.

 XML Download