Journal List > Restor Dent Endod > v.40(2) > 1090106

Kim, Kim, and Cho: Evaluation of electrical impedance ratio measurements in accuracy of electronic apex locators

Abstract

Objectives

The aim of this paper was evaluating the ratios of electrical impedance measurements reported in previous studies through a correlation analysis in order to explicit it as the contributing factor to the accuracy of electronic apex locator (EAL).

Materials and Methods

The literature regarding electrical property measurements of EALs was screened using Medline and Embase. All data acquired were plotted to identify correlations between impedance and log-scaled frequency. The accuracy of the impedance ratio method used to detect the apical constriction (APC) in most EALs was evaluated using linear ramp function fitting. Changes of impedance ratios for various frequencies were evaluated for a variety of file positions.

Results

Among the ten papers selected in the search process, the first-order equations between log-scaled frequency and impedance were in the negative direction. When the model for the ratios was assumed to be a linear ramp function, the ratio values decreased if the file went deeper and the average ratio values of the left and right horizontal zones were significantly different in 8 out of 9 studies. The APC was located within the interval of linear relation between the left and right horizontal zones of the linear ramp model.

Conclusions

Using the ratio method, the APC was located within a linear interval. Therefore, using the impedance ratio between electrical impedance measurements at different frequencies was a robust method for detection of the APC.

Introduction

Determination of working length (WL) is a critical step for the success of root canal treatments. Over-filling and under-filling due to failure to determine accurate WL jeopardize the success of treatment.1,2,3 The most common method to accurately determine WL involves the use of standardized radiographs. However, radiographic techniques have inherent drawbacks due to the projection of three-dimensional structures onto a two-dimensional plane. Three-dimensional structures of a tooth may overlap with important structures of the maxilla and mandible in the projection plane, and therefore make it difficult to detect the apical constriction (APC). Projection also distorts the visualization of the canal and affects estimation of the WL, especially for the molars and premolars.4 Even though X-ray emissions in dental radiography are very low, they should be minimized for the safety of patients and clinicians. Electronic apex locators (EALs) are some of the most innovative instruments available for determining WL. Practically, the development of EALs is a breakthrough that brings traditionally empirical endodontic practices into the electronic era.5
The EAL has a long history of development. Sunada first suggested using the resistance characteristics of root canals for WL determination.6 Ohmmeters were used to measure the resistance of direct current (DC). Inoue and Skinner introduced a new EAL using low-frequency oscillating current, represented by the Sono-Explorer, which overcame the low specificity and poor accuracy of the ohmmeter.7 Additional improvement came from the adoption of the ratio method by Kobayashi and Suda.8 The ratio method represented by the Root ZX (J. Morita Mfg Corp., Kyoto, Japan) is known to be one of the most reliable methods for determining WL.
The principles of EAL can be explained by Ohm's law.9 Ohm's law is expressed as voltage/current = resistance. Rather than DC, because alternating current (AC) is typically used in electrical measurements and expressed in sine wave form, Ohm's law is changed to voltage/current = impedance in AC. Impedance is expressed as the sum of resistance and reactance in a complex plane as Z(f) = R(f) + j * X(f) (Z, impedance; R, resistance; X, reactance; j, the symbol of an imaginary number). Impedance values depend on the frequencies of AC. The observation that the ratio between two electrical impedances decreases as the file tip approaches the apical foramen led to the development of the ratio method for WL determination.8
Most previous studies evaluated EAL in the context of clinical results rather than electrical principles.10,11,12,13 However, several studies analyzed frequency and impedance responses by applying AC on the basis of electrical principles.9,14,15 In other studies, electrical circuit modeling was performed on the basis of the frequency response.14,15,16,17,18 Among reports containing electrical property measurements, some provided these data in figures and tables. The data for most electrical models are highly reproducible and can be analyzed together, because similar measurements and easily convertible units were used. Therefore, to explicit the characteristics of the impedance ratio measurements for EALs, a correlation analysis was performed for electrically measured values reported in previous studies, a model was suggested for the plots between the ratios of electrical impedance measurements and the distance of the file tip from the APC, and the electrical impedance ratio was evaluated as the contributing factor to the accuracy of EAL.

Materials and Methods

PubMed and Embase were searched for relevant studies from inception to February 6, 2013. Search words were selected in two categories, one for words related to 'canal' or 'tooth' and the other for words related to 'impedance'. The search terms used are presented in Table 1. We did not apply language restrictions.
A priori, the following inclusion criteria were established for paper selection.
  1. The subject of the paper should include 'EAL' or 'electrical experiment'.

  2. Data should be grouped according to the variables of the experiments, such as teeth and experimental materials.

  3. Data should consist of output value, frequency, and distance.

  4. Output should be paired values of resistance and reactance, absolute impedance values (Zabs), or impedance ratios (Yratio) at different frequencies.

  5. In one set of data, there must be more than 2 different frequency points.

  6. In one set of data, there must be more than 2 different distance points.

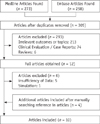
Papers not meeting any of these criteria were excluded from abstract reading. The remaining papers were assessed through full text reading by two reviewers (KPJ and CBH). We also evaluated the references of all papers. Selection process for the articles evaluated in this study was shown in Figure 1. Ten papers selected for analyses of electrical property measurements of EALs are summarized in Table 2.
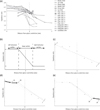
All possible data were extracted from the selected papers. If data were presented in tables, the exact values were extracted directly. If data were shown as figures and no exact values were provided, data were extracted by measuring pixel positions using Adobe Photoshop CS6 (Adobe Systems, San Jose, CA, USA). Pixel positions were converted to numeric values by axial units. The data obtained were the sums of resistance and reactance, the Zabs, or the Yratio. If data were the sums of resistance and reactance, the values were converted to the Zabs in Ohms (Ω). The data obtained from the literature were plotted between the input data of the distance from the APC and frequency and the output data of the impedance values. As an example, the data extracted from Pilot and Pitts' paper were plotted three-dimensionally in Figure 2a.19 We did not contact the authors of the studies to collect further information.
All data were organized in a table according to group number, output value, frequency, and distance from the APC. Based on the tables, the data sets and the grouped data sets were collected when the input data were the frequency or both frequency and distance from the APC (Table 2). All of the groups or papers were evaluated to determine whether they could be converted into a specific model. First and second order polynomials were estimated as candidates of the specific model using the least squares method. The least squares method was performed using a 'polyfit' function in Matlab R2012b (The MathWorks Inc., Natick, MA, USA). The independent and dependent variables of the model were frequency in a log scale and Zabs, respectively. An example of the plot for the first order model between the log-scaled frequency and the Zabs is presented in Figure 2b. Because a linear scale is impractical for expressing large frequency ranges, the log scale is commonly applied when employing the frequency responses of electronic circuits, as in Bode plots.20 In the first and second order polynomial models, the numbers of the positive and negative coefficients of the highest order were examined.
The regression model between the log-converted frequency and Zabs was determined as a first order polynomial (equation 1).
(Equation 1)
(Zabs) = α × log(f) + β
where α, β and f were the slope, intercept and frequency of the first order regression curve, respectively (Figure 2b).
The regression model between the Yratio and the distance from the APC was derived from the same grouped data set that was collected according to the experimental variables, such as teeth and experimental materials. The Yratio values were obtained at two selected frequencies and then plotted against the distance data for the same group (Equation 2).
(Equation 2)
ratio=logf1+(β)x=(α)x=logf2+(β)x=(α)x=rde-40-113-e001
where f1 and f2 were two different arbitrarily-selected frequencies, and x is the distance from the APC in millimeters. In each group, the Ŷratio was calculated and plotted in Figure 3a according to the inclusion criteria, when f1 and f2 were 8,000 Hz and 400 Hz, respectively.8 If the plots from Pilot and Pitts are excluded, the model using the Ŷratio at two different frequencies fits as a linear ramp function (Figure 3b).19 In the linear ramp function, the linear section and the two horizontal sections were discriminated using a searching algorithm as follows:
  1. The points discriminating the two horizontal sections and a linear section in between them were assumed to be the last and the first points of the assuming left and right horizontal sections, respectively, in the Ŷratio data of each group (Figure 3c).

  2. Move the discriminating points.

    1. a. In odd trials, the last point at the end of the left horizontal section was changed to the next right point (Figure 3d).

    2. b. In even trials, the first point at the start of the right horizontal section was changed to the next left point (Figure 3e).

  3. In the linear interval and outer parallel horizontal areas, the linear ramp function was estimated using the least squares method.

  4. When the next trial was executed, if the previous least squares error was smaller than the current error, the point was reverted and the procedure was stopped.

    1. a. If no movement occurred between trials in the right-end last and left-end first points, the calculation was stopped and the points were selected as the final (polygonal) discriminating points.

    2. b. If there was any movement in the discriminating points, the next point was selected and the least squares error function was carried out to dictate the next trial.

The average values of the left and right horizontal sections of each group, and the values where the distance was 0 were compared using one-way repeated measures analysis of variance (ANOVA). If the output of each group was not Yratio, a regression analysis was performed for each group between β and the distance from the APC (Equation 3).
(Equation 3)
β = γ × x + δ
where β, γ, x and δ were the intercept, slope, distance from the APC, and interference of the regression curve, respectively. Numerical analysis was performed using Matlab R2012b (MathWorks Inc.). Statistical analyses were carried out using IBM SPSS 20.0 (IBM, Chicago, IL, USA).

Results

The data for ten selected papers, including three in vivo and seven in vitro experiments, are shown in Table 2. The output data were in Yratio in four papers and in Zabs in three papers. The remaining three papers were in Zabs, which can be inferred from the resistance and reactance. The numbers of data sets and grouped data sets are also presented in Table 2 according to the input data, which were either the frequency or both frequency and distance from the APC. When the input and output data were frequency and Zabs, respectively, 158 data sets could be extracted. The number of grouped data sets was 66, when data were grouped according to experimental variables. Among the 66 grouped data sets, 17 data sets could also be estimated when the inputs were both frequency and distance from the APC. Grouped data sets, in which the input data were the frequency and distance from the APC, could be extracted from nine papers except for Oishi et al.21
When the first-order equation was assumed as a model, the slope of the equations in all the models were in the negative direction (Figure 2b). However, the directions were not consistent in the models of the second order equation, especially in the grouped data. When the distances from the APC were different, both directions were possible and the distribution of directions, meaning the numbers of coefficients with positive, negative, and both signs, did not have statistical differences in the grouped data sets or the data sets extracted from each paper. Therefore, the first order equation was selected.
After inspecting the first order plot, the model between the distance from the APC and Ŷratio in equation 2 was converted to a simple linear ramp function using the least squares method (Figure 3b). In eight cases, except for Pilot and Pitts, average Ŷratio values in the left horizontal zone were significantly higher than those in the right horizontal zone (Table 3).19 In all cases, the APC was located within the interval of the linear relation between the left and right horizontal zones of the simple linear ramp model. The left-most positions of the linear interval were between -1.5 and 0, except for Levinkind, in which it was -14. The right-most positions of the linear intervals were between 0 and 2.17
Regarding the relationship between β and the distance from the APC, data sets could be extracted from 5 papers including Huang et al., Krizaj et al., Lee et al., Pilot and Pitts, and Levinkind (Tables 2 and 4).15,17,19,22 All slopes were negative (Table 4 and Figure 4). Regression analyses were performed for the data sets from all of the papers, and the linear coefficients of the data sets for each paper were statistically significant, except for Huang et al.18

Discussion

Kobayashi and Suda first introduced Root ZX based on the ratio method for measuring the WL.8 The usefulness of this method was verified by many subsequent studies.23 In the present study, all papers except for Pilot and Pitts reported that the interval of the linear relation had significantly higher average values in the left horizontal zone than in the right one (p < 0.05).19 This indicates that the ratio method of determining impedance values can discriminate between the areas that are under-instrumented and those that are over-instrumented. The segregation we observed between the under-instrumented and over-instrumented areas provides the rationale for detecting apical constriction and avoiding failure in determination of WL. In all grouped data sets, the APC, designated as 'distance 0', was found within the linear interval, which indicates that the ratio method may be used for detecting the position of the APC. The Ŷratio values at the APCs showed no significant differences from those of the right horizontal zones (Table 3). This result supports the clinical protocol of Root ZX, which recommends a fitting procedure of initial passing and subsequent withdrawal of a file through the APC. The beep reading of Root ZX indicates the ratio value at the discriminating point between the right horizontal zone and the APC within the linear interval. Oishi et al. also noted a correlation between the distance from the APC and the Root ZX reading.21 When data from Levinkind were excluded from Table 3, the linear interval was so narrow that it could be used to verify the relation between the Ŷratio value and the distance from the APC.17 This finding supports the utility of the ratio method and the theoretical background underlying Root ZX.
There were negative correlations between frequency and impedance in the first order plot. If the equivalent circuit of root canal is resistance, impedance has a constant value. Negative slopes of impedance values in this study suggest that the equivalent circuit includes a capacitor element within the circuit (Figure 2b), that is, a pure capacitor or a constant phase element in the circuit of the root canal model.15,24 The features of the second order models suggest the concavity or convexity of the model, but no directional tendencies were noted in this study. No tendencies of concavity or convexity were observed when the noise was higher than the original signal, when the model changed depending on distance, or when other electrical factors such as capacitance were induced by a long wire. Experiments for equivalent circuit modeling were performed in many previous studies.14,15,16,17,18 However, no common or interconvertible models exist. Studies discriminating the directional features of the second order model for root canals are needed.
In this analysis, we arbitrarily selected frequencies of 400 Hz and 8,000 Hz, as in Oishi et al.21 When frequency changed, the ratio of impedance values also changed, but did not influence the final detection of WL, as shown in equation 2. This occurred because the slope (α) and interference (β) of the equations 1 and 2 were not changed by changes in frequency, and the log-scaled frequencies in equation 2 were determined by the selected experimental conditions. The selection of specific frequencies is very important to avoid the influence of frequencies caused by noise. In the human body, there are various low frequency electrical sources including the heart, muscle, and brainwaves. Separation of frequencies is critically important to avoid mutual interference. Because detecting very high frequencies in a small, portable electrical detector is challenging, it is very difficult to overcome internal noise and errors generated by the electrical detector itself at very high frequencies. The frequencies found in cases of high signal-to-noise (SN) ratios are suitable for the detection and measurement of electrical properties. Therefore, it is practical to select suitable frequencies for the performance of electrical property measurements. The discovery that several pairs of frequencies can be used to obtain high SN ratios made the use of multi-frequency EAL possible.25 Zabs was chosen for the integration of the output values. If resistance and reactance are used as output data to achieve sufficiently high SN ratios, phase analysis may be used for locating the APC.26
Values of β were obtained from Equation 1 to substitute approximate resistance values at 1 Hz for resistance at a frequency f = 0, because the real resistance value (f = 0) cannot be obtained using this equation. The correlation between the approximate resistance and the distance from the APC was negative in the slopes (γ) of all papers, and the γ values were statistically significant in four papers not including Huang et al. (Table 4).18 This suggests that the approximate resistance may also be used as a secondary source for detection of the APC. However, the values of γ and δ varied greatly between studies. In addition to various kinds of irrigants found in the canal, the complexity of dentin substrate composition, underlying tissues, or root canal shape may result in variation.19 The variation may also be attributed to differences in experimental environments, such as sensitivity of sensors, calibration errors of devices, electrical noise, and the signal processing method used by the measuring instrument. While the major weakness of the ratio method is the narrow range of the detection distance beyond the linear interval, use of the approximate resistance alone is also inappropriate for detecting the WL and the APC. The accuracy of the ratio method, which is superior to the previous resistance and frequency methods for detecting the position of the APC, may also be supplemented by considering the approximate resistance, which offers the advantage of a wide range of detection sizes.

Conclusions

Through a correlation analysis of the data in previous studies, we found that the Ŷratio decreased when a file went deeper and deeper into the canal and the APC could be located within a narrow range of the linear interval of a simple linear ramp function model when an EAL was used to determine the WL by the ratio method. The average Ŷratio values of the left and right horizontal zones, which correspond to the under-instrumented and over-instrumented areas, respectively, were significantly different. Despite the limitations of this study, the impedance ratio method was found to be a robust method for detecting the APC from the perspective of electrical principles.

Figures and Tables

Figure 1

Selection process for the articles evaluated in this study.

rde-40-113-g001
Figure 2

Sample plots for data obtained from the studies included in the correlation analysis. (a) Three-dimensional plot of a grouped data set from Pilot and Pitts, in which the inputs were the distance from the apical constriction and the frequency, and the outputs were the absolute impedance values (Zabs);19 (b) Plot of the log-scaled frequency and the Zabs from a sample data set from Krizaj et al.15

rde-40-113-g002
Figure 3

Plots of the distance from the apical constriction (APC) and the impedance ratio (Yratio), and the method used to find a simple linear ramp function model. (a) Plots of the distance from the APC and the Yratio between 400 and 8,000 Hz for all groups; (b) Model between the distance from the APC and the Yratio between 400 and 8,000 Hz; (c) - (e) Point selection algorithm for the simple linear ramp function model between the distance from the APC and the Yratio values. Move the discriminating points (1). (d) In odd trials, the last point at the end of the left horizontal section (2A) was changed to the next right point (2B); (e) In even trials, the first point at the start of the right horizontal section (3A) was changed to the next left point (3B).

rde-40-113-g003
Figure 4

Plots of the distance from the apical constriction and the relative value from Distance 0. Approximate resistance values (β) obtained at 1 Hz from Equation 1 were substituted for the resistance at frequency f = 0 and calibrated using the approximate resistance value at point 0.

rde-40-113-g004
Table 1

Search terms for electrical apex locator with electrical data used

rde-40-113-i001
Search engine Search term
Pubmed ((impedance[TIAB] or impedances[TIAB] or voltage[TIAB] or measure[TIAB] or measurement[TIAB] or 'electronic device'[TIAB]) and ((tooth[TIAB] or teeth[TIAB]) and 'root canal'[TIAB] or 'foramen locator'[TIAB] or 'root canal treatment'[TIAB] or 'apex locator'[TIAB]))
Embase ((impedance:ab,ti or impedances:ab,ti or voltage:ab,ti or measure:ab,ti or measurement:ab,ti or 'electronic device':ab,ti) and ((tooth:ab,ti or teeth:ab,ti) and 'root canal':ab,ti or 'foramen locator':ab,ti or 'root canal treatment':ab,ti or 'apex locator':ab,ti))
Table 2

Summary of selected papers containing the electrical property measurements of electrical apex locator, and the number of data sets and grouped data sets when the input data were the frequency or both the frequency and the distance from the apical constriction

rde-40-113-i002
In vivo Output Format* Data Set 1 Data Set 2 Data Set 3§
Rambo et al. 201027 Yes Ratio 13 1 1
Jan and Krizaj 200928 No Value (50,000 Hz) 12 1 1
No Ratio
Huang et al. 200818 No X + Yj 5 1 1
Rambo et al. 200726 Yes Ratio 4 1 1
Krizaj et al. 200415 No X + Yj 8 1 1
Oishi et al. 200221 No Ratio 47 47 0
Lee et al. 199722 No Value (no unit) 7 1 1
Pilot and Pitts 199719 Yes Value 36 7 7
Kobayashi and Suda 19948 No Ratio 23 5 3
Levinkind 199417 No X + Yj 3 1 1
Sum 158 66 17

*Ratio, the ratio between two electrical impedance values at two selected frequencies; Value, absolute impedance value; X + Yj, (Resistance) + j (Reactance).

The number of data sets were counted when the frequency conditions of the input data were two or more.

The number of grouped data sets were counted when the frequency conditions were the input data. In each study, data were grouped according to experimental variables such as teeth and materials.

§The number of grouped data sets were counted when both the frequency conditions and the distance from the apical constriction were the input data. In each study, data were grouped according to experimental variables such as teeth and materials.

Table 3

Impedance ratios (Ŷratio) in the left and right horizontal zones and at the apical constriction within the linear interval and the positions of the left- and right-end points of the linear interval discriminating the horizontal sections, when a simple linear ramp model was estimated in each study

rde-40-113-i003
Studies Average ratio values in horizontal zones ratio Values at APC*†§∥ Position of linear relation
Left†‡§ Right†‡∥ Left Right
Rambo et al. 201027 2.60 2.20 2.24 -1 0
Jan and Krizaj 200928 2.66 2.36 2.52 -0.5 0.5
Huang et al. 200818 2.35 1.93 2.22 -0.5 1
Rambo et al. 200726 2.58 2.23 2.27 -1 0
Krizaj et al. 200415 2.62 2.24 2.46 -0.5 0.5
Lee et al. 199722 2.75 2.01 2.49 -1 2
Pilot and Pitts 199719 2.50 2.44 2.46 -0.25 0.25
2.31 2.52 2.46 -1.5 0.5
2.51 2.55 2.44 0 0.5
2.56 2.50 2.46 -1.5 0.25
2.59 2.45 2.51 -0.25 0.25
2.50 2.41 2.45 -0.5 0.25
2.64 2.54 2.52 -1.5 0.25
(Average of Pilot and Piits 1997) 2.52 2.49 2.47 -0.79 0.32
Kobayashi and Suda 19948 2.70 1.87 1.92 -1 0
2.71 1.94 1.90 -1 0
2.73 1.87 1.95 -1 0
(Average of Kobayashi and Suda 1994) 2.71 1.89 1.92 -1 0
Levinkind 199417 2.61 2.51 2.51 -14 0
Average by group 2.58 (0.12) 2.27 (0.25) 2.34 (0.22) -1.59 (3.23) 0.37 (0.50)
Average by paper 2.58 (0.11) 2.23 (0.23) 2.33 (0.21) -2.25 (4.69) 0.48 (0.36)

The numbers in parentheses are standard deviations.

*Values at APC meant the Ŷratio values when the distance from the apical contriction (APC) is 0 (zero).

p-values of one-way repeated measures ANOVA were 0.005 and 0.011 when clustered by groups and papers, respectively.

p-values of Bonferroni corrected paired t-tests were 0.003 and 0.005 when clustered by groups and papers, respectively.

§p-values of Bonferroni corrected paired t-tests were 0.008 and 0.028 when clustered by groups and papers, respectively.

p-values of Bonferroni corrected paired t-tests were 0.183 and 0.114 when clustered by groups and papers, respectively.

Table 4

Slope (γ) and interference (δ) values in the model, where the approximate resistances (β) in each group were plotted against the distance from the apical constriction

rde-40-113-i004
Model (×103 Ω/mm) p value of slope In vivo
Slope (γ) Interference (δ)
Rambo et al. 201027 -* - - Yes
Jan and Krizaj 200928 - - - No
Huang et al. 200818 -1.2 11.7 .322 No
Rambo et al. 200726 - - - Yes
Krizaj et al. 200415 -1.7 6.8 .000 No
Oishi et al. 200221 - - - No
Lee et al. 199722 -1.1 7.7 .005 No
Pilot and Pitts 199719 -21.2 20.0 .000 Yes
-97.7 38.0 .001
-7.7 12.8 .000
-5.5 13.0 .014
-17.3 19.4 .003
-33.9 22.4 .001
-3.3 8.9 .004
(Average of Pilot and Pitts 1997) -26.7 19.2
Kobayashi and Suda 19948 - - - No
Levinkind 199417 -9.4 265.3 .007 No
Average (SD) by group -18.2 (28.3) 38.7 (75.7)
Average (SD) by paper -8.0 (11.0) 62.2 (10.7)

*'-' means 'value not available'.

The numbers in the parentheses are standard deviations.

Acknowledgement

This research was partly supported by the Basic Science Research Program through the National Research Foundation of Korea (NRF) funded by the Ministry of Education, Science and Technology (No. 2011-0006574) and partly supported by MSIP (the Ministry of Science, ICT and Future Planning), Korea, under the IT-CRSP (IT Convergence Research Support Program) (NIPA-2013-H0401-13-1001) supervised by the NIPA(National IT Industry Promotion Agency).

Notes

Conflict of Interest: No potential conflict of interest relevant to this article was reported.

References

1. Ng YL, Mann V, Rahbaran S, Lewsey J, Gulabivala K. Outcome of primary root canal treatment: systematic review of the literature - Part 2. Influence of clinical factors. Int Endod J. 2008; 41:6–31.
crossref
2. Ng YL, Mann V, Rahbaran S, Lewsey J, Gulabivala K. Outcome of primary root canal treatment: systematic review of the literature - part 1. Effects of study characteristics on probability of success. Int Endod J. 2007; 40:921–939.
crossref
3. Smith CS, Setchell DJ, Harty FJ. Factors influencing the success of conventional root canal therapy-a five-year retrospective study. Int Endod J. 1993; 26:321–333.
crossref
4. ElAyouti A, Weiger R, Löst C. Frequency of overinstrumentation with an acceptable radiographic working length. J Endod. 2001; 27:49–52.
crossref
5. Kim E, Lee SJ. Electronic apex locator. Dent Clin North Am. 2004; 48:35–54.
crossref
6. Sunada I. New method for measuring the length of the root canal. J Dent Res. 1962; 41:375–387.
crossref
7. Inoue N, Skinner DH. A simple and accurate way to measuring root canal length. J Endod. 1985; 11:421–427.
8. Kobayashi C, Suda H. New electronic canal measuring device based on the ratio method. J Endod. 1994; 20:111–114.
crossref
9. Nekoofar MH, Ghandi MM, Hayes SJ, Dummer PM. The fundamental operating principles of electronic root canal length measurement devices. Int Endod J. 2006; 39:595–609.
crossref
10. Gomes S, Oliver R, Macouzet C, Mercadé M, Roig M, Duran-Sindreu F. In vivo evaluation of the Raypex 5 by using different irrigants. J Endod. 2012; 38:1075–1077.
11. Stöber EK, Duran-Sindreu F, Mercadé M, Vera J, Bueno R, Roig M. An evaluation of root ZX and iPex apex locators: an in vivo study. J Endod. 2011; 37:608–610.
12. Stöber EK, de Ribot J, Mercadé M, Vera J, Bueno R, Roig M, Duran-Sindreu F. Evaluation of the Raypex 5 and the Mini Apex Locator: an in vivo study. J Endod. 2011; 37:1349–1352.
13. Duran-Sindreu F, Stöber E, Mercadé M, Vera J, Garcia M, Bueno R, Roig M. Comparison of in vivo and in vitro readings when testing the accuracy of the Root ZX apex locator. J Endod. 2012; 38:236–239.
crossref
14. Meredith N, Gulabivala K. Electrical impedance measurements of root canal length. Endod Dent Traumatol. 1997; 13:126–131.
crossref
15. Krizaj D, Jan J, Valencic V. Modeling AC current conduction through a human tooth. Bioelectromagnetics. 2004; 25:185–195.
crossref
16. Al-bulushi A, Levinkind M, Flanagan M, Ng YL, Gulabivala K. Effect of canal preparation and residual root filling material on root impedance. Int Endod J. 2008; 41:892–904.
crossref
17. Levinkind M. A dental application of neural network computing: classification of complex electrical impedance measurements to aid root canal treatment. Neural Comput Applic. 1994; 2:209–215.
crossref
18. Huang JH, Yen SC, Lin CP. Impedance characteristics of mimic human tooth root canal and its equivalent circuit model. J Electrochem Soc. 2008; 155:51–56.
crossref
19. Pilot TF, Pitts DL. Determination of impedance changes at varying frequencies in relation to root canal file position and irrigant. J Endod. 1997; 23:719–724.
crossref
20. Perdikaris GA. Computer controlled systems: theory and applications. Netherlands: Kluwer Academic Publisher;1991. p. 116–118.
21. Oishi A, Yoshioka T, Kobayashi C, Suda H. Electronic detection of root canal constrictions. J Endod. 2002; 28:361–364.
crossref
22. Lee SJ, Kim DW, Nam KC. Development of new frequency-dependent type apex locator: voltage difference compensating type. J Korean Acad Conserv Dent. 1997; 22:809–819.
23. Gordon MP, Chandler NP. Electronic apex locators. Int Endod J. 2004; 37:425–437.
crossref
24. Nilsson JW, Riedel SA. Electric circuits. 5th ed. Reading, MA: Addison-Wesley;1996. p. 221–222.
25. Nelson-Filho P, Romualdo PC, Bonifácio KC, Leonardo MR, Silva RA, Silva LA. Accuracy of the iPex multifrequency electronic apex locator in primary molars: an ex vivo study. Int Endod J. 2011; 44:303–306.
crossref
26. Rambo MV, Gamba HR, Ratzke AS, Schneider FK, Maia JM, Ramos CA. In vivo determination of the frequency response of the tooth root canal impedance versus distance from the apical foramen. Conf Proc IEEE Eng Med Biol Soc. 2007; 2007:570–573.
27. Rambo MV, Gamba HR, Borba GB, Maia JM, Ramos CA. In vivo assessment of the impedance ratio method used in electronic foramen locators. Biomed Eng Online. 2010; 9:46.
crossref
28. Jan J, Krizaj D. Accuracy of root canal length determination with the impedance ratio method. Int Endod J. 2009; 42:819–826.
crossref
TOOLS
ORCID iDs

Byeong-Hoon Cho
https://orcid.org/http://orcid.org/0000-0001-9641-5507

Similar articles