

 PDF
PDF ePub
ePub Citation
 Print
Print


When we have a continuous outcome e.g., bonding strength and two categorical explanatory variables such as 4 different resin types and 2 different curing light sources, usually we consider applying the two-way ANOVA for analyzing the relationships. However because implementing the two-way ANOVA is relatively complicated, some clinical researchers prefer to apply the one-way ANOVA for one factor on each level of the other factor, repeatedly. They often insist that they are interested only in one factor (e.g., manipulation methods) and are not interested in the other factor (e.g., brands), claiming that the one-way ANOVA is the more appropriate strategy. Even though the trial with a variety of brands may be considered as a simple way of generalization among various brand types, possible different effects of materials of different brands can never be detected by the one-way ANOVA. Actually materials of different brands may have slightly different ingredient compositions which may elicit different effects on the other factor. Application of the one-way ANOVA cannot detect the possible interaction between two explanatory categories.
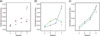
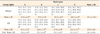
Table 1 shows a data of bonding strength of four types of resin (A, B, C and D) on the teeth surface with a simultaneous use of two different curing light sources (Halogen, LED). The highest overall bonding strength is found on resin D followed by resin C and resin B showing insignificant differences (see the superscript a, b, and c). Considering cases using the 'Halogen,' resin D is the strongest among four resin types, while resin C shows the highest value when the 'LED' was used. This explicitly shows that the effects of different resin types are not following a similar trend according to different levels of curing methods, 'Halogen' or 'LED'. Figure 1a shows that trend of (descriptive) mean bonding strengths for resin types are changing according to the levels of curing methods.
Interaction model or main effect (no-interaction) model?
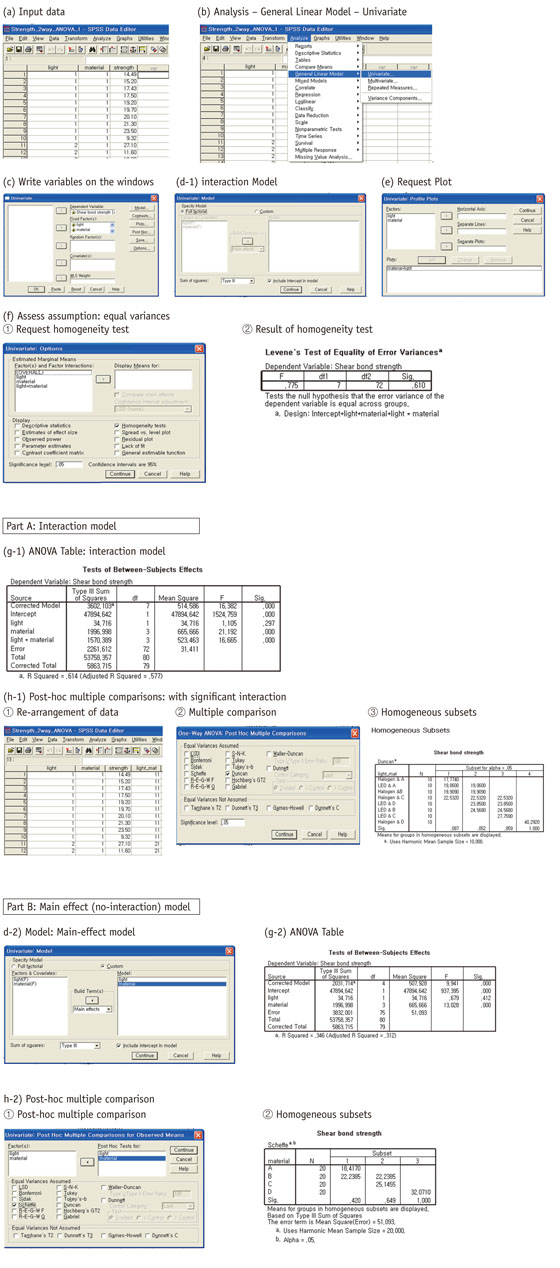
When we have a quantitative continuous outcome and two categorical explanatory variables, we may consider two kinds of relationship between two categorical variables, which could be typically seen in the Figures 1b and 1c. The Figure 1c shows that the relative effect of each level in the material category doesn't change with different levels of curing methods, which means an additive relationship between the two categorical variables, i.e. the second categorical variable takes a role of adding a uniform effect on the relationship between the outcome and the first categorical variable. In this relationship we can distinguish effect of one factor from that of the other factor. This type of model is called a main effect model or no-interaction model. However, Figure 1b shows that the effect of material depends on the levels of the curing methods and we cannot tell effect of one factor separately, i.e. which light source does produce stronger bonding? This is called an interaction model because an interaction relationship is included. We may see that the interaction model could easily reproduce the actual relationship among descriptive means, as seen in Figure 1a. Therefore generally the first step in application of the two-way ANOVA is fitting the interaction model, specified as the "Full factorial model" (Part A, d-1, below) and test the significance of the interaction term. The resulting ANOVA table of two-way ANOVA interaction model is shown in Table 2 and g-1 (below) and we could find the interaction term (Light*Resin) is statistically significant at an alpha level of 0.05 (p < 0.001). As an effect of a level of one variable depends on levels of the other variable, we cannot separate the effects of two variables, neither independent effect of resin types nor independent effect of curing light. The levels of two categorical variables should combined into a total of eight categories (2 levels of Light * 4 levels of Resin) and the post-hoc multiple comparisons may be implemented among the eight categories as if they consist of one (combined) factor (shown in h-1①; variable name = 'light_mat'). Table 3 provides the complete report of analyses results from the interaction model as well as post-hoc multiple comparisons. The plot in Figure 1 may be displayed by requesting plots (e, below). The underlying assumptions of the two-way ANOVA model are the same with those of the one-way ANOVA, normal distribution of outcomes and equal variances. The assumption of normality should be checked in an exploratory procedure and the assumption of equal variances may be tested as the homogeneity test for the null hypothesis of equal variances for all groups, as shown in the procedure f, below.
On the other hand, if we have an insignificant interaction term, different from the results above, we consider a main effect (no-interaction) model as shown in Part B below, which may be actually incorrect in modeling this data. Table 4 shows the comprehensive results of the analyses based on the main effect model, although the model is actually inadequate because it doesn't fit the data well. The superscripts represent statistical differences among levels of Resin types only because the effect of Light was insignificant (p = 0.412). You may add superscripts of upper cases to represent statistical differences in the levels of the Light variable if the Light is significant.
The two-way ANOVA with interaction term using the SPSS statistical package (SPSS Inc., Chicago, IL, USA) as following procedures:


 XML Download