This article has been
cited by other articles in ScienceCentral.
As discussed in the previous statistical notes, although many statistical methods have been proposed to test normality of data in various ways, there is no current gold standard method. The eyeball test may be useful for medium to large sized (e.g., n > 50) samples, however may not useful for small samples. The formal normality tests including Shapiro-Wilk test and Kolmogorov-Smirnov test may be used from small to medium sized samples (e.g., n < 300), but may be unreliable for large samples. Moreover we may be confused because 'eyeball test' and 'formal normality test' may show incompatible results for the same data. To resolve the problem, another method of assessing normality using skewness and kurtosis of the distribution may be used, which may be relatively correct in both small samples and large samples.
1) Skewness and kurtosis
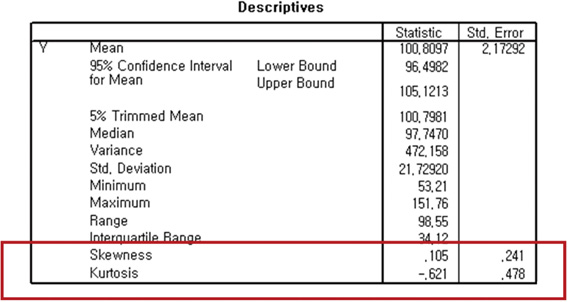
Skewness is a measure of the asymmetry and kurtosis is a measure of 'peakedness' of a distribution. Most statistical packages give you values of skewness and kurtosis as well as their standard errors.
In SPSS you can find information needed under the following menu: Analysis - Descriptive Statistics - Explore
Skewness is a measure of the asymmetry of the distribution of a variable. The skew value of a normal distribution is zero, usually implying symmetric distribution. A positive skew value indicates that the tail on the right side of the distribution is longer than the left side and the bulk of the values lie to the left of the mean. In contrast, a negative skew value indicates that the tail on the left side of the distribution is longer than the right side and the bulk of the values lie to the right of the mean. West et al. (1996) proposed a reference of substantial departure from normality as an absolute skew value > 2.
1
Kurtosis is a measure of the peakedness of a distribution. The original kurtosis value is sometimes called
kurtosis (proper) and West et al. (1996) proposed a reference of substantial departure from normality as an absolute kurtosis (proper) value > 7.
1 For some practical reasons, most statistical packages such as SPSS provide
'excess' kurtosis obtained by subtracting 3 from the kurtosis (proper). The excess kurtosis should be zero for a perfectly normal distribution. Distributions with positive excess kurtosis are called leptokurtic distribution meaning high peak, and distributions with negative excess kurtosis are called platykurtic distribution meaning flat-topped curve.
2) Normality test using skewness and kurtosis
A z-test is applied for normality test using skewness and kurtosis. A z-score could be obtained by dividing the skew values or excess kurtosis by their standard errors.
As the standard errors get smaller when the sample size increases, z-tests under null hypothesis of normal distribution tend to be easily rejected in large samples with distribution which may not substantially differ from normality, while in small samples null hypothesis of normality tends to be more easily accepted than necessary. Therefore, critical values for rejecting the null hypothesis need to be different according to the sample size as follows:
For small samples (n < 50), if absolute z-scores for either skewness or kurtosis are larger than 1.96, which corresponds with a alpha level 0.05, then reject the null hypothesis and conclude the distribution of the sample is non-normal.
For medium-sized samples (50 < n < 300), reject the null hypothesis at absolute z-value over 3.29, which corresponds with a alpha level 0.05, and conclude the distribution of the sample is non-normal.
For sample sizes greater than 300, depend on the histograms and the absolute values of skewness and kurtosis without considering z-values. Either an absolute skew value larger than 2 or an absolute kurtosis (proper) larger than 7 may be used as reference values for determining substantial non-normality.
Referring to
Table 1 and
Figure 1, we could conclude all the data seem to satisfy the assumption of normality despite that the histogram of the smallest-sized sample doesn't appear as a symmetrical bell shape and the formal normality tests for the largest-sized sample were rejected against the normality null hypothesis.
3) How strict is the assumption of normality?
Though the humble t test (assuming equal variances) and analysis of variance (ANOVA) with balanced sample sizes are said to be 'robust' to moderate departure from normality, generally it is not preferable to rely on the feature and to omit data evaluation procedure. A combination of visual inspection, assessment using skewness and kurtosis, and formal normality tests can be used to assess whether assumption of normality is acceptable or not. When we consider the data show substantial departure from normality, we may either transform the data, e.g., transformation by taking logarithms, or select a nonparametric method such that normality assumption is not required.


 PDF
PDF ePub
ePub Citation
 Print
Print


 XML Download