Abstract
Background:
Recently, the prevalence of obesity and socioeconomic costs stemming from obesity are increasing steeply. Obesity, in particular, has a highly polarization caused by income levels. Obesity in low-income patients is expected to become a serious social problem in the future. This study aims to observe the effects of consistent consultation and drug therapy during a six months period, and to develop the treatment process of obesity for low-income people.
Methods:
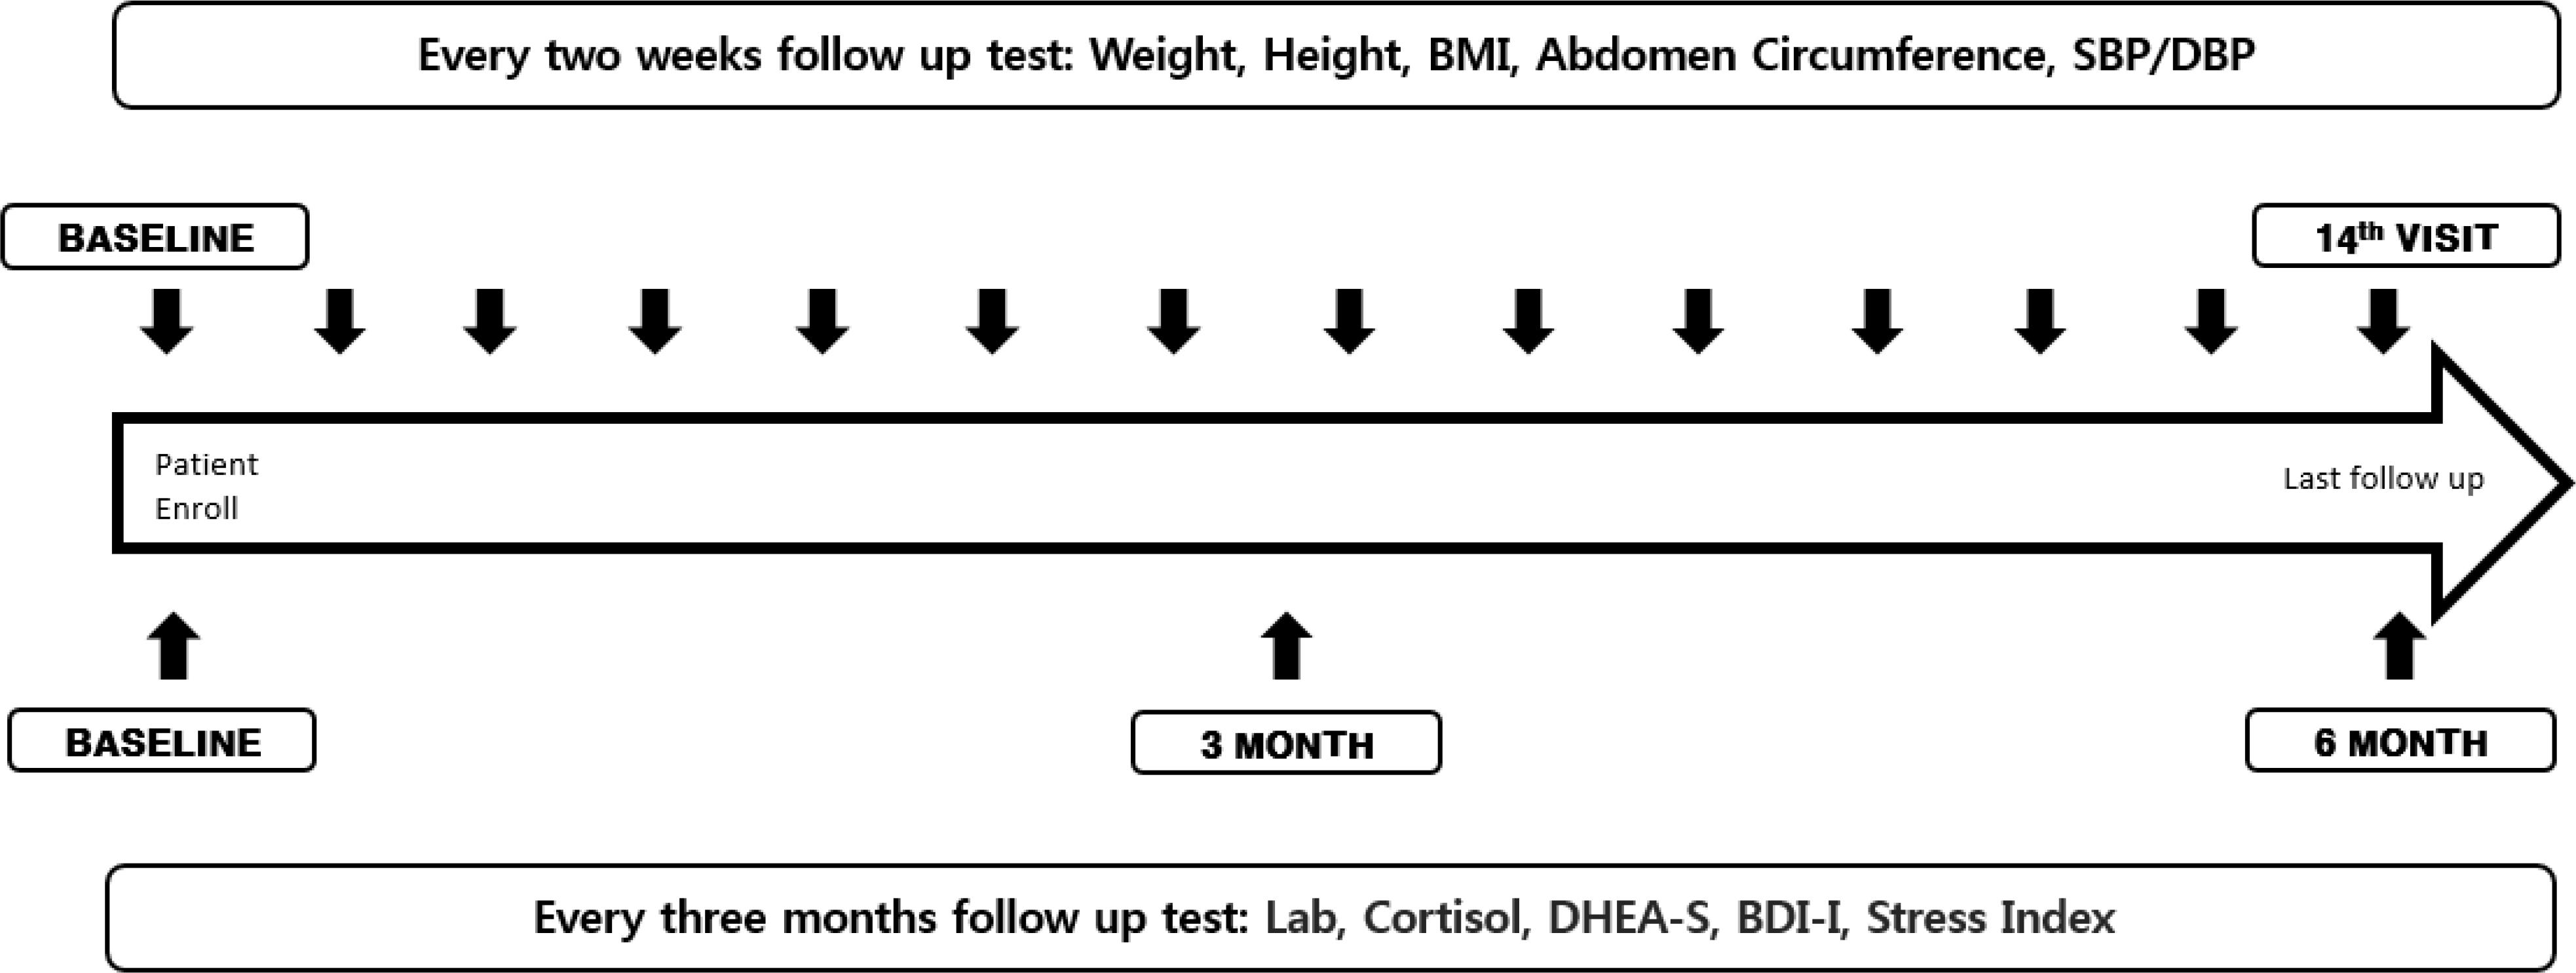
The body weight, waist circumference, body mass index (BMI), and blood pressure (BP) was measured every 2 weeks, and laboratory blood tests with a survey including Beck Depression Inventory (BDI) and eating behavior index was checked at 0, 3, and 6 months. Paired t-test and linear mixed model was done to evaluate the difference between pre-treatment data and post-treatment data.
Results:
Twenty-one patients (2 males, median age [interquartile range] of 39 years [29-46]) were analyzed. There were statistically significant reductions of body weight (P<0.01), BMI (P<0.01), waist circumference (P<0.01), low-density lipoprotein (P=0.01), BDI-I (P<0.01), eating behavior index (P<0.01). There was no statistically significant difference of safety outcome of the BP and blood tests.
Go to : 
REFERENCES
1.World Health Organization. Obesity: Preventing and Managing the Global Epidemic, Geneva: World Health Organization. 2000. p.256.
2.Flegal KM., Carrol MD., Ogden CL., Johnson CL. Prevalence and trends in obesity among US adults, 1999-2000. JAMA. 2002. 288(14):1723–7.

3.World Health Organization. The Asia-Pacific Perspective. Redefining Obesity and its Treatment. Sydney: Health Communications;2000.
4.Van Gaal LF., Mertens IL., De Block CE. Mechanisms linking obesity with cardiovascular diease. Nature. 2006. 444(7121):875–80.
5.Calle EE., Rodriguez C., Walker-Thurmond K., Thun MJ. Overweight, obesity, and mortality from cancer in a prospective studied cohort of U.S. adults. N Engl J Med. 2003. 348(17):1625–38.
6.Korea Centers for Disease Control and Prevention. Korea Health Statistics 2010: Korea National Health and Nutrition Examination Survey (KNHANES V-1). Sejong: Ministry of Health and Welfare;2010.
7.Lee SM., Yoon YD., Back JH., Hyeon GR., Kang HR. Socioeconomic impact of major health risk factors and evaluation of regulatory policy effectiveness. National Health Insurance Service, Health Insurance Policy Institute. 2015. 559–647.
8.Jeong BG., Moon OR., Kim NS., Kang JH., Yoon TH., Lee SY, et al. Socioeconomic costs of obesity for Korean adults. Korean J Prev Med. 2002. 35(1):1–2.
9.Zhang H., Xu H., Song F., Xu W., Pallard-Borg S., Qi X. Relation of socioeconomic status to overweight and obesity: a large population-based study of Chinese adults. Ann Hum Biol. 2017 May 23. [Epub ahead of print].

10.Marquezine GF., Oliveira CM., Pereira AC., Krieger JE., Mill JG. Metabolic syndrome determinants in an urban population from Brazil: social class and gender-specific interaction. Int J Cardiol. 2008. 129(2):259–65.

11.Kim SH., Park JY., Kim DH. Socioeconomic status and health behaviors associated with metabolic syndrome in adults over 40 years. Korean J Health Promot. 2013. 13(4):125–32.
12.Santos AC., Ebrahim S., Barros H. Gender, socioeconomic status and metabolic syndrome in middle-aged and old adults. BMC Public Health. 2008. 8:62.

13.Beck AT., Ward CH., Mendelson M., Mock J., Erbaugh J. An inventory for measuring depression. Arch Gen Psychiatry. 1961. 4:561–71.

14.Caldwell RA., Pearson JL., Chin RJ. Stress-moderating effects: social support in the context of gender and locus of control. Pers Soc Psychol Bull. 1987. 13(1):5–17.
15.Lee YH., Song JY. A study of the reliability and the validity of the BDI, SDS, and MMPI-D scales. Korean J Clin Psychol. 1991. 10(1):98–113.
16.Nam SJ., Park J. Depression and stress related to obesity among normal, obese, and severe obese groups. Korean J Human Ecology. 2012. 21(6):1199–210.
17.Morgan CA 3rd., Southwick S., Hazlett G., Rasmusson A., Hoyt G., Zimolo Z, et al. Relationships among plasma dehydroepiandrosterone sulfate and cortisol levels, symptoms of dissociation, and objective performance in humans exposed to acute stress. Arch Gen Psychiatry. 2004. 61(8):819–25.
18.Van Strien T., Frijters JE., Bergers G., Defares PB. The dutch eating behavior questionnaire (DEBQ) for assessment of restrained, emotional and external eating behavior. Int J Eat Disord. 1986. 5(2):295–315.

19.Kim KK., Cho HJ., Kang HC., Youn BB., Lee KR. Effects on weight reduction and safety of short-term phentermine administration in Korean obese people. Yonsei Med J. 2006. 47(5):614–25.

20.Smith SR., Weissman NJ., Anderson CM., Sanchez M., Chuang E., Stubbe S, et al. Multicenter, placebo-controlled trial of lorcaserin for weight management. N Engl J Med. 2010. 363(3):245–56.

21.Apovian CM., Aronne L., Rubino D., Still C., Wyatt H., Burns C, et al. A randomized, phase 3 trial of naltrexone SR/bupropion SR on weight and obesity-related risk factors (COR-II). Obesity (Silver Spring). 2013. 21(5):935–43.

22.Berner A., Yousafzai MT., Darwish S., Al-Hamaq AO., Nasralla EA., Abdul-Ghani M. Obesity index that better predict metabolic syndrome: body mass index waist circumstances, waist hip ratio, or waist height ratio. J Obes. 2013. 2013:269038.
23.Esposito K., Pontillo A., Di Palo C., Giugliano G., Masella M., Marfella R, et al. Effect of weight loss and lifestyle changes on vascular inflammatory markers in obese women: a randomized trial. JAMA. 2003. 289(14):1799–804.
24.Bujalska IJ., Kumar S., Stewart PM. Does central obesity reflect "Cushing's disease of the omentum"? Lancet. 1997. 349(9060):1210–3.

25.Barrett-Connor E., Ferrara A. Dehydroepiandrosterone, dehydroepiandrosterone sulfate, obesity, waist-hip ratio, and non-insulin-dependent diabetes in postmenopausal women: the Rancho Bernado Study. J Clin Endocrinol Metab. 1996. 81(1):59–64.
26.Sachs-Ericsson N., Burns AB., Gordon KH., Eckel LA., Wonder-lich SA., Crosby RD, et al. Body mass index and depressive symptoms in older adults: the moderating roles of race, and soci-oeconomics status. Am J Geriatr Psychiatry. 2007. 15(9):815–25.
27.Scott KM., McGee MA., Wells JE., Oakley Browne MA. Obesity and mental disorders in the adult general population. J Psychosom Res. 2008. 64(1):97–105.

28.Heo M., Pietrobelli A., Fontaine KR., Sirey JA., Faith MS. Depressive mood and obesity in US adults: comparison and moderation by sex, age, and race, Int J Obes (Lond). 2006. 30(3):513–9.
Go to : 
Table 1.
Baseline characteristics of 21 patients
Table 2.
Every 2 weeks follow up data of the 21 patients for 26 weeks
Table 3.
Difference between baseline and 3 months and 6 months
| Parameter Body weight | Baseline 96.2±19.9 | 3 months 86.2±18.1 | N 24 | P <0.001a | Difference 10.0±5.0 | Baseline 100.4±23.0 | 6 months 84.7±22.0 | N 21 | P <0.000 | Difference 15.7±7.6 |
|---|---|---|---|---|---|---|---|---|---|---|
| BMI | 36.3±6.1 | 32.6±5.6 | 24 | <0.001a | 3.7±1.7 | 37.7±6.9 | 31.9±6.7 | 21 | <0.000 | 5.8±2.9 |
| WC | 114.4±13.1 | 106.3±16.0 | 24 | <0.001a | 8.1±5.4 | 114.8±15.3 | 102.6±20.5 | 21 | 0.001a | 12.2±9.1 |
| Total cholesterol | 192.6±34.5 | 178.3±21.8 | 24 | 0.030a | 14.3±27.3 | 192.7±38.9 | 173.8±22.4 | 21 | 0.141a | 18.9±41.4 |
| HDL-cholesterol | 52.3±11.9 | 48.9±11.7 | 24 | 0.053a | 3.4±7.4 | 52.5±13.2 | 52.3±8.8 | 21 | 0.904b | 0.3±7.0 |
| LDL-cholesterol | 126.6±33.0 | 115.4±20.4 | 24 | 0.049a | 11.2±23.7 | 125.1±39.0 | 106.2±23.6 | 21 | 0.092a | 18.9±35.5 |
| Triglyceride | 103.1±39.3 | 104.9±36.9 | 24 | 0.829a | -1.9±37.8 | 110.1±41.0 | 107.6±36.2 | 21 | 0.860a | 2.5±48.0 |
| Cortisol | 12.2±5.7 | 11.0±4.6 | 24 | 0.507a | 1.1±7.4 | 13.7±6.7 | 12.0±3.6 | 21 | 0.332a | 1.7±5.9 |
| DHEA-S | 187.2±96.2 | 177.7±93.6 | 24 | 0.269b | 9.6±37.6 | 189.0±90.0 | 185.5±119.8 | 21 | 0.863b | 3.6±70.5 |
| BDI-I | 35.6±23.4 | 28.4±23.6 | 24 | 0.135a | 7.2±18.8 | 28.7±20.6 | 16.8±11.3 | 21 | 0.019a | 11.9±14.2 |
| Restrained eating behavior | 18.9±4.8 | 27.7±6.6 | 24 | <0.001a | -8.7±7.7 | 18.9±5.3 | 27.5±6.1 | 21 | 0.003a | -8.6±7.9 |
| Emotional eating behavior | 23.9±11.2 | 20.1±5.2 | 24 | 0.043a | 3.8±10.5 | 22.5±9.7 | 17.1±3.5 | 21 | 0.041a | 5.4±8.1 |
| External eating behavior | 22.6±7.1 | 19.1±5.1 | 24 | 0.036a | 3.5±6.4 | 21.8±6.8 | 17.8±3.2 | 21 | 0.028a | 4.0±5.5 |
| Glucose (FBS) | 97.6±26.6 | 91.6±20.7 | 24 | 0.173b | 6.1±19.1 | 106.6±30.9 | 115.2±47.8 | 21 | 0.371a | -8.6±31.9 |
| AST | 28.8±17.3 | 28.8±16.2 | 24 | 0.099b | 4.6±11.7 | 36.1±18.7 | 24.3±11.8 | 21 | 0.014a | 11.8±14.1 |
| ALT | 28.5±18.5 | 21.9±17.0 | 24 | 0.126a | 6.6±18.5 | 35.1±19.3 | 22.8±13.6 | 21 | 0.052a | 12.3±19.4 |
| γ-GTP | 49.0±35.4 | 39.8±34.3 | 24 | 0.055a | 9.2±20.1 | 63.5±37.6 | 43.9±36.3 | 21 | 0.055b | 19.6±19.4 |
| WBC | 7.4±2.9 | 7.2±2.1 | 24 | 0.610b | 0.2±1.7 | 7.6±3.4 | 7.9±2.7 | 21 | 0.548b | -0.4±2.1 |
| RBC | 4.6±0.4 | 4.6±0.4 | 24 | 0.105b | 0.1±0.3 | 4.7±0.4 | 4.7±0.6 | 21 | 0.820b | -0.0±0.2 |
| Hemoglobin | 13.7±1.6 | 13.4±1.6 | 24 | 0.078b | 0.3±0.8 | 13.7±2.0 | 13.7±2.4 | 21 | 0.735b | -0.1±0.8 |
| Platelet | 301.1±84.5 | 307.6±57.7 | 24 | 0.719a | -6.4±79.0 | 316.3±57.0 | 315.6±57.0 | 21 | 0.925b | 0.8±26.9 |
Abbreviations: BMI, body mass index; WC, waist circumference; HDL, high-density lipoprotein; LDL, low-density lipoprotein; DHEA-S, Dehydroepiandrosterone sulfate; BDI-I, Beck Depression Inventory-I; FBS, fasting blood sugar; AST, aspartate aminotransferas; ALT, alanine aminotransferase; γ-GTP, gamma-glutamyl transferase; WBC, white blood cell; RBC, red blood cell.
Table 4.
Linear mixed model summary of effective outcome for time variation
Table 5.
Linear mixed model summary of safety outcome for time variation


 PDF
PDF ePub
ePub Citation
 Print
Print


 XML Download