Abstract
Background
Methods
Results
Figures and Tables
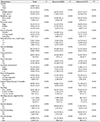
Table 1
Characteristics of study population

Values are presented as number (%) using frequency analysis in complex sample design.
aP values are obtained by F-test.
bPhysical activity for a week is defined as a day in which a total of 60 minutes or more of a day ‘physical activity of the heartbeat is increased or breathed’ during the past 7 days.
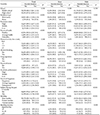
Table 5
Odds ratio for suicidal ideation according to smoking and daily smoking amount by logistic regression

Values are presented as adjusted odds ratio (95% confidence interval). Calculated by multivariate logistic regression analysis using complex sampling design.
aLogistic regression for suicidal ideation with smoking and smoking amount without adjustment.
bLogistic regression for suicidal ideation with smoking and smoking amount after adjustment for school, residence type, and economic status.
cLogistic regression for suicidal ideation with smoking and smoking amount after adjustment for school, residence type, economic status, perceived health, physical activity for a week, alcohol drinking, and drug experience.
dLogistic regression for suicidal ideation with smoking and smoking amount after adjustment for school, residence type, economic status, perceived health, physical activity for a week, alcohol drinking, drug experience, perceived stress, academic performance, perceived happiness, and sadness during the past 12 months.
eP values are obtained by F-test.
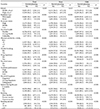
Table 6
Odds ratio for suicidal planning according to smoking and daily smoking amount by logistic regression

Values are presented as adjusted odds ratio (95% confidence interval). Calculated by multivariate logistic regression analysis using complex sampling design.
aLogistic regression for suicidal planning with smoking and smoking amount without adjustment.
bLogistic regression for suicidal planning with smoking and smoking amount after adjustment for school, residence type, and economic status.
cLogistic regression for suicidal planning with smoking and smoking amount after adjustment for school, residence type, economic status, perceived health, physical activity for a week, alcohol drinking, and drug experience.
dLogistic regression for suicidal planning with smoking and smoking amount after adjustment for school, residence type, economic status, perceived health, physical activity for a week, alcohol drinking, drug experience, perceived stress, academic performance, perceived happiness, and sadness during the past 12 months.
eP values are obtained by F-test.
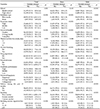
Table 7
Odds ratio for suicidal attempt according to smoking and daily smoking amount by logistic regression

Values are presented as adjusted odds ratio (95% confidence interval). Calculated by multivariate logistic regression analysis using complex sampling design.
aLogistic regression for suicidal attempt with smoking and smoking amount without adjustment.
bLogistic regression for suicidal attempt with smoking and smoking amount after adjustment for school, residence type, and economic status.
cLogistic regression for suicidal attempt with smoking and smoking amount after adjustment for school, residence type, economic status, perceived health, physical activity for a week, alcohol drinking, and drug experience.
dLogistic regression for suicidal attempt with smoking and smoking amount after adjustment for school, residence type, economic status, perceived health, physical activity for a week, alcohol drinking, drug experience, perceived stress, academic performance, perceived happiness, and sadness during the past 12 months.
eP values are obtained by F-test.


 PDF
PDF ePub
ePub Citation
 Print
Print


 XML Download