Abstract
Background
Self-monitoring of blood glucose is an important component of therapy for diabetes mellitus. The aim of this study was to evaluate the analytic performance evaluation of blood monitoring system G400 according to ISO 15197:2013.
Methods
We evaluated the G400 according to the ISO 15197:2013 guideline, we measured precision, accuracy, interference of hematocrit and interfering substances, user performance.
Results
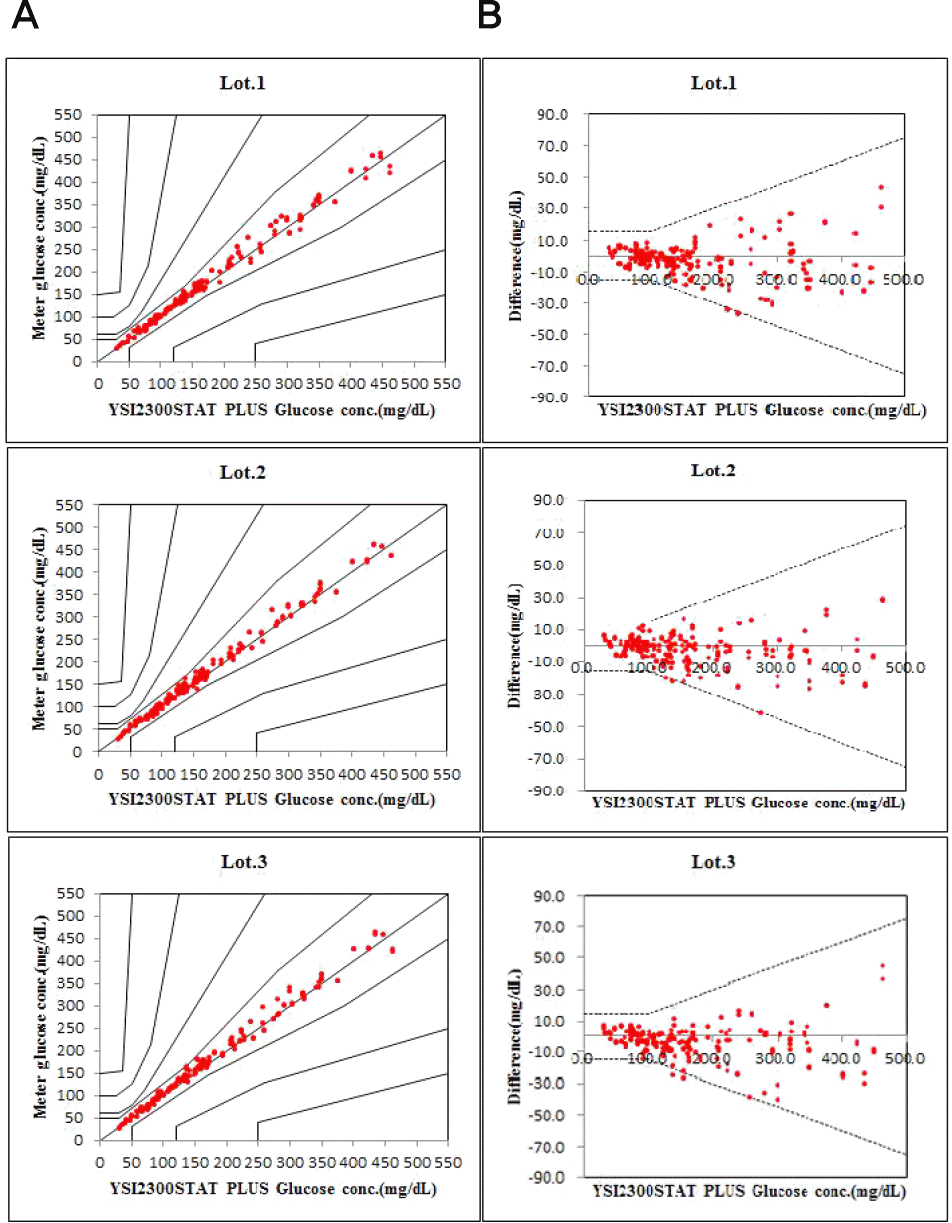
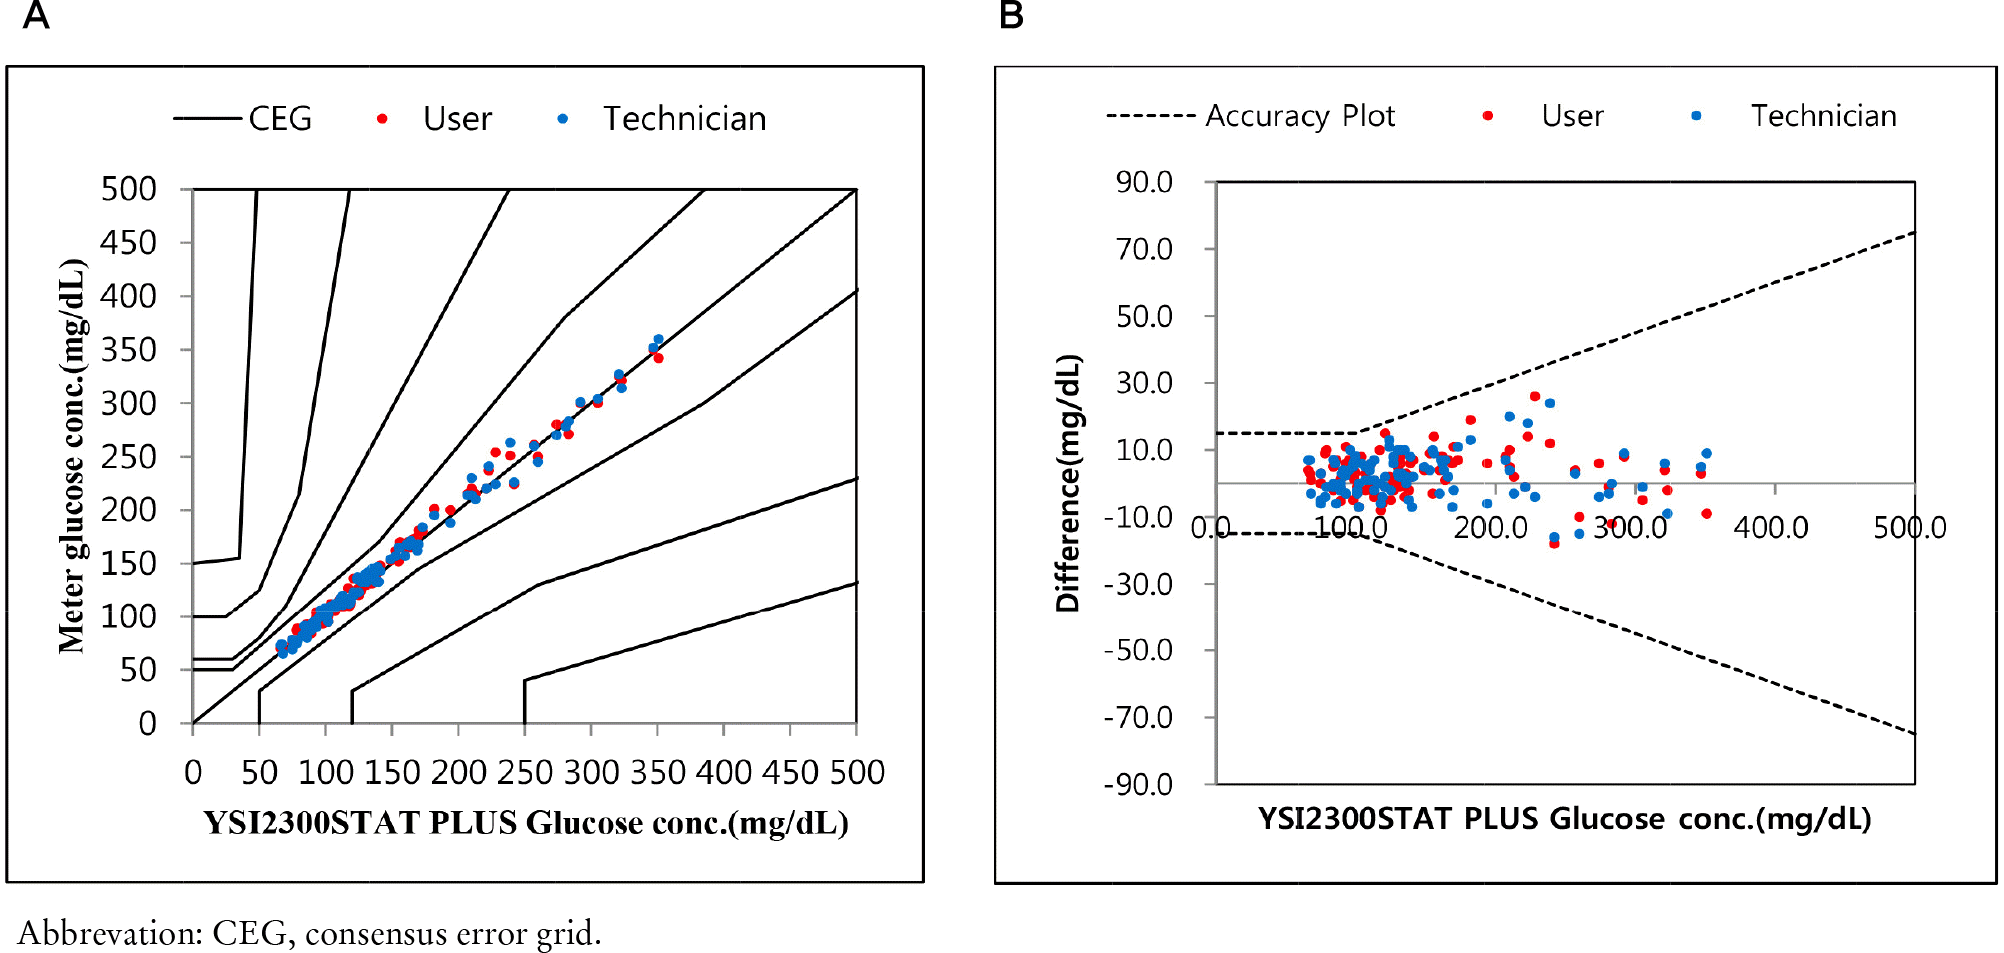
Repeatability and intermediate precision of G400 showed standard deviation 2.7–3.8 mg/dL, 2.4–3.6 mg/dL and coefficient of variation 1.9–2.9% and 1.7–3.7%, respectively. Accuracy measured 98–98.5%, satisfied acceptable criteria. Error grid analysis showed that all results of this study were in zone A. Hematocrit between 20% to 60% did not cause interference. Three of 24 interfering substances were not acceptable criteria, and dose-response evaluation was needed.
References
1. Kim MH, Kim MK, Choi BY, Shin YJ. Educational disparities in the metabolic syndrome in a rapidly changing society–the case of South Korea. Int J Epidemiol. 2005; 34(6):1266–73.

2. Huh HJ, Park HD, Lee SY, Kim JW. Evaluation of CareSens(R) N glucometer glucose monitoring system. J Lab Med Qual Assur. 2010; 32(2):229–36.
3. Kwon MJ, Lee SY. Evaluation of GLUCOCARD X-METER glucose monitoring system. Korean J Lab Med. 2008; 28(1):8–15.

4. Song SH, Park HD, Lee HJ, Chun SH, Park KU, Kim JQ, et al. Evaluation of Gluchec fine glucometer. J Lab Med Qual Assur. 2007; 29(1):187–94.
5. Lee SY, Lee NY, Kim JW. Evaluation of 6 glucose testing systems. Korean J Lab Med. 2003; 23(3):170–9.
6. Yoo EH, Cho HJ, Ki CS, Lee SY. Evaluation of COSMOsensor glucose monitoring system. Korean J Lab Med. 2006; 26(1):1–8.

7. The International Organization for Standardization. In vitro diagnostic test systems – Requirements for blood glucose monitoring systems for self-testing in managing diabetes mellitus. ISO/TC 212/SC. International Standard ISO 15197. Geneva: The International Organization for Standardization;2013.
Figure 2.
Interference of hematocrit. The two bold lines represent the acceptance criteria: ±10 mg/dL of the results at glucose concentrations <100 mg/dL, ±10% of the results at glucose concentrations ≥100 mg/dL. Interval 1 is 30–50 mg/dL, interval 2 is 96–144 mg/dL, interval 3 is 280–420 mg/dL.

Table 1.
Repeatability of G400
| YSI 2300 STAT PLUS, mg/dL | Lot 1 | Lot 2 | Lot 3 | YSI 2300 STAT PLUS last mean, mg/dL | YSI 2300 STAT PLUS differ % or mg/dL | Grand mean, mg/dL | Pooled SD or CV | ||||||
|---|---|---|---|---|---|---|---|---|---|---|---|---|---|
| Mean | SD | CV | Mean | SD | CV | Mean | SD | CV | |||||
| 41.5 | 42.3 | 3.1 | –a | 39.3 | 3.3 | – | 40.5 | 3.7 | – | 39.5 | 2.0 mg/dL | 40.7 | 3.6 mg/dL |
| 99.2 | 95.3 | 3.8 | – | 93.3 | 2.7 | – | 90.8 | 3.8 | – | 98.4 | 0.9 mg/dL | 93.1 | 3.9 mg/dL |
| 138 | 131.6 | 3.4 | 2.6 | 130.9 | 3.2 | 2.4 | 132.0 | 3.8 | 2.9 | 135.5 | 1.8% | 131.5 | 2.7% |
| 206 | 194.4 | 4.6 | 2.3 | 195.2 | 4.3 | 2.2 | 193.9 | 5.4 | 2.8 | 202.0 | 1.9% | 194.5 | 2.5% |
| 281 | 272.0 | 5.5 | 2.0 | 270.0 | 5.1 | 1.9 | 272.4 | 5.6 | 2.1 | 277.0 | 1.4% | 271.5 | 2.0% |
Table 2.
Intermediate precision of G400
| Interval | Lot 1 | Lot 2 | Lot 3 | Pooled SD or CV | |||||||
|---|---|---|---|---|---|---|---|---|---|---|---|
| Mean | SD | CV | Mean | SD | CV | Mean | SD | CV | |||
| User 1 | |||||||||||
| 30–50 | 42.6 | 3.1 | –a | 43.5 | 2.8 | – | 44.1 | 2.5 | – | 2.8 mg/dL | |
| 96–144 | 120.2 | 3.9 | 3.3 | 119.9 | 3.6 | 3.0 | 120.1 | 4.4 | 3.6 | 3.3% | |
| 280–420 | 365.2 | 8.6 | 2.4 | 365.6 | 8.8 | 2.4 | 370.1 | 8.6 | 2.3 | 2.4% | |
| User 2 | |||||||||||
| 30–50 | 45.7 | 3.4 | – | 46.1 | 2.4 | – | 45.7 | 2.8 | – | 2.9 mg/dL | |
| 96–144 | 125.0 | 3.6 | 2.9 | 124.7 | 2.9 | 2.3 | 124 | 2.7 | 2.2 | 2.5% | |
| 280–420 | 379.6 | 7.7 | 2.0 | 384.7 | 6.6 | 1.7 | 365.5 | 7.1 | 1.9 | 1.9% | |
| Combined result | |||||||||||
| 30–50 | 44.1 | 3.6 | – | 44.8 | 2.9 | – | 44.9 | 2.8 | – | 3.1 mg/dL | |
| 96–144 | 122.6 | 4.5 | 3.7 | 122.3 | 4.1 | 3.3 | 122.0 | 4.1 | 3.4 | 3.5% | |
| 280–420 | 372.4 | 10.9 | 2.9 | 375.1 | 12.3 | 3.3 | 367.8 | 8.2 | 2.2 | 2.8% | |
Table 3.
System accuracy results for glucose concentrations
Table 4.
Interference of hematocrit
Table 5.
Interference testing possible interfering


 PDF
PDF ePub
ePub Citation
 Print
Print


 XML Download