Abstract
Background
Facial flushing response to drinking is observed in East Asians with deficient activity of the variant aldehyde dehydrogenase 2 genotype. This study examined the role of flushing response in the relationship between alcohol consumption and dyslipidemia.
Methods
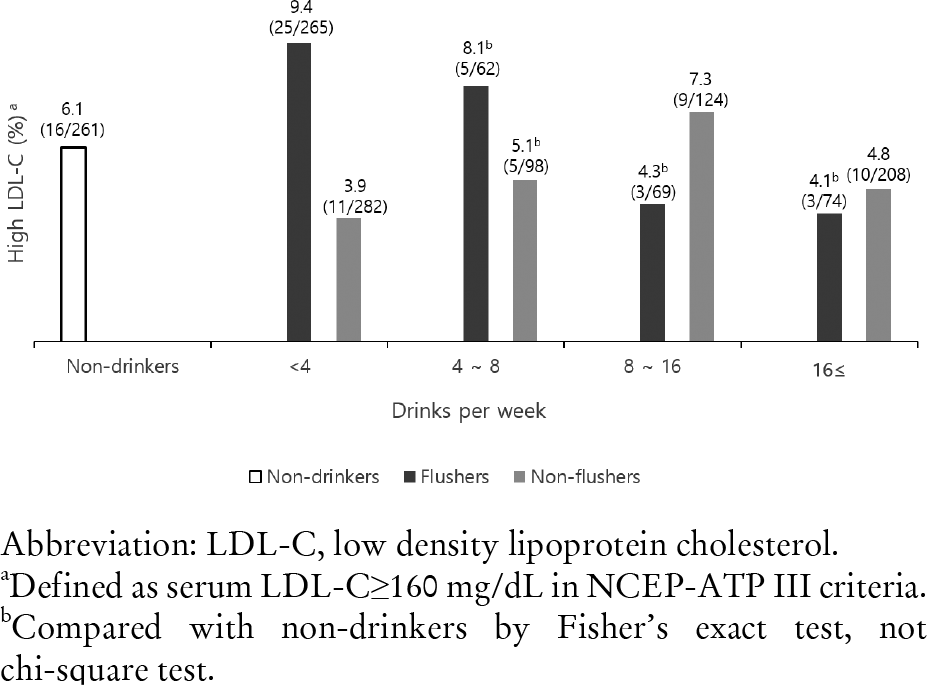
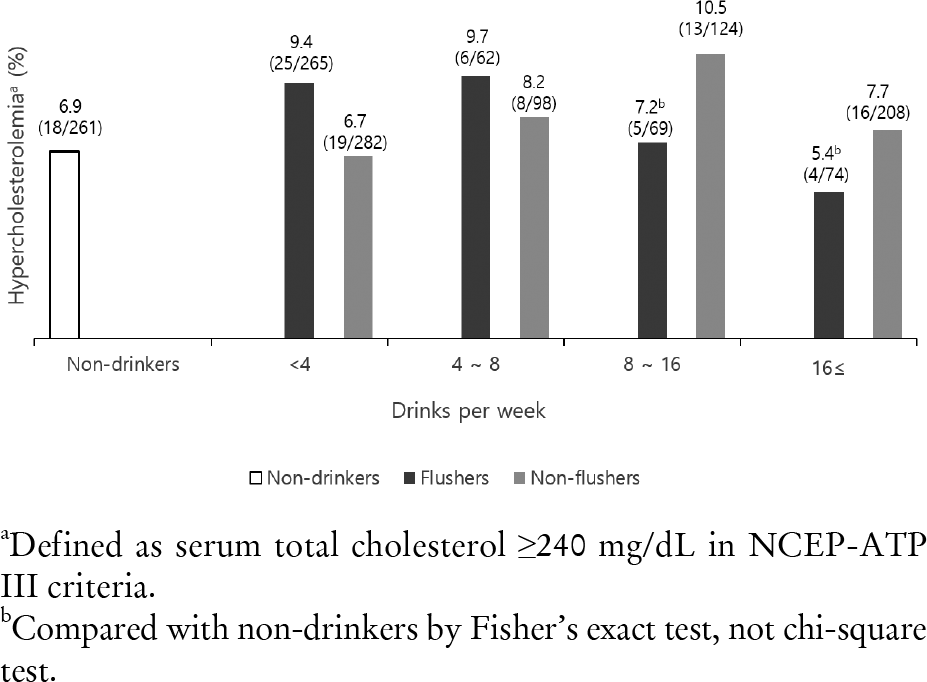
This cross-sectional study included 1,443 Korean men, including 261 non-drinkers, 470 flushers and 712 non-flushers. Based on a questionnaire, weekly alcohol consumption was assessed and categorized into 4 groups. Dyslipidemia was defined by the National Cholesterol Education Program-Adult Treatment Panel III criteria. After adjusting for confounding factors, we evaluated the relationship between weekly alcoholic drinks and dyslipidemia in flushers and non-flushers by comparing with non-drinkers, using a multi-variable logistic regression analysis.
Results
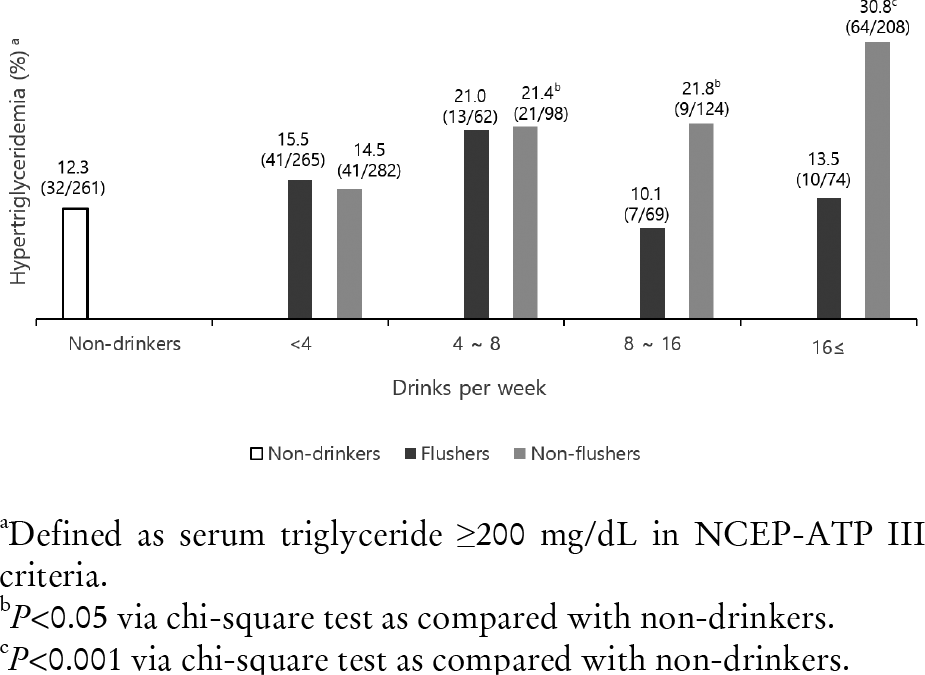
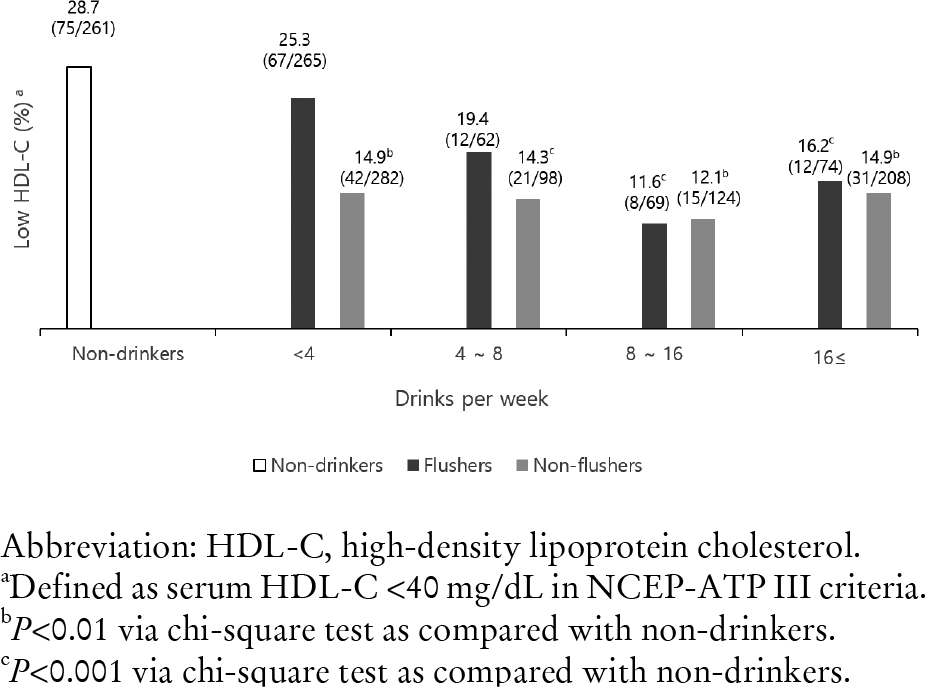
Non-flushers had a significant relationship between hypertriglyceridemia and alcohol consumption in two groups (4–8 drinks: adjusted odds ratio [aOR] 1.937, 95% confidence interval [CI] 1.029–3.644; ≥16 drinks: aOR 2.118, 95% CI 1.272–3.527) in contrast to flushers, who showed no significant relationship between hypertriglyceridemia and alcohol consumption. Non-flushers had a significant relationship to low serum high density lipoprotein (HDL) cholesterol levels in four groups (<4 drinks: aOR 0.428, 95% CI 0.277–0.662; 4–8 drinks: aOR 0.409, 95% CI 0.216–0.774; 8–16 drinks: aOR 0.285, 95% CI 0.152–0.536; ≥16 drinks: aOR 0.343, 95% CI 0.207–0.568), and flushers had a significant relationship in two groups (8–16 drinks: aOR 0.234, 95% CI 0.102–0.536; ≥16 drinks: aOR 0.342, 95% CI 0.166–0.705).
Go to : 
References
1. Crabb DW. Ethanol oxidizing enzymes: roles in alcohol metabolism and alcoholic liver disease. Prog Liver Dis. 1995; 13:151–72.
2. Mizoi Y, Tatsuno Y, Adachi J, Kogame M, Fukunaga T, Fujiwara S, et al. Alcohol sensitivity related to polymorphism of alcohol-metabolizing enzymes in Japanese. Pharmacol Biochem Behav. 1983; 18(Suppl 1):127–33.

3. Agarwal DP, Harada S, Goedde HW. Racial differences in biological sensitivity to ethanol: the role of alcohol dehydrogenase and aldehyde dehydrogenase isozymes. Alcohol Clin Exp Res. 2008; 5(1):12–6.

4. Crabb DW, Matsumoto M, Chang D, You M. Overview of the role of alcohol dehydrogenase and aldehyde dehydrogenase and their variants in the genesis of alcohol related pathology. Proc Nutr Soc. 2004; 63(1):49–63.
5. Higuchi S, Parrish KM, Dufour MC, Towle LH, Harford TC. The relationship between three subtypes of the flushing response and DSM-III alcohol abuse in Japanese. J Stud Alcohol. 1992; 53(6):553–60.

6. Yokoyama A, Muramatsu T, Ohmori T, Kumagai Y, Higuchi S, Ishii H. Reliability of a flushing questionnaire and the ethanol patch test in screening for inactive aldehyde dehydrogenase-2 and alcohol-related cancer risk. Cancer Epidemiol Biomarkers Prev. 1997; 6(12):1105–7.
7. Jung JG, Kim JS, Kim YS, Oh MK, Yoon SJ. Hypertension associated with alcohol consumption based on the facial flushing reaction to drinking. Alcohol Clin Exp Res. 2014; 38(4):1020–5.

8. Jung JG, Kim JS, Oh MK. The role of the flushing response in the relationship between alcohol consumption and insulin resistance. Alcohol Clin Exp Res. 2010; 34(10):1699–704.

9. Yusuf S, Reddy S, Ounpuu S, Anand S. Global burden of cardiovascular diseases: part I: general considerations, the epidemiologic transition, risk factors, and impact of urbanization. Circulation. 2001; 104(22):2746–53.
10. Willenbring ML, Massey SH, Gardner MB. Helping patients who drink too much: an evidencebased guide for primary care clinicians. Am Fam Physician. 2009; 80(1):44–50.
11. Grundy SM, Cleeman JI, Merz CN, Brewer HB Jr, Clark LT, Hunninghake DB, et al. Implications of recent clinical trials for the National Cholesterol Education Program Adult Treatment Panel III Guidelines. J Am Coll Cardiol. 2004; 44(3):720–32.

12. Albert CM, Manson JE, Cook NR, Ajani UA, Gaziano JM, Hennekens CH. Moderate alcohol consumption and the risk of sudden cardiac death among US male physicians. Circulation. 1999; 100(9):944–50.

13. Agarwal DP Cardioprotective effects of light-moderate consumption of alcohol: a review of putative mechanisms. Alcohol Alcohol. 2002; 37(5):409–15.
14. Takagi S, Iwai N, Yamauchi R, Kojima S, Yasuno S, Baba T, et al. Aldehyde dehydrogenase 2 gene is a risk factor for myocardial infarction in Japanese men. Hypertens Res. 2002; 25(5):677–81.

15. Jo SA, Kim EK, Park MH, Han C, Park HY, Jang Y, et al. A Glu487Lys polymorphism in the gene for mitochondrial aldehyde dehydrogenase 2 is associated with myocardial infarction in elderly Korean men. Clin Chim Acta. 2007; 382(1–2):43–7.

16. Choudhury SR, Ueshima H, Kita Y, Kobayashi KM, Okayama A, Yamakawa M, et al. Alcohol intake and serum lipids in a Japanese population. Int J Epidemiol. 1994; 23(5):940–7.

17. Kotani K, Sakane N, Yamada T. Association of an aldehyde dehydrogenase 2 (ALDH2) gene polymorphism with hyper-low-density lipoprotein cholesterolemia in a Japanese population. Ethn Dis. 2012; 22(3):324–8.
18. Korean Society of Lipidology and Atherosclerosis Dyslipidemia. Dyslipidemia fact sheet in Korea 2015 [Internet]. Reston: Korean Society of Lipidology and Atherosclerosis Dyslipidemia;2015. [Accessed December 8, 2015]. Available from:. http://www.lipid.or.kr/bbs/index.html?code=fact_sheet&category=&gubun=&page=1&number=652&mode=view&keyfield=&key=.
19. Van de Wiel A. The effect of alcohol on postprandial and fasting triglycerides. Int J Vasc Med. 2012; 2012:862504.

20. Rakic V, Puddey IB, Dimmitt SB, Burke V, Beilin LJ. A controlled trial of the effects of pattern of alcohol intake on serum lipid levels in regular drinkers. Atherosclerosis. 1998; 137(2):243–52.

21. García-Villafranca J, Guillén A, Castro J. Ethanol consumption impairs regulation of fatty acid metabolism by decreasing the activity of AMP-activated protein kinase in rat liver. Biochimie. 2008; 90(3):460–6.

22. Lindenbaum J, Lieber CS. Effects of chronic ethanol administration on intestinal absorption in man in the absence of nutritional deficiency. Ann N Y Acad Sci. 1975; 252:228–34.

23. Kang L, Chen X, Sebastian BM, Pratt BT, Bederman IR, Alexander JC, et al. Chronic ethanol and triglyceride turnover in white adipose tissue in rats: inhibition of the anti-lipolytic action of insulin after chronic ethanol contributes to increased triglyceride degradation. J Biol Chem. 2007; 282(39):28465–73.
24. Lieber CS, Cao Q, DeCarli LM, Leo MA, Mak KM, Ponomarenko A, et al. Role of medium-chain triglycerides in the alcohol-mediated cytochrome P450 2E1 induction of mitochondria. Alcohol Clin Exp Res. 2007; 31:1660–8.

25. Gaziano JM, Buring JE, Breslow JL, Goldhaber SZ, Rosner B, VanDenburgh M, et al. Moderate alcohol intake, increased levels of high-density lipoprotein and its subfractions, and decreased risk of myocardial infarction. N Engl J Med. 1993; 329(25):1829–34.

26. De Oliveira E Silva ER, Foster D, McGee Harper M, Seidman CE, Smith JD, Breslow JL, et al. Alcohol consumption raises HDL cholesterol levels by increasing the transport rate of apolipoproteins A-I and A-II. Circulation. 2000; 102(19):2347–52.

27. Rimm EB, Williams P, Fosher K, Criqui M, Stampfer MJ. Moderate alcohol intake and lower risk of coronary heart disease: metaanalysis of effects on lipids and haemostatic factors. BMJ. 1999; 319(7224):1523–8.

Go to : 
Table 1.
Characteristics of f the subjects
| Variables | Non-drinkers | Drinkers | |||
|---|---|---|---|---|---|
| (n=261) | Flushers (n=470) | Pa | Non-flushers (n=712) | Pa | |
| Age, y | 49.91±11.77 | 48.20±11.31 | 0.054 | 46.89±10.66 | <0.001 |
| BMI, kg/m2 | 24.47±3.20 | 25.25±2.92 | 0.001 | 24.79±2.96 | 0.161 |
| WC, cm | 85.01±9.33 | 87.49±8.12 | <0.001 | 85.78±8.07 | 0.243 |
| LDL-C, mg/dL | 111.42±30.83 | 110.14±30.30 | 0.586 | 106.56±30.42 | 0.028 |
| TC, mg/dL | 187.72±35.69 | 190.63±34.90 | 0.284 | 190.72±35.03 | 0.240 |
| TG, mg/dL | 129.15±81.75 | 137.61±97.73 | 0.235 | 153.73±101.21 | <0.001 |
| HDL-C, mg/dL | 44.26±7.89 | 46.17±8.00 | 0.002 | 47.54±7.93 | <0.001 |
| FBS, mg/dL | 94.70±29.18 | 94.01±22.83 | 0.724 | 99.91±24.74 | 0.006 |
| Smokingb | <0.001 | <0.001 | |||
| Non-smoker | 124 (47.5) | 140 (29.8) | 243 (34.1) | ||
| Ex-smoker | 89 (34.1) | 159 (33.8) | 206 (28.9) | ||
| Smoker | 48 (18.4) | 171 (36.4) | 263 (36.9) | ||
| Exerciseb | 0.798 | 0.009 | |||
| None | 91 (34.9) | 169 (36.0) | 214 (30.1) | ||
| Irregular | 117 (44.8) | 199 (42.3) | 283 (39.7) | ||
| Regular | 53 (20.3) | 102 (21.7) | 215 (30.2) | ||
| Hypertensionb | 88 (16.6) | 193 (36.5) | 0.050 | 248 (46.9) | 0.746 |
| Type 2 diabetes mellitusb | 19 (15.1) | 37 (29.4) | 0.773 | 70 (55.6) | 0.221 |
| Drinks/weekc | NA | 7.59±11.12 | 11.81±13.09 | <0.001 | |
| <4 | NA | 1.38±1.15 | 2.00±1.20 | <0.001 | |
| 4–8 | NA | 5.63±1.44 | 6.24±1.14 | 0.006 | |
| 8–16 | NA | 11.80±2.14 | 11.94±1.68 | 0.662 | |
| ≥16 | NA | 27.56±14.84 | 27.68±13.61 | 0.950 | |
Abbreviations: BMI, body mass index; WC, waist circumference; LDL-C, low-density lipoprotein cholesterol; TC, total cholesterol; TG, triglyceride; HDL-C, high-density lipoprotein cholesterol; FBS, fasting blood sugar; NA, not availabe. Values are presented as N (%) or mean±SD unless otherwise indicated.
Table 2.
Relationship dyslipidemia and weekly alcohol drinks in flushers and non-flushers
| Drinks/wka | Flushers (n=470) | Non-flushers (n=712) | ||||
|---|---|---|---|---|---|---|
| Odds ratio | 95% confidence interval | Pb | Odds ratio | 95% confidence interval | Pb | |
| LDL-C≥160 mg/dL | ||||||
| Non-drinkers | 1.000 | 1.000 | ||||
| <4 | 1.062 | 0.525–2.149 | 0.867 | 0.600 | 0.266–1.352 | 0.218 |
| 4–8 | 0.927 | 0.304–2.823 | 0.893 | 0.732 | 0.253–2.117 | 0.565 |
| 8–16 | 0.423 | 0.113–1.583 | 0.201 | 0.941 | 0.382–2.318 | 0.895 |
| ≥16 | 0.370 | 0.099–1.839 | 0.141 | 0.551 | 0.229–1.322 | 0.182 |
| TC≥240 mg/dL | ||||||
| Non-drinkers | 1.000 | 1.000 | ||||
| <4 | 0.967 | 0.491–1.905 | 0.922 | 0.966 | 0.485–1.922 | 0.921 |
| 4–8 | 1.014 | 0.361–2.847 | 0.979 | 1.124 | 0.462–2.735 | 0.796 |
| 8–16 | 0.679 | 0.229–2.016 | 0.486 | 1.229 | 0.556–2.718 | 0.610 |
| ≥16 | 0.485 | 0.150–1.566 | 0.226 | 0.805 | 0.380–1.707 | 0.572 |
| TG≥200 mg/dL | ||||||
| Non-drinkers | 1.000 | 1.000 | ||||
| <4 | 1.247 | 0.744–2.091 | 0.403 | 1.118 | 0.710–1.987 | 0.512 |
| 4–8 | 1.703 | 0.788–3.679 | 0.175 | 1.937 | 1.029–3.644 | 0.040 |
| 8–16 | 0.539 | 0.213–1.361 | 0.191 | 1.438 | 0.789–2.623 | 0.236 |
| ≥16 | 0.970 | 0.428–2.198 | 0.941 | 2.118 | 1.272–3.527 | 0.004 |
| HDL-C<40 mg/dL | ||||||
| Non-drinkers | 1.000 | 1.000 | ||||
| <4 | 0.770 | 0.514–1.153 | 0.204 | 0.428 | 0.277–0.662 | <0.001 |
| 4–8 | 0.508 | 0.248–1.040 | 0.064 | 0.409 | 0.216–0.774 | 0.006 |
| 8–16 | 0.234 | 0.102–0.536 | 0.001 | 0.285 | 0.152–0.536 | <0.001 |
| ≥16 | 0.342 | 0.166–0.705 | 0.004 | 0.343 | 0.207–0.568 | <0.001 |
Table 3.
Relationship dyslipidemia and weekly alcohol drinks in flushers, comparing with non-flushersa,b
| Drinks/wkb | Pa | Odds | 95% confidence |
|---|---|---|---|
| ratio | interval | ||
| Non-flushers | 1.000 | ||
| LDL-C≥160 mg/dL | |||
| <4 | 0.162 | 1.757 | 0.798–3.866 |
| 4–8 | 0.587 | 1.492 | 0.351–6.388 |
| 8–16 | 0.163 | 0.322 | 0.065–1.582 |
| ≥16 | 0.422 | 0.551 | 0.129–2.358 |
| TC≥240 mg/dL | |||
| <4 | 0.799 | 0.915 | 0.463–1.809 |
| 4–8 | 0.907 | 0.931 | 0.283–3.067 |
| 8–16 | 0.459 | 0.643 | 0.200–2.070 |
| ≥16 | 0.560 | 0.697 | 0.206–2.351 |
| TG≥200 mg/dL | |||
| <4 | 0.876 | 0.961 | 0.585–1.579 |
| 4–8 | 0.770 | 0.877 | 0.365–2.110 |
| 8–16 | 0.040 | 0.360 | 0.135–0.955 |
| ≥16 | 0.002 | 0.285 | 0.128–0.638 |
| HDL-C<40 mg/dL | |||
| <4 | 0.010 | 1.819 | 1.157–2.860 |
| 4–8 | 0.565 | 1.319 | 0.514–3.386 |
| 8–16 | 0.763 | 0.857 | 0.315–2.331 |
| ≥16 | 0.915 | 1.044 | 0.474–2.297 |
Abbreviations: LDL-C, low density lipoprotein cholesterol; TC, total cholesterol; TG, triglyceride; HDL-C, high density lipoprotein cholesterol.


 PDF
PDF ePub
ePub Citation
 Print
Print


 XML Download