Abstract
Background
High sodium and/or low mineral intake are known to be associated with elevated blood pressure. It has been reported that substituting low-sodium, mineral-rich salt for refined salt lowers blood pressure (BP). And solar salt is emerging as a low sodium high mineral salt for a healthy diet in Korea. Therefore, this double-blind, randomized, and placebo-controlled trial was conducted to explore changes in BP from substituting refined salt with solar salt among hypertensive elderly subjects.
Methods
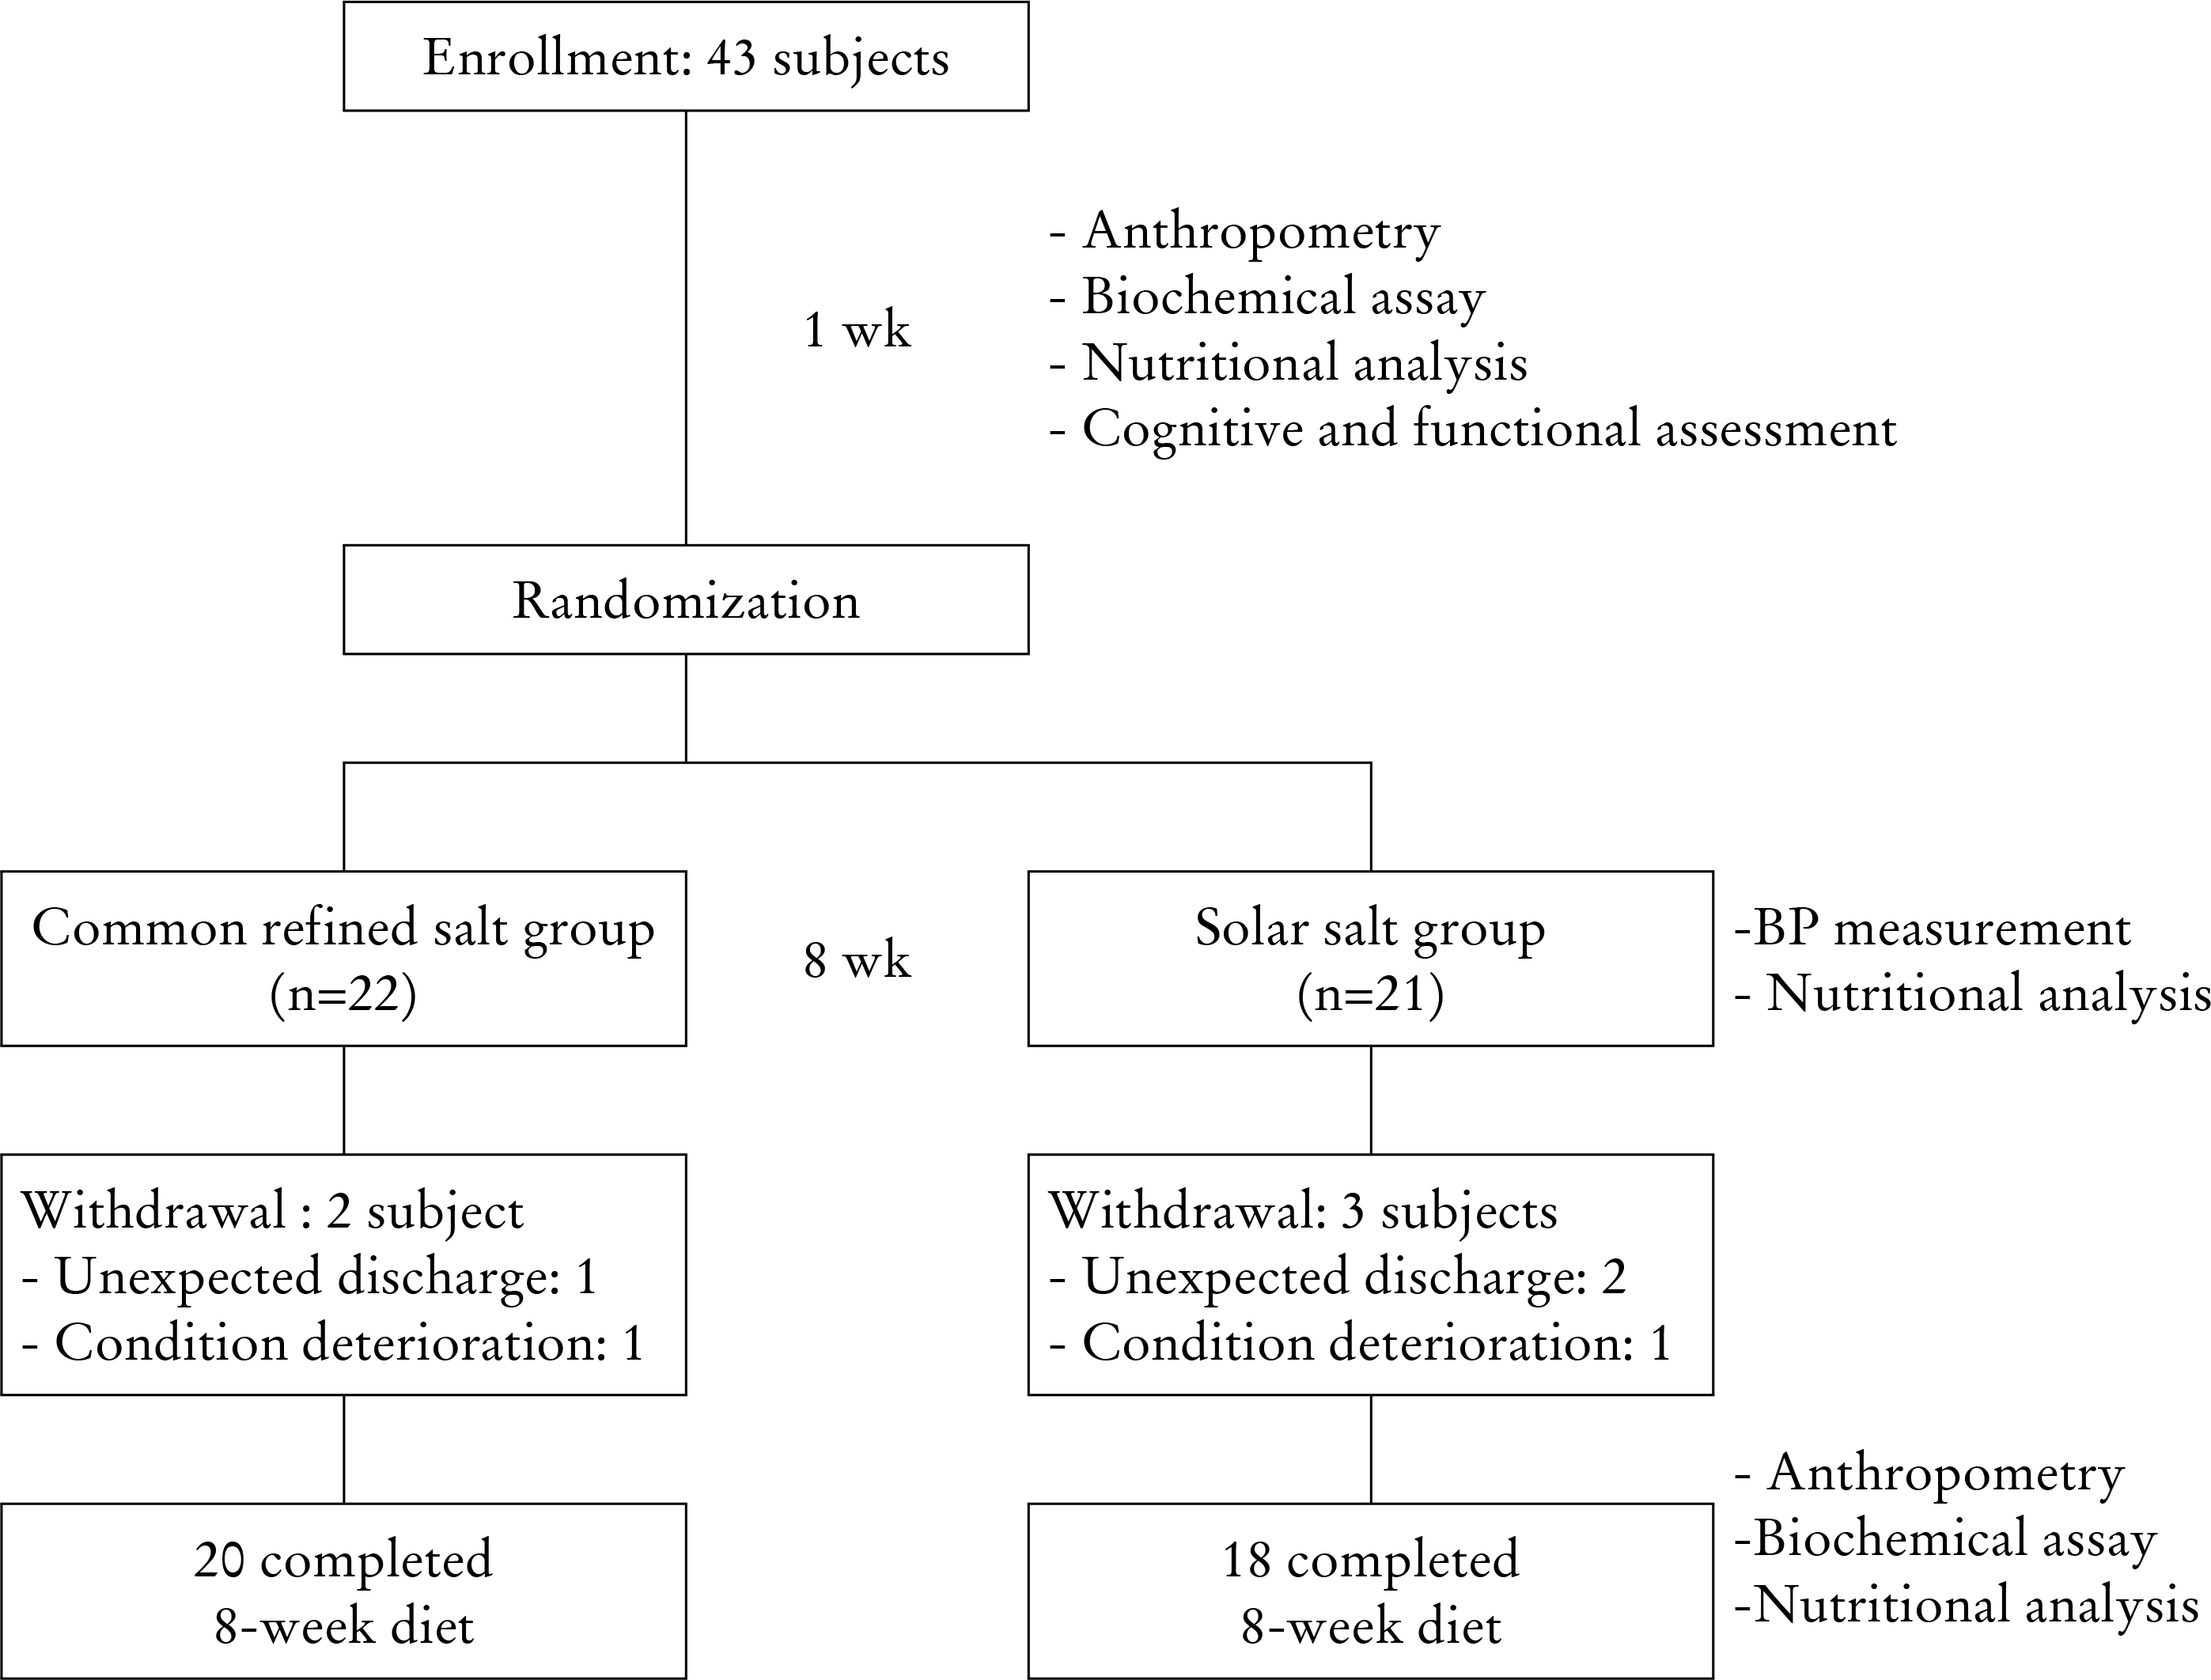
Forty-three hypertensive and institutionalized elderly individuals aged 65 years or older were enrolled. Thirty-eight subjects (88.4%) completed the study. Subjects were provided with either a solar salt- or refined salt-based diet for eight weeks.
Results
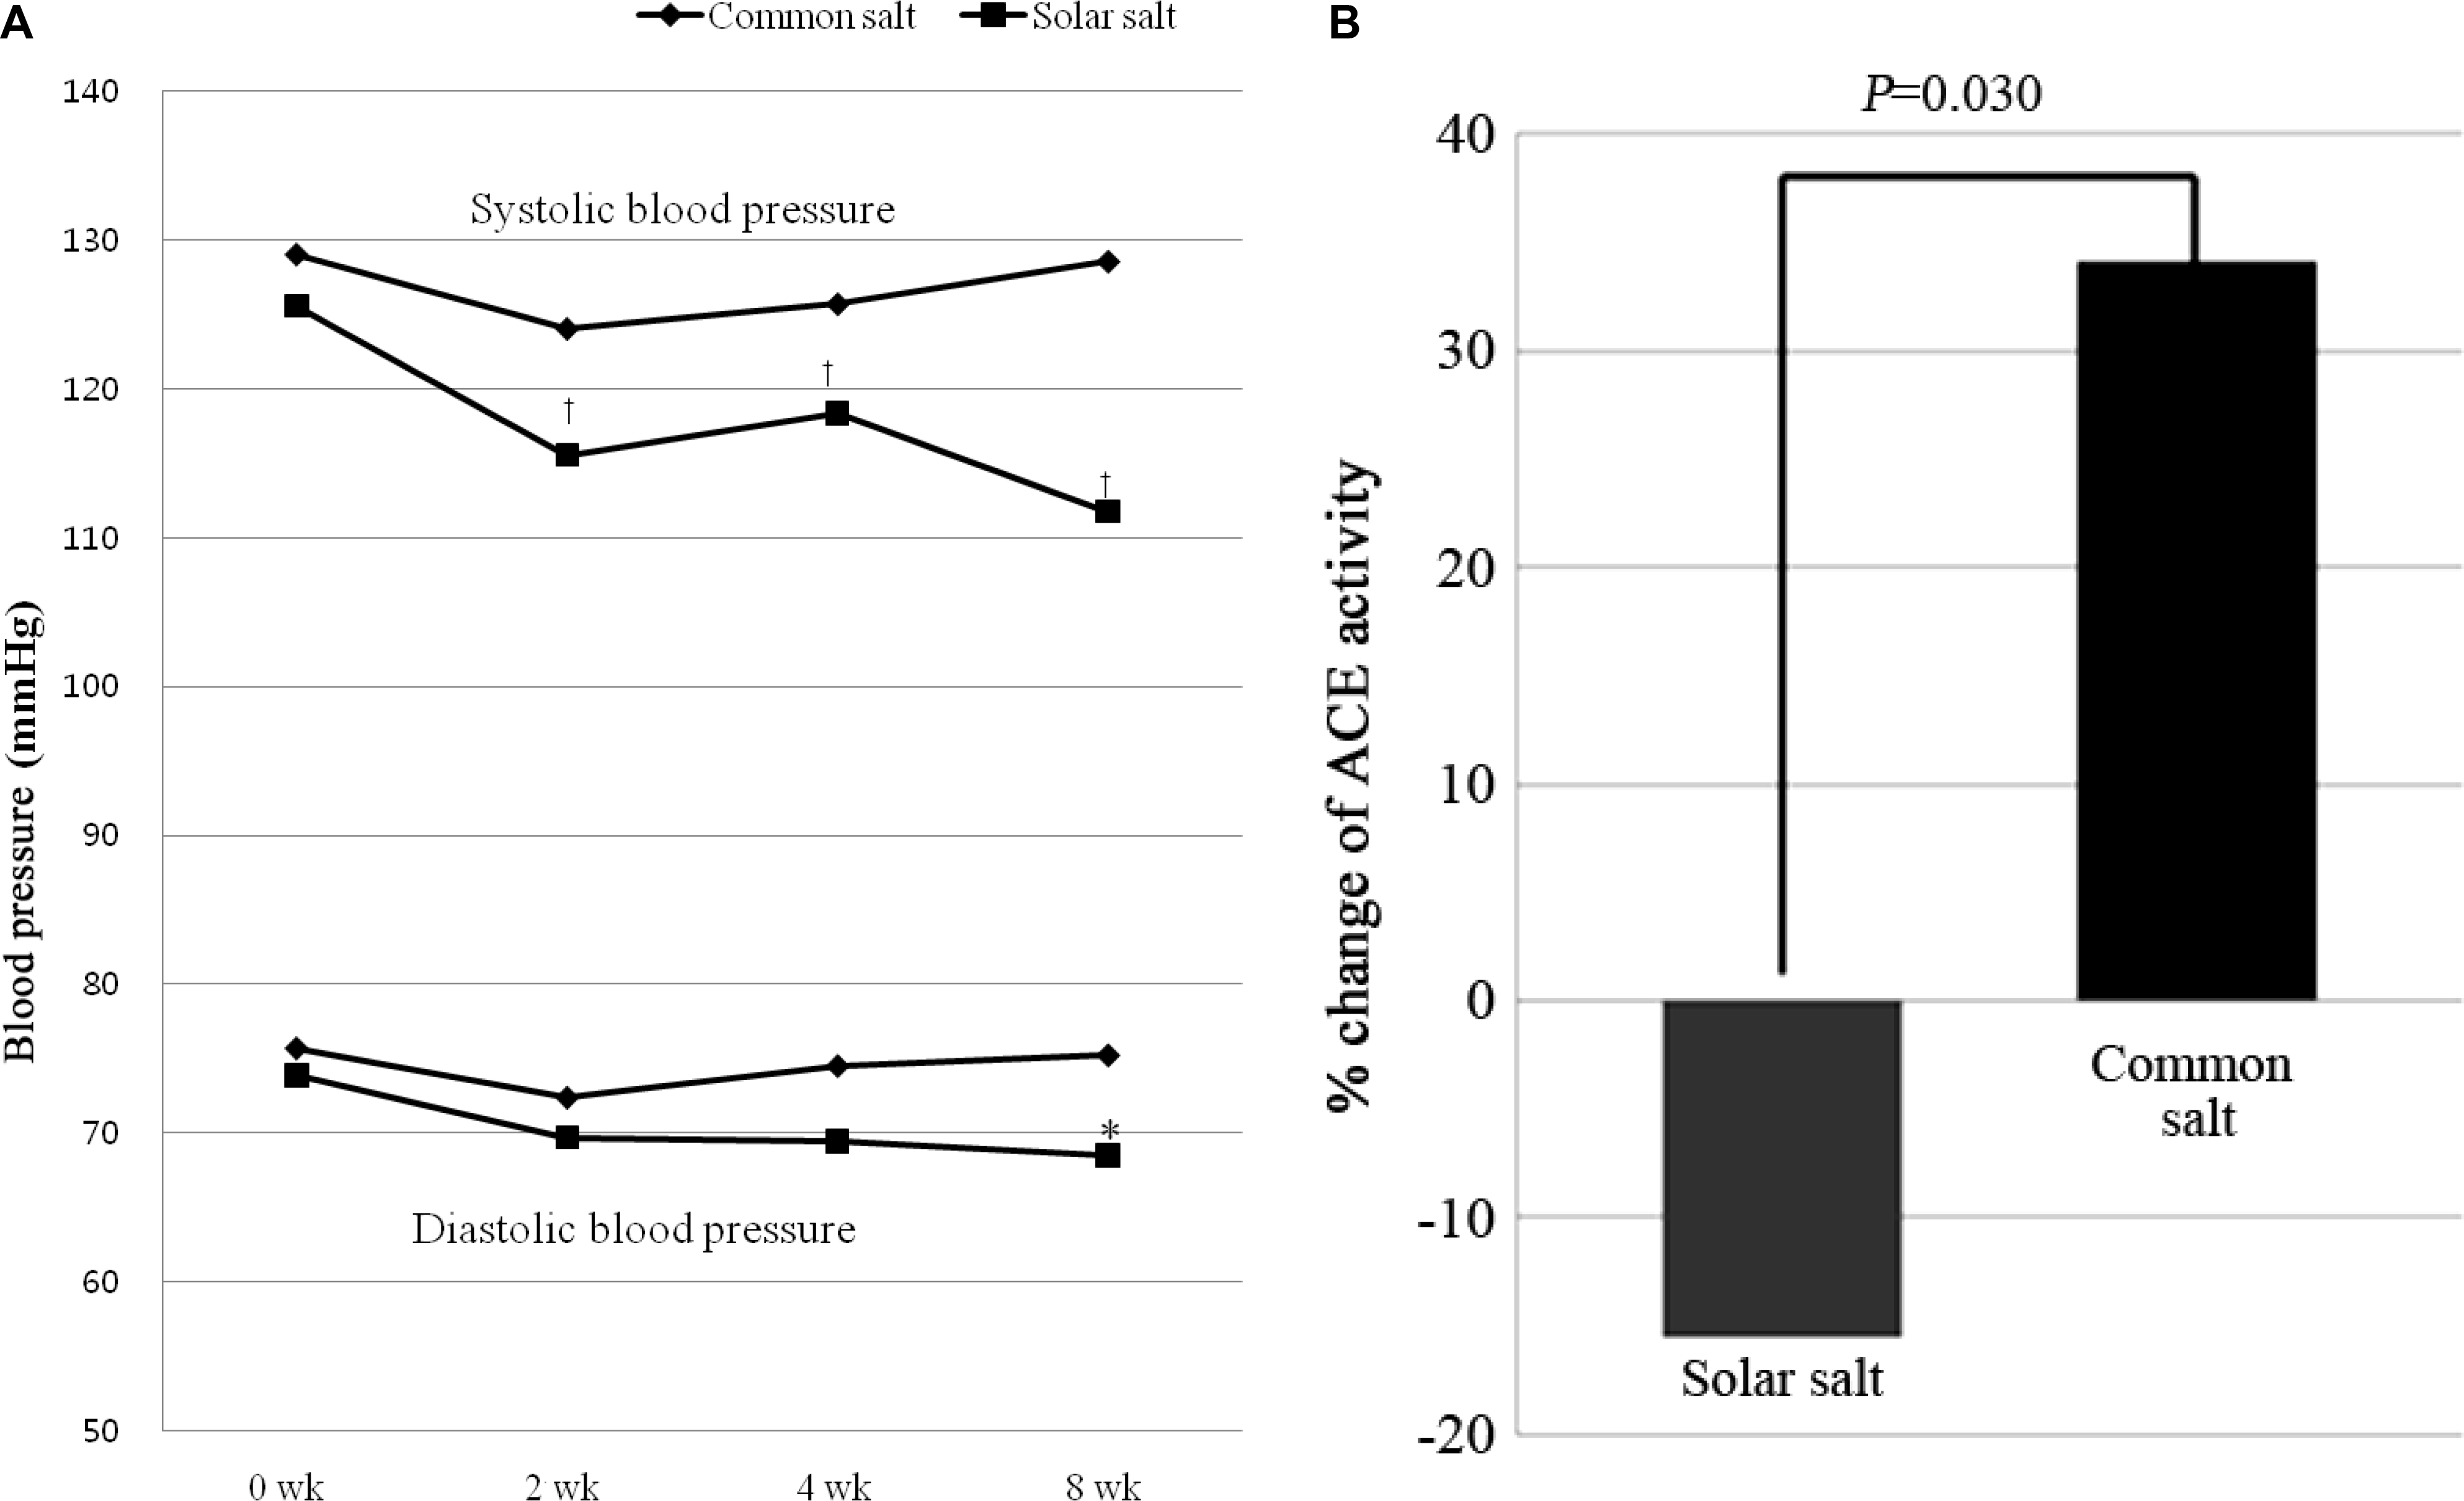
Systolic BP decreased significantly in the solar salt-based diet group after 2, 4, and 8 weeks when compared to the refined salt-based diet group. And, diastolic BP was lowered significantly in the solar salt-based diet group compared to that in the refined salt-based diet group after 8 weeks. In addition, urinary sodium/po-tassium, and angiotension converting enzyme activity decreased significantly in the solar salt-based diet group compared to the refined salt-based group. Urinary potassium excretion was significantly increased in the solar salt-based diet group.
Conclusions
These results may provide clinical evidence that solar salt has beneficial effects on BP in elderly patients. And, people such as Koreans, who do not consume enough minerals, may experience a greater anti-hypotensive effect by using solar salt. However, further large-scale studies are necessary.
REFERENCES
1.Fields LE., Burt VL., Cutler JA., Hughes J., Roccella EJ., Sorlie P. The burden of adult hypertension in the United States 1999 to 2000: a rising tide. Hypertension. 2004. 44(4):398–404.
2.McCarty CA., Berg RL., Rottscheit CM., Dart RA. The use of dietary supplements and their association with blood pressure in a large Midwestern cohort. BMC Complement Altern Med. 2013. 13:339.

3.Safar ME., Temmar M., Kakou A., Lacolley P., Thornton SN. Sodium intake and vascular stiffness in hypertension. Hypertension. 2009. 54(2):203–9.

4.Hu G., Jousilahti P., Peltonen M., Lindström J., Tuomilehto J. Urinary sodium and potassium excretion and the risk of type 2 diabetes: a prospective study in Finland. Diabetologia. 2005. 48(8):1477–83.

5.He FJ., MacGregor GA. A comprehensive review on salt and health and current experience of worldwide salt reduction programmes. J Hum Hypertens. 2009. 23(6):363–84.

6.Meneton P., Jeunemaitre X., de Wardener HE., MacGregor GA. Links between dietary salt intake, renal salt handling, blood pressure, and cardiovascular diseases. Physiol Rev. 2005. 85(2):679–715.

7.Houston M. The role of magnesium in hypertension and cardiovascular disease. J Clin Hypertens (Greenwich). 2011. 13(11):843–7.

8.Sacks FM., Svetkey LP., Vollmer WM., Appel LJ., Bray GA., Harsha D, et al. Effects on blood pressure of reduced dietary sodium and the Dietary Approaches to Stop Hypertension (DASH) diet. DASH-Sodium Collaborative Research Group. N Engl J Med. 2001. 344(1):3–10.
9.Gilleran G., O'Leary M., Bartlett WA., Vinall H., Jones AF., Dodson PM. Effects of dietary sodium substitution with potassium and magnesium in hypertensive type II diabetics: a randomised blind controlled parallel study. J Hum Hypertens. 1996. 10(8):517–21.
10.Geleijnse JM., Witteman JC., Bak AA., den Breeijen JH., Grobbee DE. Reduction in blood pressure with a low sodium, high potassium, high magnesium salt in older subjects with mild to moderate hypertension. BMJ. 1994. 309(6952):436–40.

11.China Salt Substitute Study Collaborative Group. Salt substitution: a low-cost strategy for blood pressure control among rural Chinese. A randomized, controlled trial. J Hypertens. 2007. 25(10):2011–8.
12.Sarkkinen ES., Kastarinen MJ., Niskanen TH., Karjalainen PH., Venäläinen TM., Udani JK, et al. Feasibility and antihypertensive effect of replacing regular salt with mineral salt -rich in magnesium and potassium- in subjects with mildly elevated blood pressure. Nutr J. 2011. 10:88.

13.Lee KD., Park JW., Choi CR., Song HW., Yun SK., Yang HC, et al. Salinity and heavy metal contents of solar salts produced in Jeollanamdo province of Korea. J Korean Soc Food Sci Nutr. 2007. 36:753–8.

14.Chobanian AV., Bakris GL., Black HR., Cushman WC., Green LA., Izzo JL Jr, et al. Joint National Committee on Prevention, Detection, Evaluation, and Treatment of High Blood Pressure. National Heart, Lung, and Blood Institute; National High Blood Pressure Education Program Coordinating Committee. Seventh report of the Joint National Committee on Prevention, Detection, Evaluation, and Treatment of High Blood Pressure. Hypertension. 2003. 42(6):1206–52.
15.Paik HY. Dietary Reference Intakes for Koreans (KDRIs). Asia Pac J Clin Nutr. 2008. 17(Suppl 2):416–9.
16.Korean Ministry of Health, Welfare, and Family Affairs & Korea Centers for Disease Control and Prevention. The Korean National Health and Nutrition Examination Survey - KNHANES IV (2007). Seoul. 2008. [Accessed December 12, 2014].http://knhanes.cdc.go.kr.
Figure 2.
(A) Changes in systolic and diastolic blood pressures with intake of solar or refined salt over eight weeks. P-values were calculated using Wilcoxon rank sum test and Wilcoxon signed rank test. (B) The rate of change in ACE activity with intake of solar (least square mean [SE]: -15.45 [16.13]) or refined salt (least square mean [SE]: 34.09 [14.82]) before and after the study. P-values were calculated using ANCOVA. ACE, angiotensin converting enzyme; SE, standard error.

Table 1.
Clinical characteristics of the subjects at baseline
| Solar salt (n=18) | Refined salt (n=20) | Pa | |
|---|---|---|---|
| Age, y | 79.5 (75-88)b | 80.0 (77-84)b | 0.520 |
| Body mass index, kg/m2 | 24.4 (19.9-25.8)b | 23.8 (19.2-25.3)b | 0.270 |
| Sex | 0.170 | ||
| Male | 9 (64.29)c | 5 (25.00)c | |
| Female | 9 (36.00)c | 15 (75.00)c | |
| Blood pressure, mmHg | |||
| Systolic | 127.5 (121-140)b | 129.0 (122-136)b | 0.300 |
| Diastolic | 74.0 (70-94)b | 76.0 (70-88)b | 0.610 |
| Pulse rate, beat/min | 75 (70-82)b | 72 (69-78)b | 0.250 |
| Geriatric functional assessment, score | |||
| MMSE-K | 21 (13-23)b | 20 (12-23)b | 0.380 |
| K-ADL | 4.0 (2-7)b | 4.0 (1-8)b | 0.610 |
| S-IADL | 29.5 (20.0-38)b | 32 (30-38)b | 0.470 |
| GDS | 4.0 (3-5)b | 5.0 (4-5)b | 0.440 |
| Antihypertensive medication | 13 (72.2)c | 14 (66.6)c | 0.980 |
| Diuretics | 2 (15.38)c | 1 (7.14)c | |
| Calcium channel blockers | 12 (92.31)c | 13 (92.86)c | |
| ACE inhibitors or ARBs | 8 (61.54)c | 6 (42.86)c | |
| Beta-blockers | 2 (15.38)c | 3 (21.43)c | |
| Medical history | |||
| Cardiovascular diseased | 8 (44.44)c | 9 (42.86)c | 0.990 |
| Diabetes mellitus | 8 (44.44)c | 6 (28.57)c | 0.760 |
| Dyslipidemia | 2 (11.11)c | 1 (4.76)c | 0.590 |
| Dementia | 6 (33.33)c | 7 (33.33)c | 1.000 |
| Osteoporosis | 3 (16.67)c | 7 (33.33)c | 0.290 |
Table 2.
Changes in nutrient intake by the w weighing method after 8 weeks
| Solar salt (n=18) | Pa | Refined salt (n=20) | Pa | |||
|---|---|---|---|---|---|---|
| Pre (baseline) | Post (8 wk) | Pre (baseline) | Post (8 wk) | |||
| Calorie intake, kcal | 1,299.06 | 1,324.52 | 0.770 | 1,271.91 | 1,355.25 | 0.120 |
| (1,142.71-1,729.12)b | (1,011.63-1,732.43)b | (1,044.55-1,503.03)b | (1,178.77-1,475.32)b | |||
| Protein, % energy | 16.61 (15.27-18.87)b | 16.48 (14.53-17.78)b | 0.770 | 17.94 (16.24-19.70)b | 17.01 (16.15-17.62)b | 0.160 |
| Fat, % energy | 19.92 (15.20-22.37)b | 20.87 (14.97-23.08)b | 0.090 | 20.60 (19.41-23.85)b | 22.00 (18.87-23.03)b | 0.930 |
| Carbohydrate, % energ | gy 63.14 (58.72-69.44)b | 62.65 (58.81-70.36)b | 0.640 | 62.30 (55.77-63.82)b | 60.97 (58.90-64.98)b | 0.650 |
Table 3.
Changes in study outcomes of solar- or refined salt-based diet after 8 weeksa
| Solar salt (n=18) | Refined salt (n=20) | |||||
|---|---|---|---|---|---|---|
| Pre (baseline) | Post (8 wk) | Pb | Pre (baseline) | Post (8 wk) | Pb | |
| Body mass index | 24.4 (19.9-25.8) | 24.8 (19.8-26.0) | 0.820 | 23.8 (19.2-25.3) | 23.9 (19.5-25.8) | 0.750 |
| Blood pressure, mmHg | ||||||
| Systolicc | 127.5 (121-140) | 110 (102-120) | 0.007 | 129.0 (122-136) | 128.5 (120-136) | 0.930 |
| Diastolic | 74.0 (70-94) | 69.0 (66-74) | 0.090 | 76.0 (70-88) | 78 (72-88) | 0.930 |
| Pulse rate, beat/min | 75 (70-82) | 77 (70-82) | 0.720 | 72 (69-78) | 72 (69-76) | 0.830 |
| Antihypertensive medication | 13 (72.2) | 10 (55.6) | 0.300 | 14 (70.0) | 15 (75.0) | 0.730 |
| Glucose tolerance index | ||||||
| Fasting glucose, mg/dL | 95.0 (90-110) | 93.5 (86.0-131.0) | 0.770 | 90.5 (83.0-97.5) | 90.0 (82.0-100.0) | 0.410 |
| Fasting insulin, μIU/mL | 9.24 (6.22-12.79) | 8.18 (6.54-11.72) | 0.310 | 9.20 (6.77-12.24) | 9.40 (6.74-11.74) | 0.900 |
| HOMA-IR Lipid profile | 2.30 (1.35-3.32) | 2.33 (1.43-3.93) | 0.280 | 2.25 (1.79-3.04) | 2.27 (1.82-3.42) | 0.900 |
| Total cholesterol, mg/dL | 184 (156-221) | 166 (132-201) | 0.080 | 169 (158.5-201.5) | 164 (143-194) | 0.620 |
| Triglyceride, mg/dL | 142.5 (11.20-220.0) | 141 (105-270) | 0.920 | 135.5 (101.5-157.5) | 116 (101-156) | 0.230 |
| HDL-cholesterol, mg/dL | 34.6 (32.0-43.1) | 36.55 (32.60-43.75) | 0.670 | 33.45 (30.60-45.70) | 34.0 (32.0-46.3) | 0.170 |
| Renal function test | ||||||
| Blood urea nitrogen, mg/dL | 14.5 (10.3-16.2) | 12.85 (11.00-15.25) | 0.920 | 13.45 (10.10-18.40) | 12.47 (10.90-15.80) | 0.860 |
| Creatinine, mg/dL Electrolyte | 0.9 (0.8-1.3) | 0.8 (0.7-1.25) | 0.530 | 0.9 (0.8-1.0) | 0.9 (0.8-1.0) | 0.780 |
| Serum sodium, mEq/L | 138 (138-140) | 138.5 (136.0-142) | 0.530 | 137.5 (136.0-140) | 140 (136-142) | 0.110 |
| Serum potassium, mEq/L | 4.2 (4.0-4.5) | 4.45 (3.80-4.60) | 0.030 | 4.00 (3.80-4.35) | 4.05 (3.80-4.20) | 0.320 |
| Urinary sodium, mEq/L | 80 (57-109) | 94 (46-121) | 0.890 | 88 (54-118) | 86.5 (49.0-120) | 0.460 |
| Urinary potassiumc, mEq/L | 30 (24-32.5) | 36.5 (30.5-49) | 0.008 | 25.5 (17-38) | 23.5 (14.5-36.5) | 0.340 |
| Urinary sodium/potassiumc | 2.34 (1.97-3.64) | 2.07 (1.25-3.21) | 0.040 | 2.67 (2.20-4.59) | 3.44 (2.47-4.39) | 0.520 |


 PDF
PDF ePub
ePub Citation
 Print
Print


 XML Download