

 PDF
PDF ePub
ePub Citation
 Print
Print


Abstract
Background
Gallstones are associated with insulin resistance but the relation between gallstone disease and the risk of developing diabetes mellitus (DM) is unclear. We examined if gallstones are associated with an increased incidence of DM compared to no gallstones.
Methods
A cohort study was performed in 41,518 Koreans aged 30-59 without DM, who underwent a health checkup during 2005-2006 and then were followed annually or biennially until December 2011. Throughout the study period, gallstones were defined as ultrasound-documented gallstones by standard criteria and DM was defined as fasting serum glucose ≥7.0 mmol l-1, A1c ≥6.5%, or use of DM medications.
Results
During 192999 person-years of follow-up, 2,232 participants developed DM (incidence rate 11.6 per 1,000 person-years). The incidence of DM was higher in subjects with gallstones or cholecystectomy than in those without gallstones for women but not for men. In multivariate-adjusted models, the hazard ratios (95% confidence intervals) for DM comparing gallstones and cholecystectomy vs. no gallstones were 0.95 (0.63-1.42) and 1.13 (0.53-2.38), respectively, in men and 1.64 (1.13-2.40) and 2.04 (1.01-4.11), respectively, in women. These associations did not differ significantly between relevant subgroups.
Go to : 
REFERENCES
1.Shaffer EA. Epidemiology and risk factors for gallstone disease: has the paradigm changed in the 21st century? Curr Gastroen-terol Rep. 2005. 7(2):132–40.

2.Everhart JE., Ruhl CE. Burden of digestive diseases in the United States Part III: Liver, biliary tract, and pancreas. Gastroenterology. 2009. 136(4):1134–44.
3.Mendez-Sanchez N., Bahena-Aponte J., Chavez-Tapia NC., Motola-Kuba D., Sanchez-Lara K., Ponciano-Radriguez G, et al. Strong association between gallstones and cardiovascular disease. Am J Gastroenterol. 2005. 100(4):827–30.
4.Grimaldi CH., Nelson RG., Pettitt DJ., Sampliner RE., Bennett PH., Knowler WC. Increased mortality with gallstone disease: results of a 20-year population-based survey in Pima Indians. Ann Intern Med. 1993. 118(3):185–90.
5.Ruhl CE., Everhart JE. Gallstone disease is associated with increased mortality in the United States. Gastroenterology. 2011. 140(2):508–16.
6.Biddinger SB., Haas JT., Yu BB., Bezy O., Jing E., Zhang W, et al. Hepatic insulin resistance directly promotes formation of cholesterol gallstones. Nat Med. 2008. 14(7):778–82.
7.Nervi F., Miquel JF., Alvarez M., Ferreccio C., García-Zattera MJ., González R, et al. Gallbladder disease is associated with insulin resistance in a high risk Hispanic population. J Hepatol. 2006. 45(2):299–305.
8.Chang Y., Sung E., Ryu S., Park YW., Jang YM., Park M. Insulin resistance is associated with gallstones even in non-obese, nondiabetic Korean men. J Korean Med Sci. 2008. 23(4):644–50.
9.Hendel HW., Hojgaard L., Andersen T., Pedersen BH., Paloheimo LI., Rehfeld JF, et al. Fasting gall bladder volume and lith- ogenicity in relation to glucose tolerance, total and intra-abdominal fat masses in obese non-diabetic subjects. Int J Obes Relat Metab Disord. 1998. 22(4):294–302.
10.Weikert C., Weikert S., Schulze MB., Pischon T., Fritsche A., Bergmann MM, et al. Presence of gallstones or kidney stones and risk of type 2 diabetes. Am J Epidemiol. 2010. 171(4):447–54.
11.Portincasa P., Moschetta A., Palasciano G. Cholesterol gallstone disease. Lancet. 2006. 368(9531):230–9.
12.Stinton LM., Shaffer EA. Epidemiology of gallbladder disease: cholelithiasis and cancer. Gut Liver. 2012. 6(2):172–87.
13.Everhart JE., Khare M., Hill M., Maurer KR. Prevalence and ethnic differences in gallbladder disease in the United States. Gastroenterology. 1999. 117(3):632–9.
14.Mathiesen UL., Franzen LE., Aselius H., Resjo M., Jacobsson L., Foberg U, et al. Increased liver echogenicity at ultrasound examination reflects degree of steatosis but not of fibrosis in asymptomatic patients with mild/moderate abnormalities of liver transaminases. Dig Liver Dis. 2002. 34(7):516–22.
15.Ryu S., Chang Y., Kim SG., Cho J., Guallar E. Serum uric acid levels predict incident nonalcoholic fatty liver disease in healthy Korean men. Metabolism. 2011. 60(6):860–6.
16.Royston P., Parmar MK. Flexible parametric proportional-hazards and proportional-odds models for censored survival data, with application to prognostic modelling and estimation of treatment effects. Stat Med. 2002. 21(15):2175–97.
17.Matthews DR., Hosker JP., Rudenski AS., Naylor BA., Treacher DF., Turner RC. Homeostasis model assessment: insulin resistance and beta-cell function from fasting plasma glucose and insulin concentrations in man. Diabetologia. 1985. 28(7):412–9.
18.Ruhl CE., Everhart JE. Association of diabetes, serum insulin, and C-peptide with gallbladder disease. Hepatology. 2000. 31(2):299–303.
19.American Diabetes Association. Diagnosis and classification of diabetes mellitus. Diabetes Care. 2010. 33(Suppl 1):S62–9.
20.Schafmayer C., Hartleb J., Tepel J., Albers S., Freitag S., Volzke H, et al. Predictors of gallstone composition in 1025 symptomatic gallstones from Northern Germany. BMC Gastroenterol. 2006. 6:36.
21.Stinton LM., Myers RP., Shaffer EA. Epidemiology of gallstones. Gastroenterol Clin North Am. 2010. 39(2):157–69. vii.
22.Ranelletti FO., Piantelli M., Farinon AM., Zanella E., Capelli A. Estrogen and progesterone receptors in the gallbladders from patients with gallstones. Hepatology. 1991. 14(4 Pt 1):608–12.
23.Bennion LJ., Grundy SM. Effects of obesity and caloric intake on biliary lipid metabolism in man. J Clin Invest. 1975. 56(4):996–1011.
24.Wang SN., Yeh YT., Yu ML., Wang CL., Lee KT. Serum adiponectin levels in cholesterol and pigment cholelithiasis. Br J Surg. 2006. 93(8):981–6.
25.Yoo EH., Lee SY. The prevalence and risk factors for gallstone disease. Clin Chem Lab Med. 2009. 47(7):795–807.
26.Shaffer EA. Gallstone disease: Epidemiology of gallbladder stone disease. Best Pract Res Clin Gastroenterol. 2006. 20(6):981–96.
27.Twisk J., Hoekman MF., Lehmann EM., Meijer P., Mager WH., Princen HM. Insulin suppresses bile acid synthesis in cultured rat hepatocytes by down-regulation of cholesterol 7 alpha-hydroxylase and sterol 27-hydroxylase gene transcription. Hepatology. 1995. 21(2):501–10.
28.Misciagna G., Guerra V., Di Leo A., Correale M., Trevisan M. Insulin and gall stones: a population case control study in southern Italy. Gut. 2000. 47(1):144–7.
29.Bonora E., Tuomilehto J. The pros and cons of diagnosing diabetes with A1C. Diabetes Care. 2011. 34(Suppl 2):S184–90.
30.Huffman JL., Schenker S. Acute acalculous cholecystitis: a review. Clin Gastroenterol Hepatol. 2010. 8(1):15–22.
Go to :
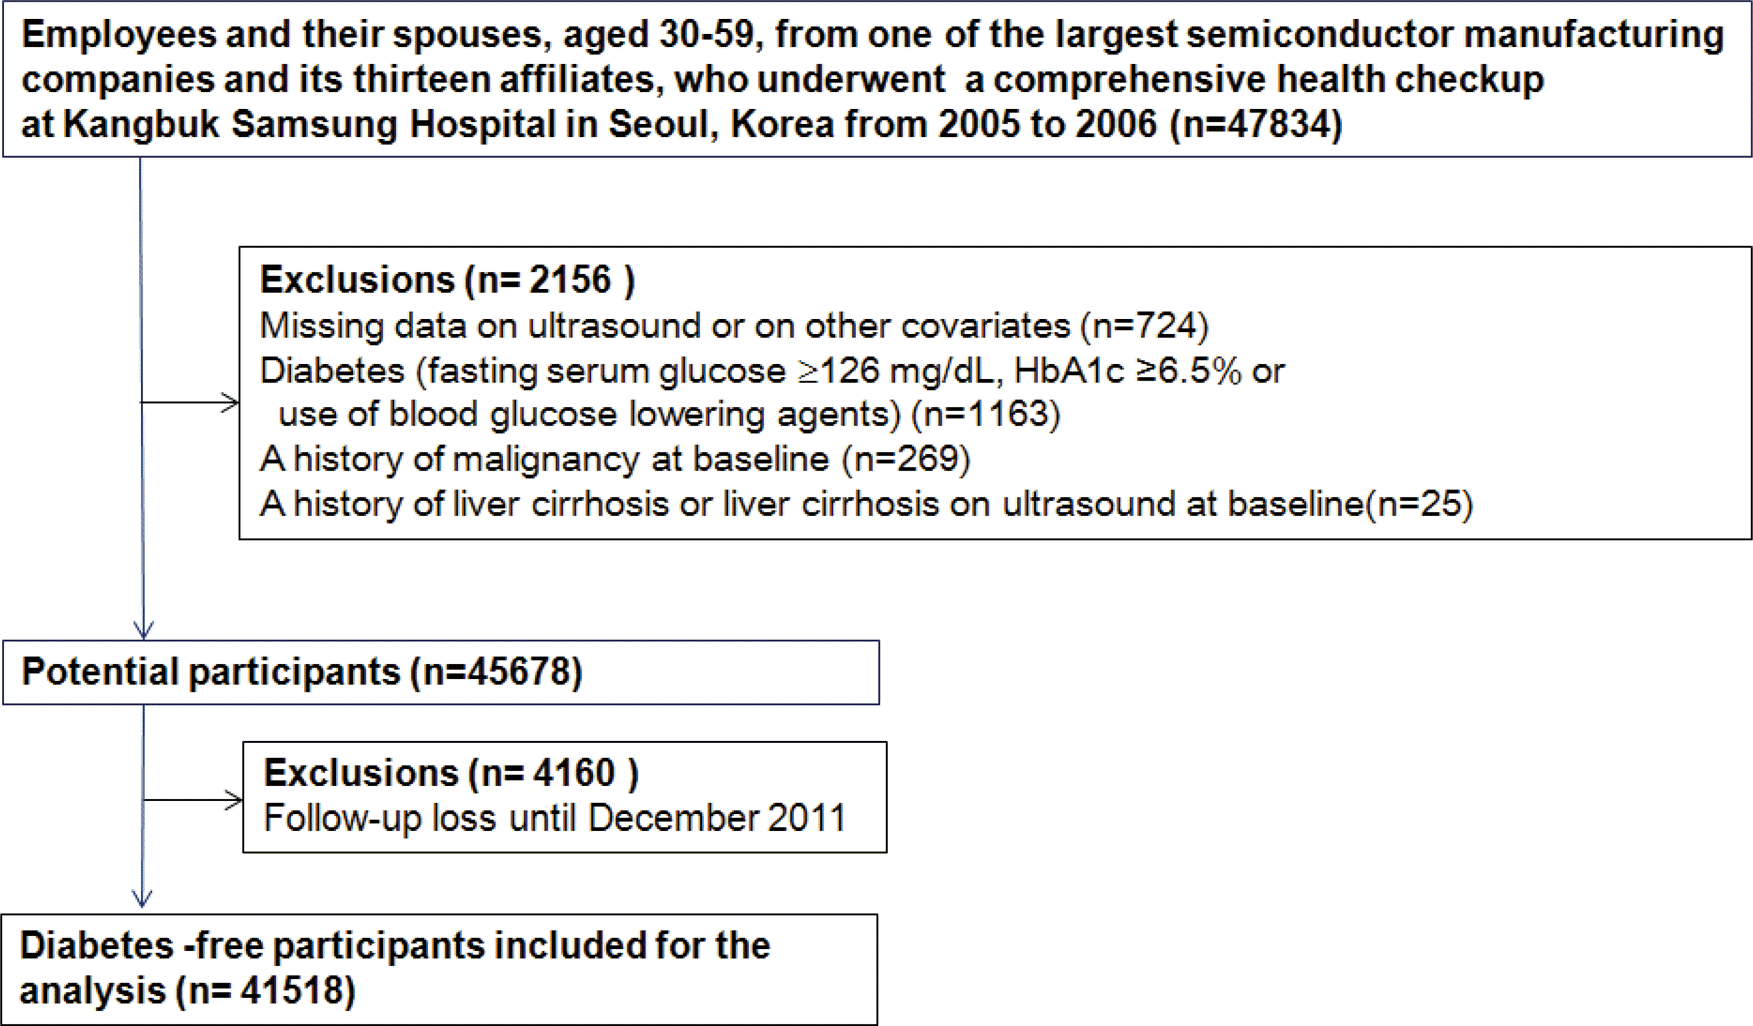
Table 1.
Baseline characteristics of study population according to gallstone diseases (GSD)
| Characteristics | Men | P value | Women | P valued | ||
|---|---|---|---|---|---|---|
| No GSD | GSD | No GSD | GSD | |||
| Number | 26,057 | 498 | 14,587 | 376 | ||
| Age, ya | 37.0 (4.6) | 38.3 (4.9) | <0.001 | 36.4 (4.2) | 37.5 (4.4) | <0.001 |
| BMI, kg m-2a | 24.3 (2.8) | 24.9 (3.1) | <0.001 | 21.7 (2.7) | 22.8 (3.3) | <0.001 |
| Current smoke, % | 48.1 | 45.0 | 0.171 | 2.2 | 2.7 | 0.505 |
| Alcohol intake, %c | 43.1 | 37.6 | 0.014 | 9.4 | 9.6 | 0.930 |
| Regular exercise, %c | 45.9 | 47.2 | 0.554 | 35.3 | 39.1 | 0.125 |
| Obesity, % | 38.9 | 45.8 | 0.002 | 11.0 | 23.9 | <0.001 |
| Hypertension, % | 11.9 | 14.1 | 0.150 | 2.7 | 5.1 | 0.005 |
| Metabolic syndrome, % | 17.7 | 21.7 | 0.021 | 3.9 | 8.0 | <0.001 |
| Fatty liver on ultrasound,% | 37.8 | 44.8 | 0.001 | 6.8 | 15.7 | <0.001 |
| Systolic BP, mmHga | 115.9 (12.4) | 116.4 (12.0) | 0.446 | 105.9 (11.2) | 108.9 (11.9) | <0.001 |
| Diastolic BP, mmHga | 75.3 (8.7) | 76.4 (8.7) | 0.006 | 67.3 (7.9) | 69.1 (8.3) | <0.001 |
| Glucose, mmol l-1a | 5.2 (0.4) | 5.3 (0.5) | 0.028 | 5.0 (0.4) | 5.1 (0.4) | <0.001 |
| HbA1c, % | 5.3 (0.3) | 5.4 (0.3) | 0.880 | 5.4 (0.3) | 5.4 (0.3) | 0.283 |
| Total cholesterol, mmol l-1a | 5.0 (0.8) | 4.9 (0.9) | 0.159 | 4.6 (0.8) | 4.6 (0.8) | 0.733 |
| LDL-C, mmol l-1a | 2.9 (0.7) | 2.9 (0.8) | 0.415 | 2.5 (6.4) | 2.6 (0.7) | 0.283 |
| HDL-C, mmol l-1a | 1.3 (0.3) | 1.3 (0.2) | 0.001 | 1.5 (0.3) | 1.5 (0.3) | 0.004 |
| Uric acid, μmol l-1a | 370.0 (70.2) | 371.2 (71.4) | 0.758 | 245.7 (49.4) | 249.8 (48.8) | 0.137 |
| Triglycerides, mmol l-1b | 1.4 (1.0-2.0) | 1.4 (1.0-1.9) | 0.271 | 0.9 (0.7-1.2) | 0.9 (0.7-1.3) | 0.027 |
| AST, U l-1b | 24 (20-29) | 25 (20-29) | 0.310 | 20 (17-23) | 20 (17-24) | 0.808 |
| ALT, U l-1b | 26 (19-37) | 27 (19-39) | 0.011 | 16 (13-20) | 16 (13-21) | 0.622 |
| GGT, U l-1b | 27 (18-44) | 29.5 (20-55) | 0.049 | 11 (8-15) | 12 (9-17) | <0.001 |
| hsCRP, mg l-1b | 0.50 (0.30-1.10) | 0.60 (0.30-1.40) | 0.007 | 0.30 (0.20-0.70) | 0.40 (0.20-1.00) | 0.903 |
| HOMA-IRb | 1.98 (1.58-2.55) | 2.15 (1.67-2.80) | <0.001 | 1.79 (1.45-2.28) | 1.95 (1.57-2.63) | <0.001 |
Abbreviations: ALT, alanine aminotransferase; AST, aspartate aminotransferase; BMI, body mass index; BP, blood pressure; GGT, 약어풀이; HDL-C, high-density lipoprotein-cholesterol; hsCRP, high sensitivity C-reactive protein; HOMA-IR, homeostasis model assessment of insulin resistance. LDL-C, low-density lipoprotein cholesterol. Data are
Table 2.
Development of type 2 diabetes according to gallstone diseases (GSD)
| Number | Person-years | Incident case | Incidence density (1000 person-year) | Age-adjusted HR (95% CI) | Multivariate HRa (95% CI) | HR (95% CI)b in the model using time-dependent variables | ||
|---|---|---|---|---|---|---|---|---|
| Model 1 | Model 2 | |||||||
| Men | 26,555 | |||||||
| No GSD | 26,057 | 122,403.3 | 1,343 | 11.0 | 1.00 (reference) | 1.00 (reference) | 1.00 (reference) | 1.00 (reference) |
| GSD | 498 | 2,377.1 | 31 | 13.0 | 1.10 (0.77-1.58) | 0.97 (0.68-1.38) | 0.98 (0.69-1.40) | 0.88 (0.63-1.23) |
| Gallstone | 406 | 1,945.6 | 24 | 12.3 | 1.06 (0.71-1.59) | 0.96 (0.64-1.44) | 0.95 (0.63-1.42) | 0.88 (0.60-1.29) |
| Cholecystectomy | 92 | 431.5 | 7 | 16.2 | 1.26 (0.60-2.65) | 0.98 (0.46-2.07) | 1.13 (0.53-2.38) | 0.87 (0.43-1.77) |
| P for trend | 0.520 | 0.866 | 0.975 | 0.456 | ||||
| Women | 14,963 | |||||||
| No GSD | 14,587 | 66,578.6 | 821 | 12.3 | 1.00 (reference) | 1.00 (reference) | 1.00 (reference) | 1.00 (reference) |
| GSD | 376 | 1,640.3 | 37 | 22.6 | 1.88 (1.35-2.62) | 1.66 (1.14-2.42) | 1.74 (1.24-2.43) | 1.73 (1.24-2.42) |
| Gallstone | 300 | 1,312.2 | 29 | 22.1 | 1.83 (1.26-2.64) | 1.66 (1.14-2.42) | 1.64 (1.13-2.40) | 1.67 (1.14-2.44) |
| Cholecystectomy | 76 | 328.1 | 8 | 24.4 | 2.14 (1.06-4.29) | 2.08 (1.03-4.18) | 2.04 (1.01-4.11) | 2.00 (1.003-3.97) |
| P for trend | <0.001 | 0.001 | 0.001 | 0.001 | ||||
| P for interaction by gender | 0.124 | 0.202 | 0.236 | 0.202 | ||||
 XML Download