Journal List > Korean J Health Promot > v.14(3) > 1089827

Nam and Yoon: Depressive Symptom Trajectories and Associated Risks among Korean Elderly

Abstract

Background

Recent studies conducting changes in depressive symptoms among the elderly reported mixed results. The present study sought to determine if subgroups of elderly Koreans follow distinctive depressive symptom trajectories and the characteristics associated with the depressive symptom trajectories.

Methods

Subjects were those who had participated in a longitudinal study of quality of life in older adults. A latent class mixture model was examined to identify the trajectories of depressive symptom changes with time.

Results

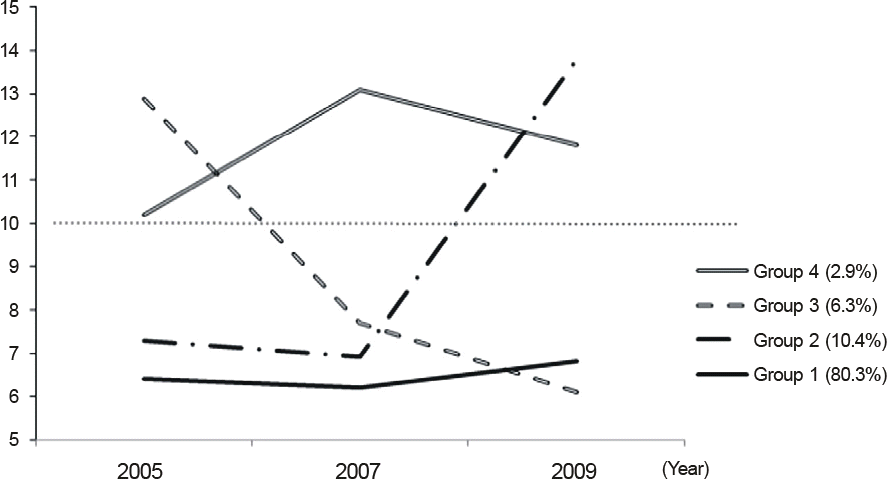
We found four depressive symptom trajectories. Poorer health status, poor economic status, and less social support were risk factors in the high depression group.

Conclusions

Early intervention to help elderly individuals manage their health, economic concerns, and social relationships may decrease the risk of high level depression.

References

1. Lee HJ. Longitudinal changes in depression in older adults: differences across age groups and risk factors. J Welfare Aged. 2013; 61:291–318.
2. Harris AH, Cronkite R, Moos R. Physical activity, exercise coping, and depression in a 10-year cohort study of depressed patients. J Affect Disord. 2006; 93(1–3):79–85.
crossref
3. Kim J, Pai M. Volunteering and trajectories of depression. J Aging Heal. 2010; 22(1):84–105.
crossref
4. Spence NJ, Adkins DE, Dupre ME. Racial differences in depression Trajectories among older women: socioeconomic, family, and health influences. J Health Soc Behav. 2011; 52(4):444–59.
5. Jeon HS, Kahng SK. Predictors of depression trajectory among the elderly: using the Korean welfare panel data. J Korean Gerontol Soc. 2009; 29(4):1611–28.
6. Chiao C, Weng LJ, Botticello AL. Social participation reduces depressive symptoms among older adults: an 18-year longitudinal analysis in Taiwan. BMC Public Health. 2011 May 10; 11:292.
crossref
7. Hong SI, Hasche L, Bowland S. Structural relationships between social activities and longitudinal trajectories of depression among older adults. Gerontologist. 2009; 49(1):1–11.
crossref
8. Jeon HS, Dunkle RE. Stress and depression among the old-est-old: a longitudinal analysis. Res Aging. 2009; 31(6):661–87.
crossref
9. Lynch SM, George LK. Interlocking trajectories of loss-related events and depressive symptoms among elders. J Gerontol B Psychol Sci Soc Sci. 2002; 57(2):S117–25.
crossref
10. Nagin DS. Analyzing developmental trajectories: a semiparametric, group-based approach. Psychol Methods. 1999; 4(2):139–57.
crossref
11. Galatzer-Levy IR, Bonanno GA. Beyond normality in the study of bereavement: heterogeneity in depression outcomes following loss in older adults. Soc Sci Med. 2012; 74(12):1987–94.
crossref
12. Judd CM, McClelland GH, Ryan CS. Data Analysis: A Model Comparison Approach. 2nd ed. New York, NY:Rutledge;2009.
13. Radloff LS. The CES-D Scale: a self-report depression scale for research in the general population. Appl Psychol Meas. 1977; 1(3):385–401.
14. Jones BL, Nagin DS, Roeder K. A SAS procedure based on mixture models for estimating developmental trajectories. Sociol Methods Res. 2001; 29(3):374–93.
crossref
15. Andreescu C, Chang CC, Mulsant BH, Ganguli M. Twelve-year depressive symptom trajectories and their predictors in a community sample of older adults. Int Psychogeriatr. 2008; 20(2):221–36.
crossref
16. Byers AL, Vittinghoff E, Lui LY, Hoang T, Blazer DG, Covinsky KE, et al. Twenty-year depressive trajectories among older women. Arch Gen Psychiatry. 2012; 69(10):1073–9.
crossref
17. Kuchibhatla MN, Fillenbaum GG, Hybels CF, Blazer DG. Trajectory classes of depressive symptoms in a community sample of older adults. Acta Psychiatr Scand. 2012; 125(6):492–501.
crossref
18. Murphy BM, Elliott PC, Worcester MU, Higgins RO, Le Grande MR, Roberts SB, et al. Trajectories and predictors of anxiety and depression in women during the 12 months following an acute cardiac event. Br J Health Psychol. 2008; 13(Pt 1):135–53.
crossref
19. Taylor DH Jr, Ezell M, Kuchibhatla M, Østbye T, Clipp EC. Identifying trajectories of depressive symptoms for women caring for their husbands with dementia. J AM Geriatr Soc. 2008; 56(2):322–7.
crossref
20. Kim DB, Sohn ES. A metaanalysis of the variables related to depression in elderly. J Korean Gerontol Soc. 2005; 25(4):167–87.
21. Andresen EM, Malmgren JA, Carter WB, Patrick DL. Screening for depression in well older adults: evaluation of a short form of the CES-D (Center for Epidemiologic Studies Depression Scale). Am J Prev Med. 1994; 10(2):77–84.
22. Cho MJ, Kim KH. Use of the Center for Epidemiologic Studies Depression (CES-D) Scale in Korea. J Nerv Ment Dis. 1998; 186(5):304–10.
crossref
23. Folstein MF, Folstein SE, McHugh PR. "Mini-mental state". A practical method for grading the cognitive state of patients for the clinician. J Psychiatr Res. 1975; 12(3):189–98.
24. Kang YW. A normative study of the Korean Mini Mental State Examination (K-MMSE) in the elderly. Korean J Psychol. 2006; 25(2):1–12.
25. King G, Zeng L. Logistic Regression in Rare Events Data. Political Anal. 2001; 9(2):137–63.
crossref
26. Kim DB, Park SY. Characteristics of social network and suicidal ideation: verifying of mediation effect of depression. Korean J Soc Welfare Res. 2010; 24:109–29.
27. Kim SY, Jang YE. The influence of marital satisfaction on the suicidal ideation of the elderly: focusing on mediating effect of depression. J Korean Gerontol Soc. 2011; 31(2):305–19.
28. Seomun JH, Lee HA. A study on influence of subjective health recognition and social support on the elderly suicide ideation: using parameter effect of depression. J Welfare Aged. 2011; 54:361–85.
29. Statistics Korea. Cause of death. 2011. [Accessed November 10, 2012].http://jah.sagepub.com/content/22/1/84.short.

Figure 1.
Four trajectories of depressive symptoms
kjhp-14-112f1.tif
Table 1.
Review of previous studies on depression trajectories in older adults
Author (year) Sample (N) Study duration, y Depression measurement Identified groups (%) Risks associated with the trajectory groups
Andreescu C (2008) Older adults aged above 65 (1,260) 12 CESD Persisting depressive symptoms group (2) Self-esteem,
        Remitting depressive symptoms group (4.8) interpersonal
        Emerging depressive symptoms group (4.2) difficulties,
        Stable low-depressed group (52.6) health-related
        Stable asymptomatic group 1 (28.1) worries
Byers AL (2012) Older women aged above 65 (7,240) 20 GDS Stable asymptomatic group 2 (8.2) Persistently high depressive symptoms (3.4) Smoking, diabetes,
        Increasing depressive symptoms (14.8) obesity,
        Persistently low depressive symptoms (54) physical activities,
        Minimal depressive symptoms (27.8) social network
Kuchibtatla MN (2012) Older adults aged above 65 (4,162) 10 CESD Depressed group (5.4) Self-reported health,
        Improver group (10) social network,
        Decliner group (8) life stresses
        Not depressed (76.6)  
Murphy BM (2008) Women interviewed following acute 1 HADS Depressed (16) Loneliness, having a first
        Not depressed (84) language other than
  myocardial       English
  infarction (226)        
Taylor DH Jr (2008) Dementia caregivers (1,580) 3 CESD High depression group (30.22) Education level,
        Moderate depression group (33.86) income level,
        Low depression group (21.88) quality of life
        Very low depression group (14.04)  

Abbreviations: CESD, The center for epidemiologic studies depression scale; GDS, Geriatric depression scale; HADS, The hospital anxiety and depression scale.

Table 2.
Comparisons of depressive trajectories using demographic, health-related, social informationa,b
  Total Low (Group 1) Emerging Decline High Group 1 vs.
(Group 2) (Group 3) (Group 4) Group 4
Demographic            
 Age, y 70.43±9.01 70.31±9.04 71.35±7.96 72.88±8.35 74.05±7.32 0.002
 Sex            
  Male 632 (39.75) 626 (40.6) 37 (33.9) 29 (29) 7 (13.5) <0.001
  Female 958 (60.25) 916 (59.4) 72 (66.1) 71 (71) 45 (86.5) <0.001
 Education, y 5.89±4.96 5.98±4.95 4.18±4.25 3.69±4.82 3.19±4.41 0.002
 Resident area            
  Seoul 621 (39.01) 594 (38.5) 17 (15.6) 38 (38) 31 (59.6) 0.002
  Chuncheon 971 (60.99) 950 (61.5) 92 (84.4) 62 (62) 21 (40.4) 0.002
 Resident area2            
  City 922 (57.91) 887 (57.4) 46 (42.2) 54 (54) 39 (75) 0.012
  Rural 670 (42.09) 657 (42.6) 63 (57.8) 46 (46) 13 (25) 0.012
 Widowed            
  Yes 621 (39.01) 593 (38.4) 40 (36.7) 53 (53) 31 (59.6) 0.002
  No 971 (60.99) 951 (61.6) 69 (63.3) 47 (47) 21 (40.4) 0.002
 Religion            
  Have 978 (61.43) 944 (61.1) 61 (56) 52 (52) 38 (73.1) 0.082
  Does not have 614 (38.57) 600 (38.9) 48 (44) 48 (48) 14 (26.9) 0.082
 Employed            
  Yes 1,131 (71.45) 443 (28.9) 33 (31.1) 12 (12.1) 9 (17.3) 0.069
  No 452 (28.55) 1,092 (71.1) 73 (68.9) 87 (87.9) 43 (82.7) 0.069
 Income, 10,000 Korean Won            
  0–99 643 (41.86) 610 (40.9) 60 (57.1) 56 (57.1) 36 (73.5) <0.001
  100–199 419 (27.28) 412 (27.6) 23 (21.9) 20 (20.4) 7 (13.3) <0.001
  ≤200 474 (30.86) 469 (31.5) 22 (21.0) 22 (22.5) 6 (12.2) <0.001
 Saving, 10,000 Korean Won 29.46±85.22 29.95±86.19 32.83±53.80 24.30±60.16 13.83±41.59 0.016
 Economic hardship 2.70±0.97 2.68±0.96 2.94±0.97 3.38±0.97 3.38±0.84 <0.001
Health-related            
 Self-reported 1.87±1.09 1.89±1.08 1.54±1.06 0.86±0.98 1.08±0.86 <0.001
 Fall Experience            
  Yes 334 (20.98) 316 (20.5) 27 (24.8) 30 (30.0) 19 (36.5) 0.005
  No 1,258 (79.02) 1,228 (79.5) 82 (75.2) 70 (70.0) 33 (63.5) 0.005
 BMI
 Number of disease
24.07±3.69
1.99±1.72
24.06±3.70
1.93±1.69
24.85±5.07
2.56±1.98
23.12±4.30
3.01±2.03
24.32±3.38
3.51±2.01
0.603
<0.001
 MMSE score 24.69±4.47 24.78±4.45 24.03±4.13 22.48±5.19 22.04±4.38 <0.001
Social-related            
 Number of social group 1.43±1.20 1.44±1.21 1.40±1.17 0.9±0.95 1.08±0.97 0.037
 Social support 23.40±6.72 23.52±6.69 22.13±5.88 20.44±6.64 19.86±6.78 <0.001

Abbreviations: BMI, body mass index; MMSE, mini-mental state examination, SE, standard error.

a Values are presented as mean±SE or N (%).

b When comparing group differences chi-square test was used for the nominal variables, and t-test or Kruskal Wallis test was used for the continuous variable according to the normality test result.

Table 3.
Results of predicting the likelihood of falling in group 2, group 3, and group 4 compared to group 1a
Model Group 2 Group 3 Group 4
B SE OR P B SE OR P B SE OR P
1. Economic hardship 0.347 0.143 1.415 0.016 0.830 0.154 2.293 <0.001 0.590 0.369 1.804 0.004
2. Self-reported health –0.388 0.126 0.678 0.002 –1.028 0.152 0.358 <0.001 –0.634 0.167 0.530 <0.001
3. Fall experience –0.256 0.267 0.774 0.337 0.454 0.226 1.575 0.045 0.689 0.308 1.991 0.025
4. Number of diseases 0.161 0.075 1.175 0.032 0.274 0.054 1.315 <0.001 0.299 0.078 1.349 <0.001
5. MMSE score –0.016 0.025 0.984 0.529 –0.077 0.021 0.926 <0.001 –0.072 0.030 0.930 0.015
6. Number of social groups –0.078 0.107 0.925 0.461 –0.480 0.136 0.619 <0.001 –0.161 0.164 0.851 0.325
7. Social support –0.019 0.017 0.981 0.251 –0.073 0.016 0.930 <0.001 –0.065 0.023 0.938 0.006

Abbreviations: SE, standard error; OR, odds ratio; MMSE, mini-mental state examination.

a A series of logit models were run controlling for age, sex, education, resident areas, marital status, religion, employment, income, and BMI.

TOOLS
Similar articles