ABSTRACT
Background:
Exaggerated blood pressure (BP) response to exercise can be an independent risk factor for cardiovascular mortality and morbidity. The purpose of this study was to define the factor that effect on early systolic BP response to exercise.
Methods:
We examined echocardiographic data, BP, heart rate from graded exercise test and brachial ankle pulse wave velocity (PWV) of 205 patients (137 men and 68 women; mean age 58 ± 11 years; range, 19 to 83 years). Graded exercise test was conducted in BRUCE protocol. We define delta systolic blood pressure (SBP) as systolic BRUCE stage “n” BP minus baseline BP.
Results:
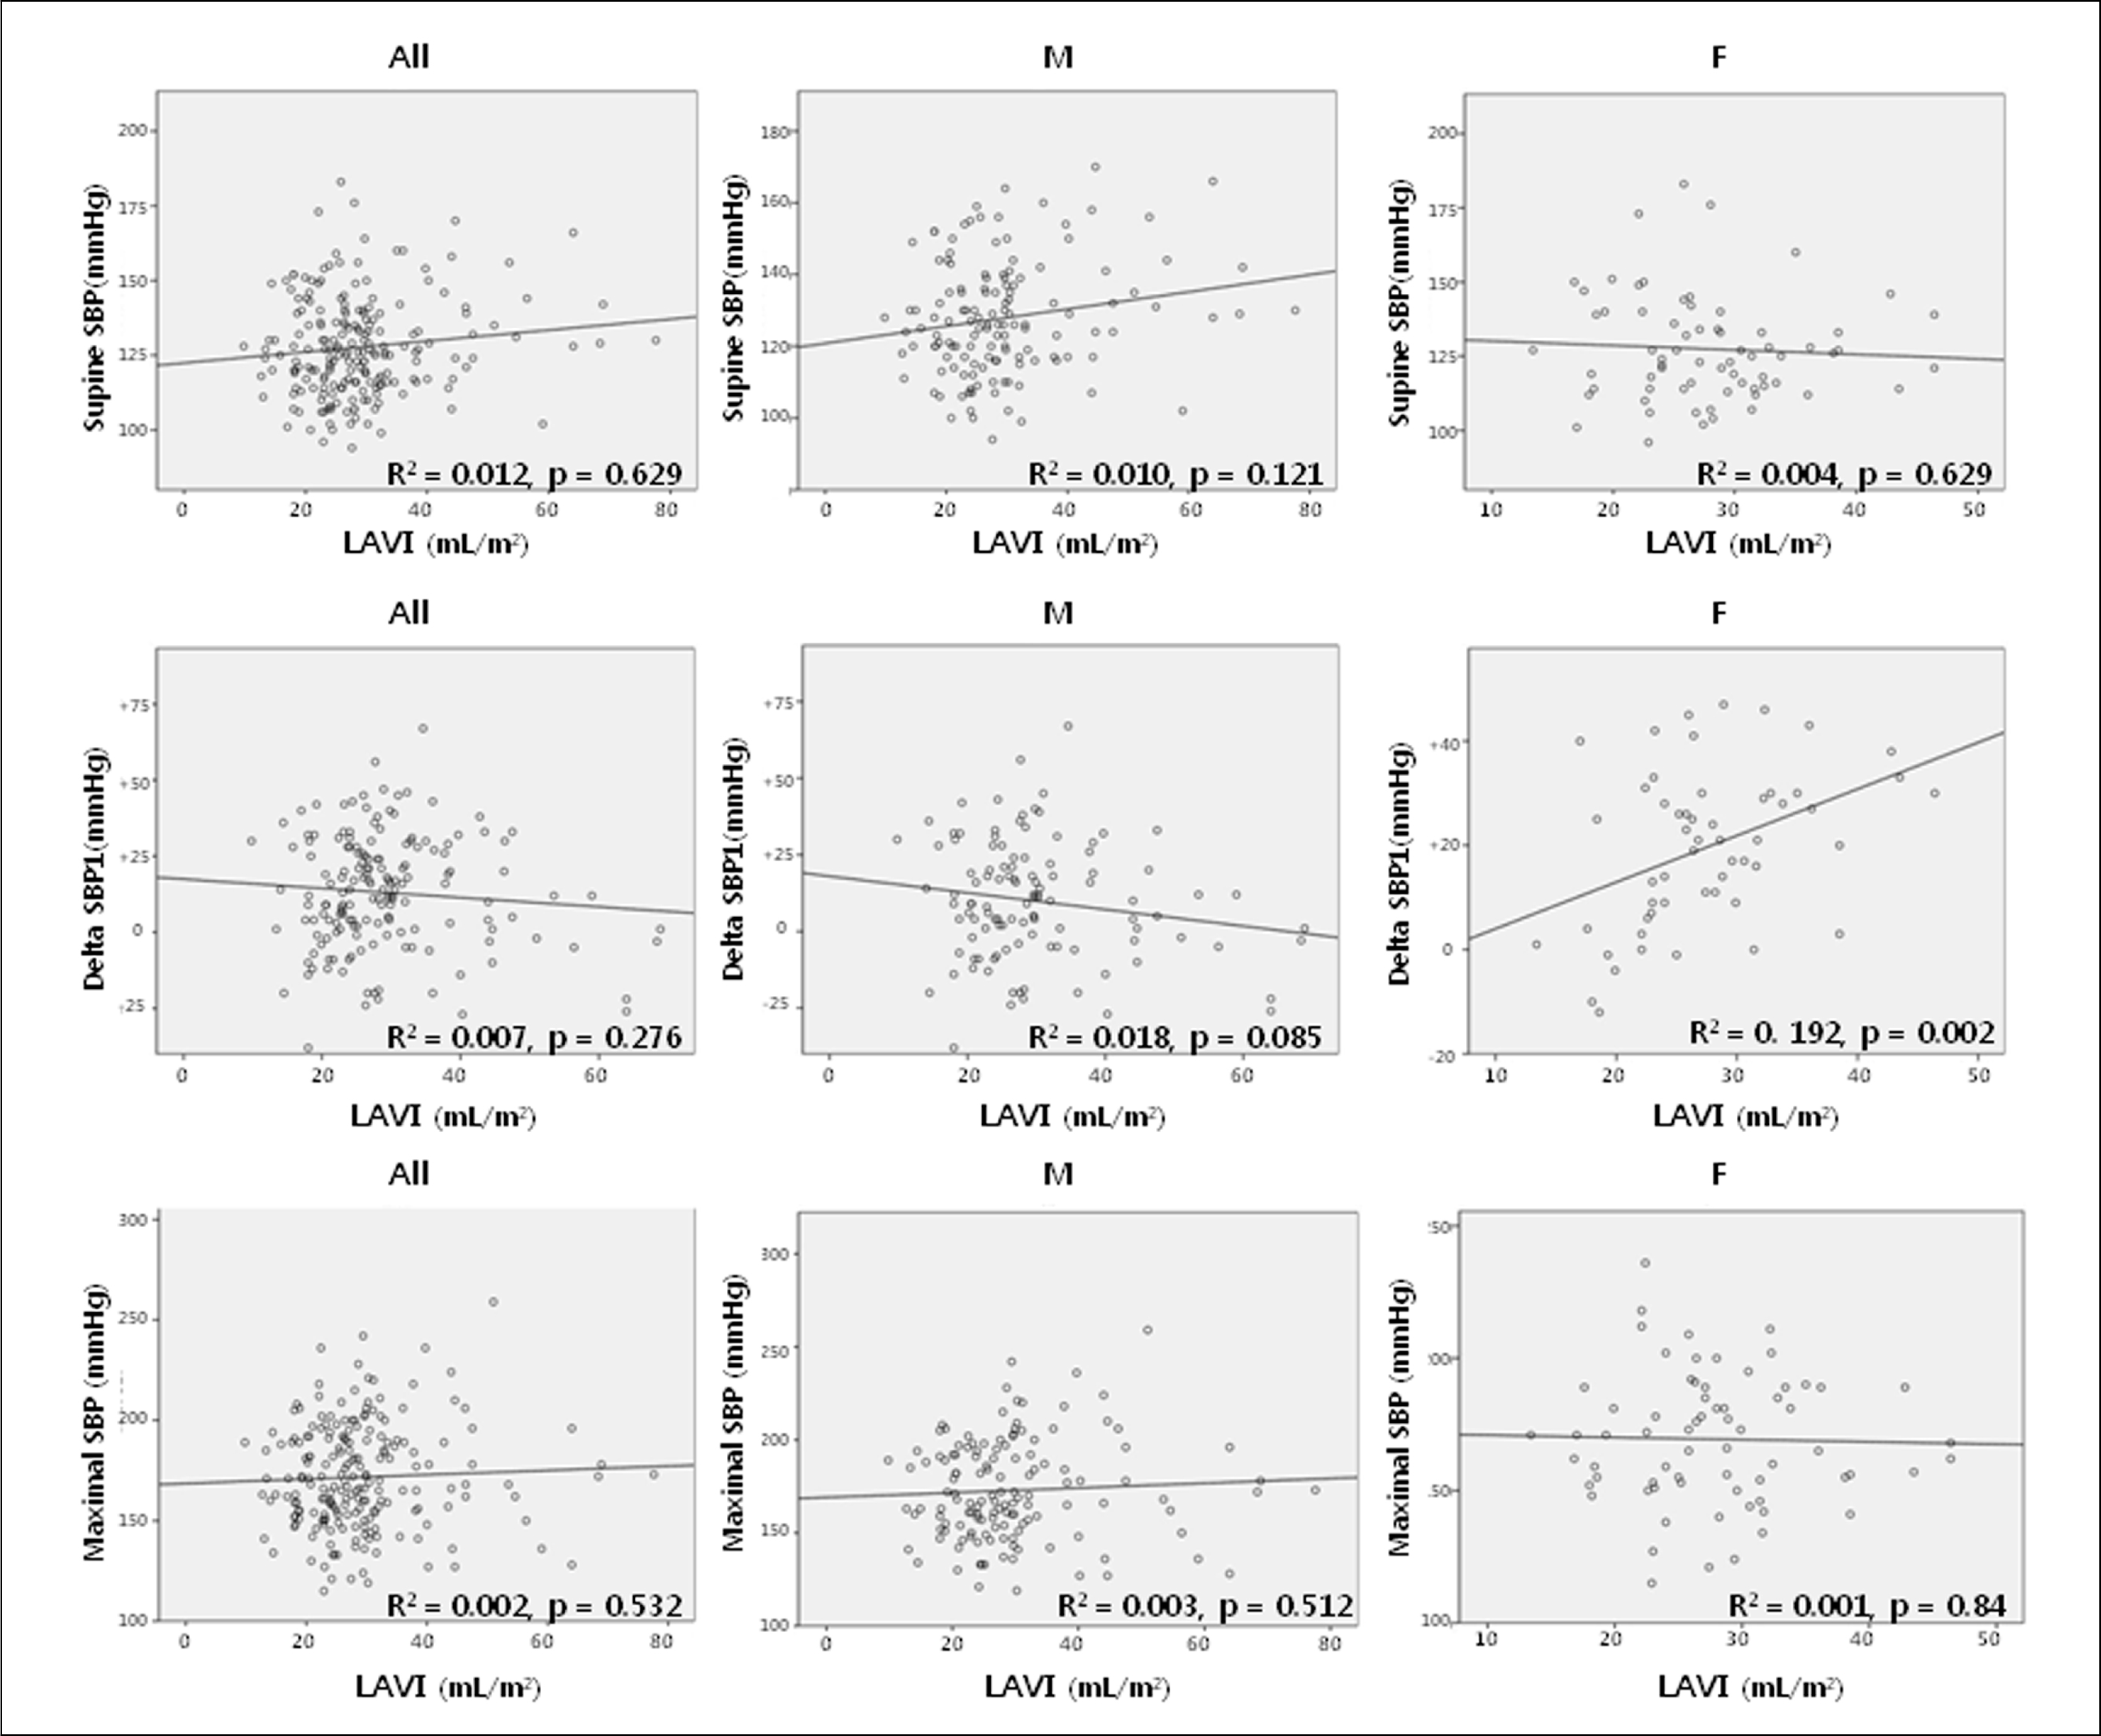
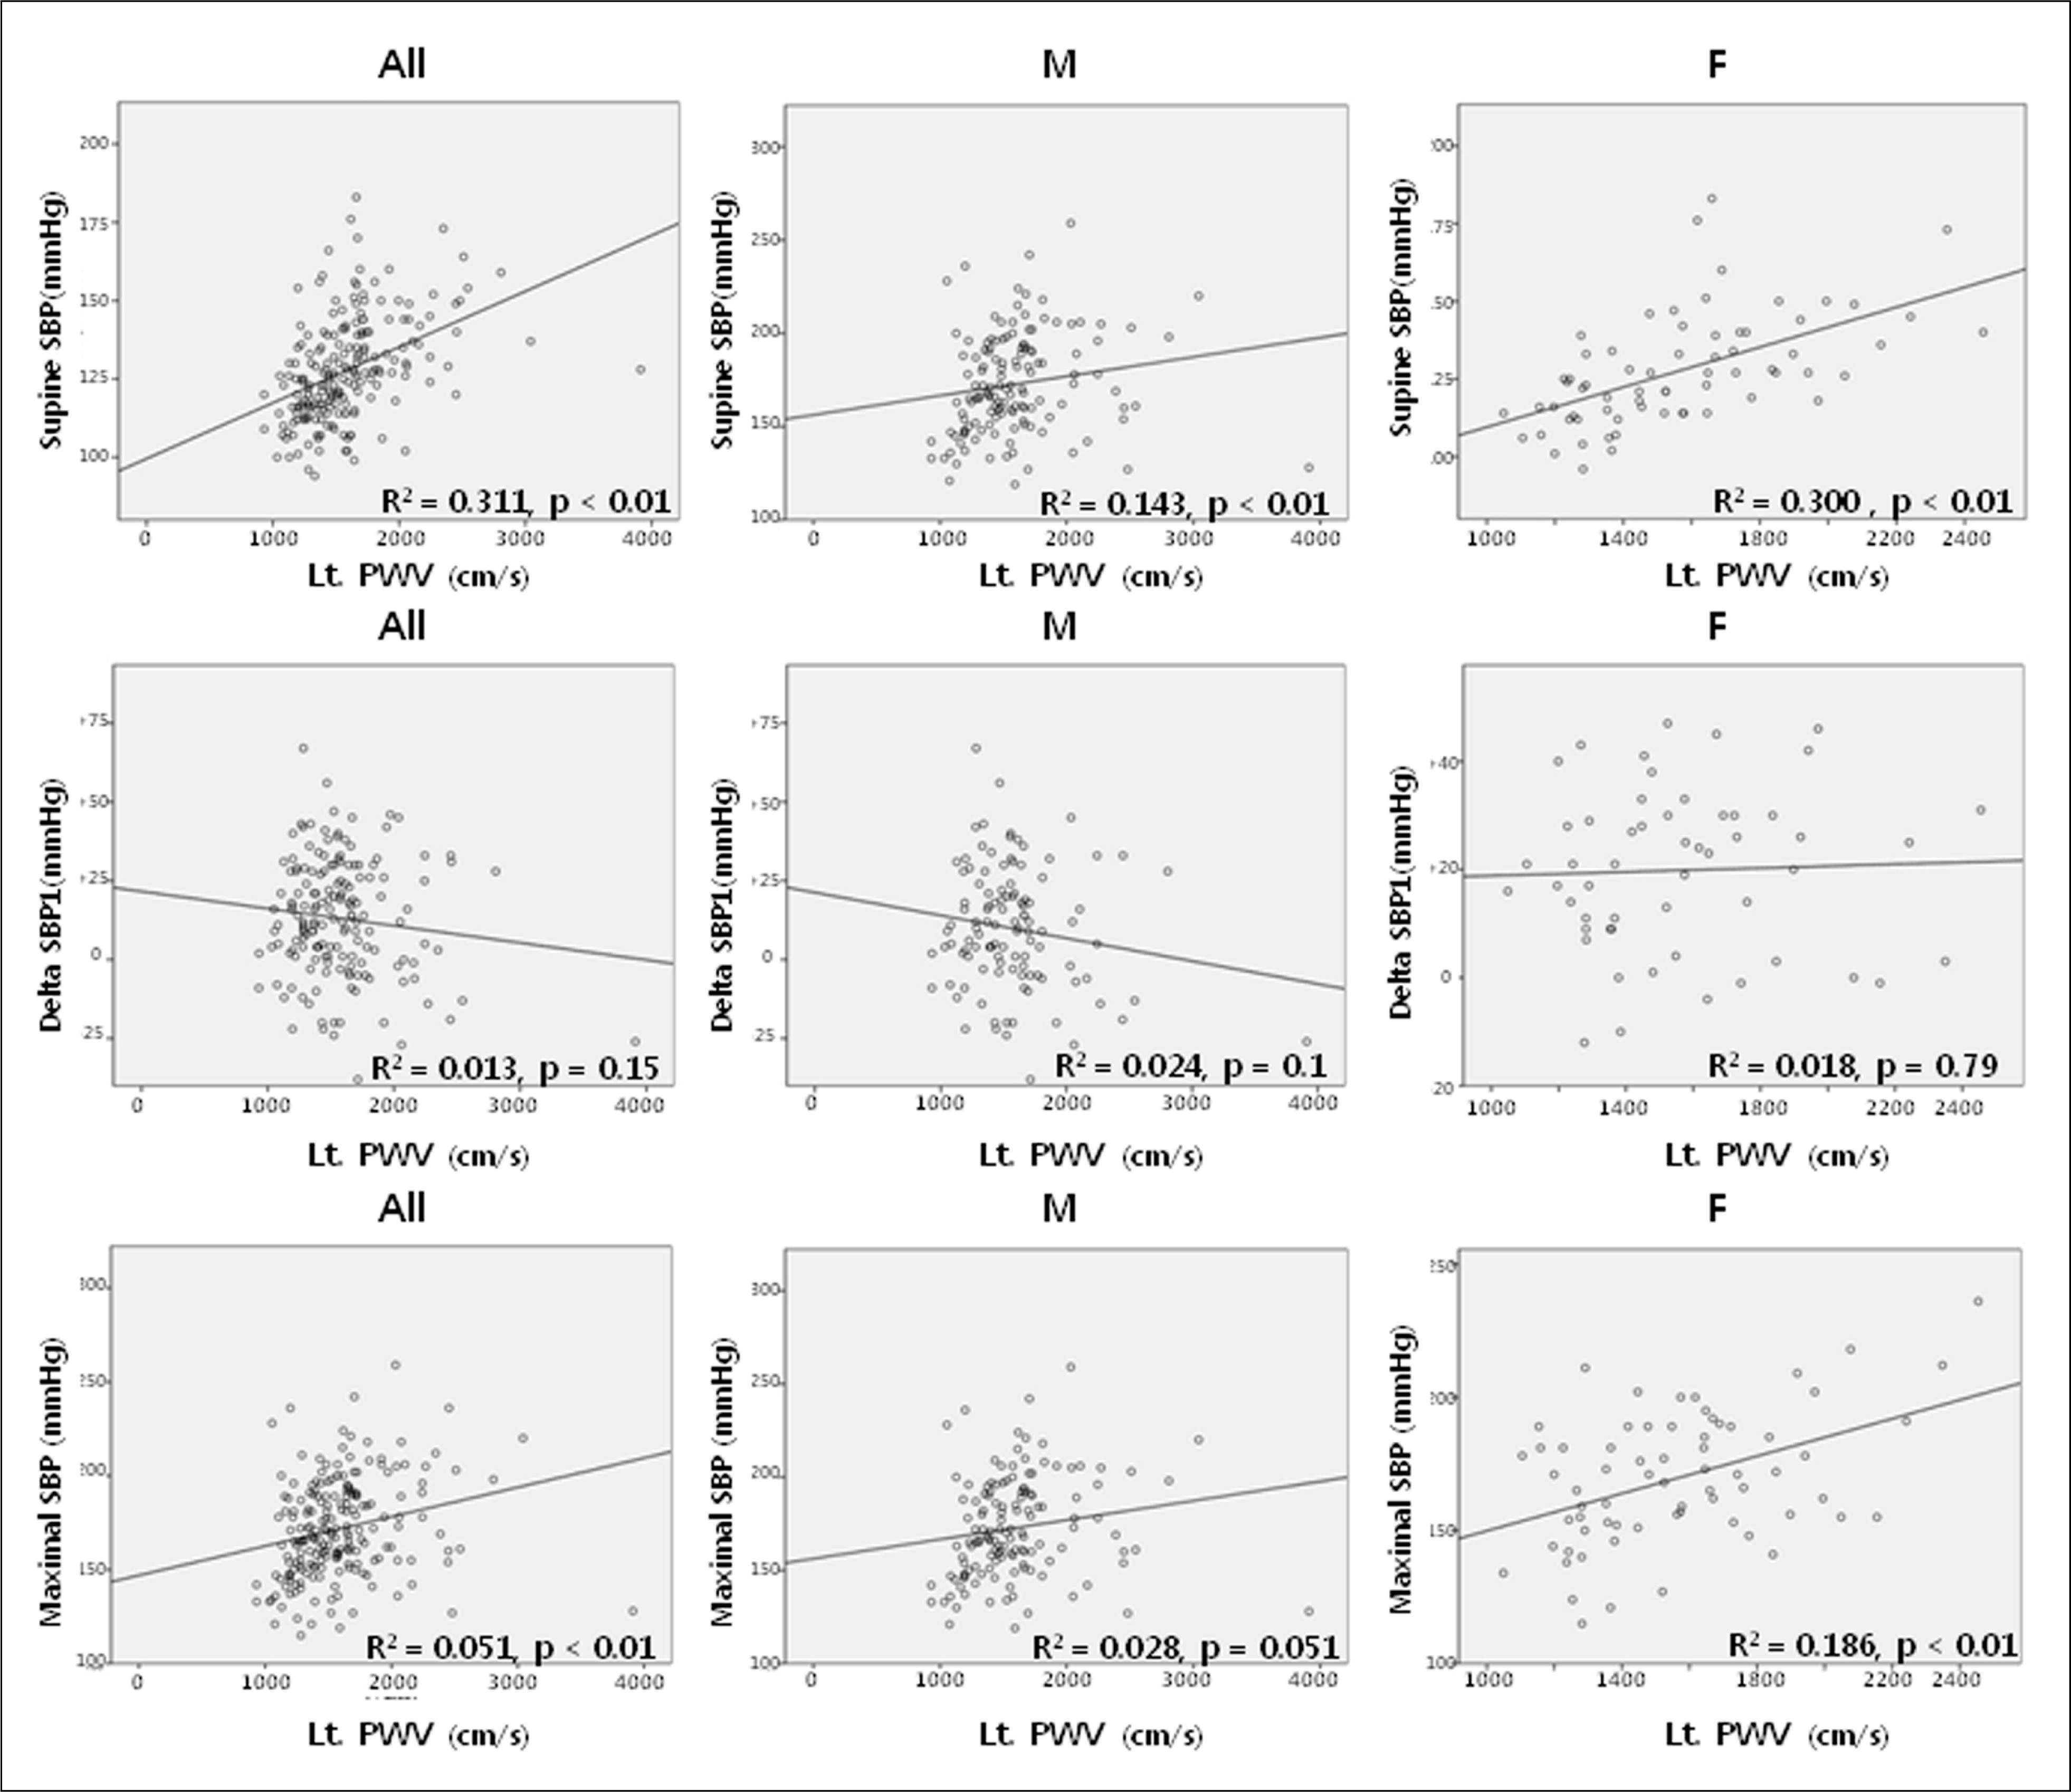
Resting BP (127 ± 16 mm Hg) was elevated to 171 ± 26 mm Hg after peak graded exercise test. Resting heart rate (80 ± 15 bpm) was increased to 146 ± 27 bpm after peak graded exercise test. Stepwise regression test between baseline SBP, delta SBP, maximal SBP and left atrial volume index (LAVI) was done. Supine SBP, delta SBP, maximal SBP was not associated with LAVI (p > 0.5). But increased LAVI was significantly associated with delta SBP1 in woman (R2 = 0.192, p = 0.002). PWV was significantly associated with base line (R2 = 0.311, p < 0.01) and maximal SBP (R2 = 0.051, p < 0.01). However, PWV was not associated with delta SBP.
Go to : 
References
1. Singh JP, Larson MG, Manolio TA. O’Donnell CJ, Lauer M, Evans JC, et al. Blood pressure response during treadmill testing as a risk factor for new-onset hypertension. The Framingham heart study. Circulation. 1999; 99:1831–6.
2. Miyai N, Arita M, Miyashita K, Morioka I, Shiraishi T, Nishio I. Blood pressure response to heart rate during exercise test and risk of future hypertension. Hypertension. 2002; 39:761–6.

3. Weiss SA, Blumenthal RS, Sharrett AR, Redberg RF, Mora S. Exercise blood pressure and future cardiovascular death in asymptomatic individuals. Circulation. 2010; 121:2109–16.

4. Lauer MS, Okin PM, Larson MG, Evans JC, Levy D. Impaired heart rate response to graded exercise. Prognostic implications of chronotropic incompetence in the Framingham Heart Study. Circulation. 1996; 93:1520–6.
5. Pritchett AM, Mahoney DW, Jacobsen SJ, Rodeheffer RJ, Karon BL, Redfield MM. Diastolic dysfunction and left atrial volume: a population-based study. J Am Coll Cardiol. 2005; 45:87–92.
6. Tsang TS, Barnes ME, Gersh BJ, Bailey KR, Seward JB. Left atrial volume as a morphophysiologic expression of left ventricular diastolic dysfunction and relation to cardiovascular risk burden. Am J Cardiol. 2002; 90:1284–9.

7. Choi CU, Kim EJ, Kim SH, Shin SY, Choi UJ, Kim JW, et al. Differing effects of aging on central and peripheral blood pressures and pulse wave velocity: a direct intraarterial study. J Hypertens. 2010; 28:1252–60.

8. Watson G, Mechling E, Ewy GA. Clinical significance of early vs late hypotensive blood pressure response to treadmill exercise. Arch Intern Med. 1992; 152:1005–8.

9. II de Liefde, SE Hoeks, YR van Gestel, J Klein, HJ Verhagen, RT van Domburg, et al. Prognostic value of hypotensive blood pressure response during single-stage exercise test on long-term outcome in patients with known or suspected peripheral arterial disease. Coron Artery Dis. 2008; 19:603–7.
10. Ogawa T, Spina RJ, Martin WH 3rd, Kohrt WM, Schechtman KB, Holloszy JO, et al. Effects of aging, sex, and physical training on cardiovascular responses to exercise. Circulation. 1992; 86:494–503.

11. Sheffield LT, Maloof JA, Sawyer JA, Roitman D. Maximal heart rate and treadmill performance of healthy women in relation to age. Circulation. 1978; 57:79–84.

12. Martin WH 3rd, Ogawa T, Kohrt WM, Malley MT, Korte E, Kieffer PS, et al. Effects of aging, gender, and physical training on peripheral vascular function. Circulation. 1991; 84:654–64.

13. Tanji JL, Champlin JJ, Wong GY, Lew EY, Brown TC, Amsterdam EA. Blood pressure recovery curves after submaximal exercise: a predictor of hypertension at ten-year follow-up. Am J Hypertens. 1989; 2(3 Pt 1):135–8.
14. Wilson MF, Sung BH, Pincomb GA, Lovallo WR. Exaggerated pressure response to exercise in men at risk for systemic hypertension. Am J Cardiol. 1990; 66:731–6.

15. Manolio TA, Burke GL, Savage PJ, Sidney S, Gardin JM, Oberman A. Exercise blood pressure response and 5-year risk of elevated blood pressure in a cohort of young adults: the CARDIA study. Am J Hypertens. 1994; 7:234–41.

16. Dlin RA, Hanne N, Silverberg DS, Bar-Or O. Follow-up of normotensive men with exaggerated blood pressure response to exercise. Am Heart J. 1983; 106:316–20.

17. Franz IW. Exercise hypertension: its measurement and evaluation. Herz. 1987; 12:99–109.
18. Pescatello LS, Fargo AE, Leach CN Jr, Scherzer HH. Short-term effect of dynamic exercise on arterial blood pressure. Circulation. 1991; 83:1557–61.

19. Park HJ, Rho TH, Park CS, Jang SW, Shin WS, Oh YS, et al. The relationship between the acute changes of the systolic blood pressure and the brachial-ankle pulse wave velocity. Korean J Intern Med. 2007; 22:147–51.

21. Kim NH, Jeong JW, Choi JH, Song M, Park EM, Kim YK, et al. Effect of hemodynamic changes on pulse wave velocity. Korean Hypertension J. 2006; 12:16–22.
Go to : 
 | Fig. 1.
Association of left atrial volume index (LAVI) by gender on early systolic blood pressure (SBP) response to exercise. Stepwise regression test between baseline SBP, delta SBP, maximal SBP and LAVI was done. Supine SBP, delta SBP, maximal SBP was not significantly associated with LAVI (p > 0.5). Increased LAVI was significantly associated with delta SBP1 only in woman (R2 = 0.192, p = 0.002). Delta SBP, SBP difference between Bruce protocol stage and baseline ; All, both male and female ; M, male ; F, female. |
 | Fig. 2.Association of left pulse wave velocity (PWV) on early systolic blood pressure (SBP) response. PWV was significantly associated with baseline SBP (R2 = 0.311, p < 0.01) and maximal SBP (R2 = 0.051, p < 0.01). But PWV was not associated with delta SBP. All, both male and female ; M, male; F, female ; Lt, left. |
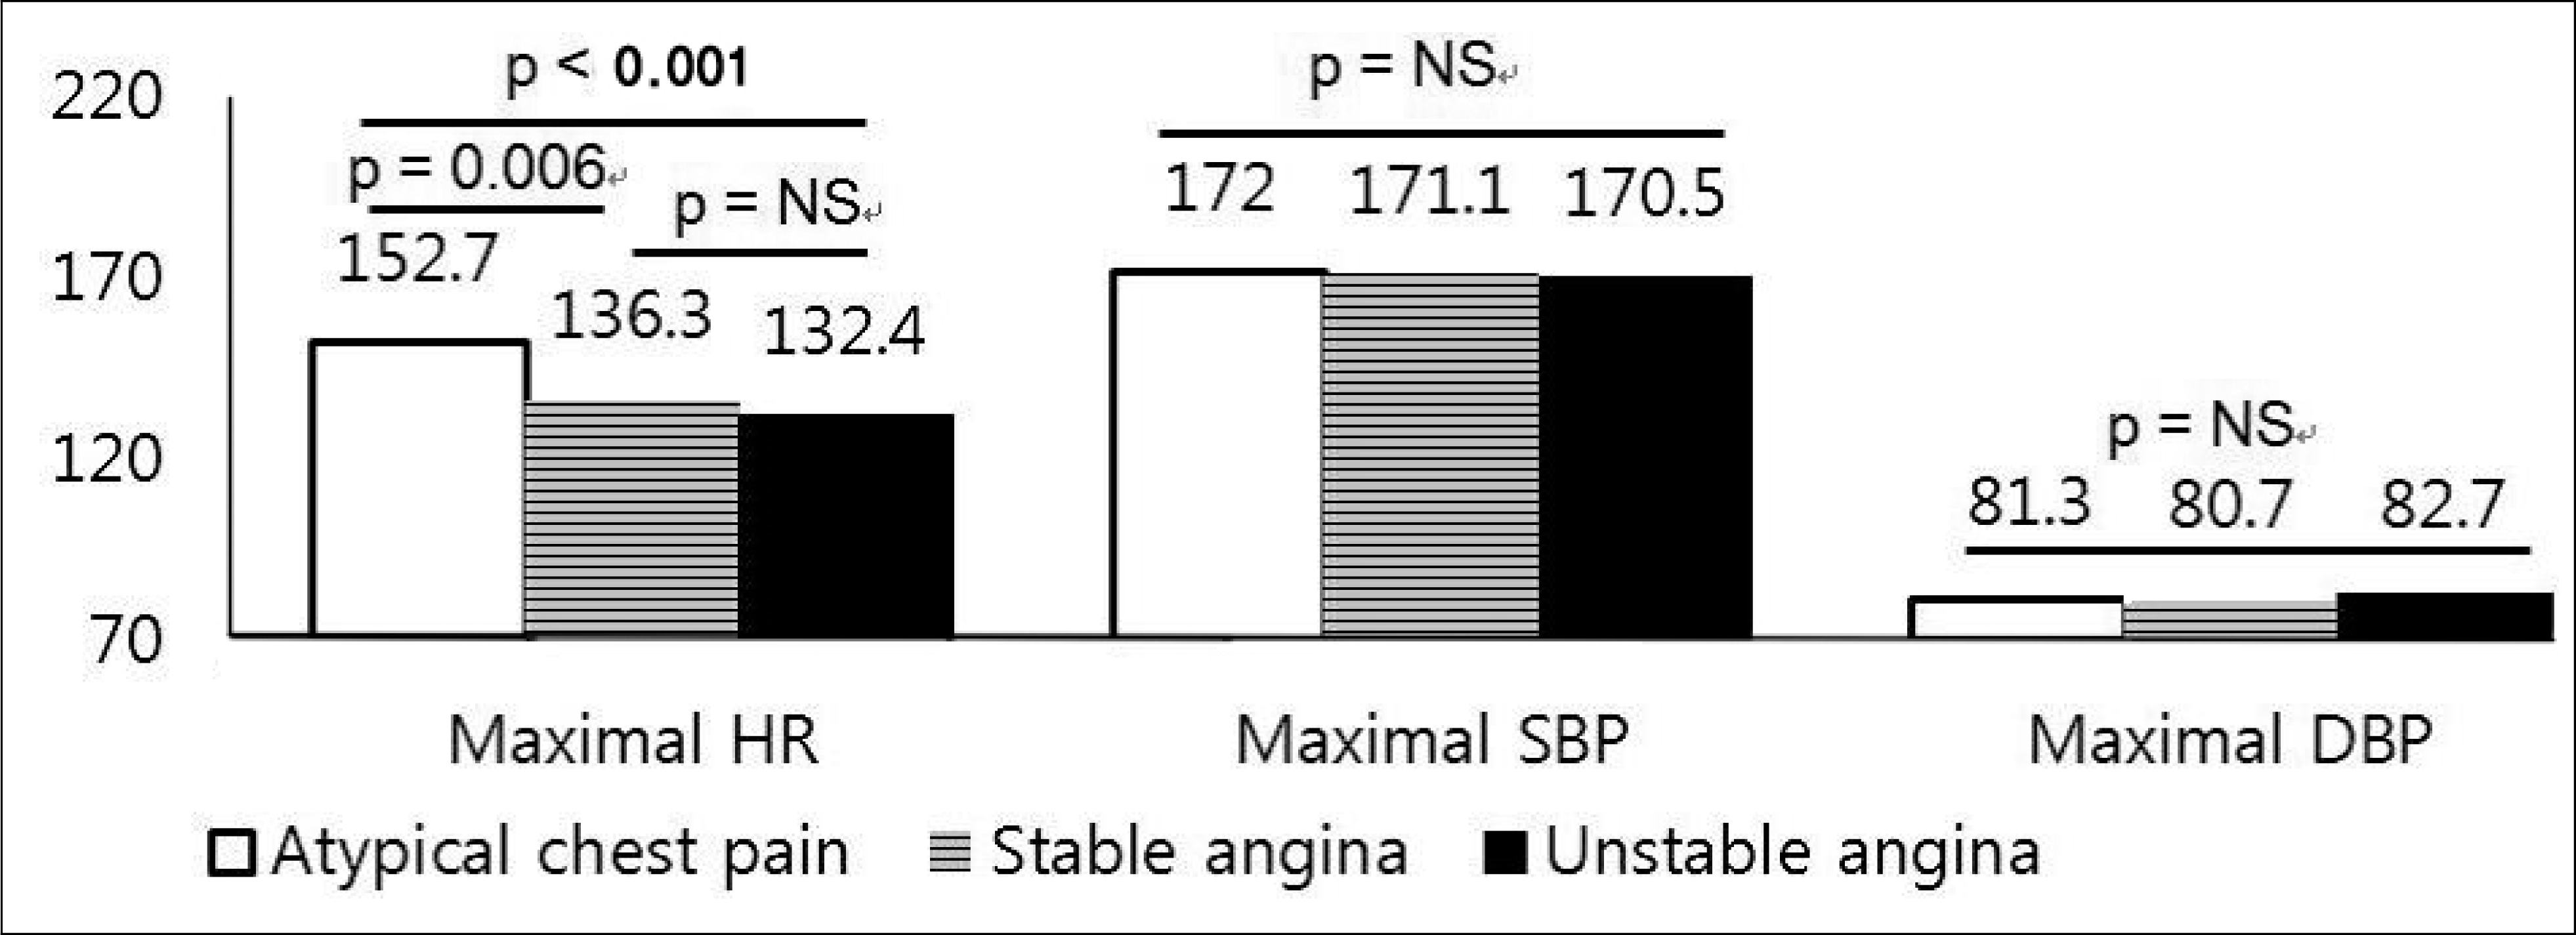
 | Fig. 3.Average maximal heart rate was decreased in order of atypical chest pain, stable angina and unstable angina. Maximal heart rate was significantly different according to ischemic heart disease (atypical chest pain vs. stable angina and unstable angina, p = 0.006, < 0.001). However maximal SBP and maximal DBP were not significantly different according to ischemic heart disease. NS, non-specific; HR, heart rate; SBP, systolic blood pressure; DBP, diastolic blood pressure. |
Table 1.
Baseline characteristics
Table 2.
BP and HR response to graded exercise test


 PDF
PDF ePub
ePub Citation
 Print
Print


 XML Download