ABSTRACT
Background:
Left ventricular hypertrophy (LVH) offers prognostic information beyond that provided by the evaluation of traditional cardiovascular risk factors. However, the validation of electrocardiogram (ECG) criteria for the diagnosis of LVH is limited in Korea general population. The purpose of this study is to investigate the diagnostic accuracy of ECG criteria for the detection of LVH in general population.
Methods:
In the present study, we investigated a total of 1,946 adults from the community-based cohort. The left ventricular mass index (LVMI) was estimated with echocardiographic measurement and adjusted with body surface area. LVH was defined as a value greater than or equal to the sex-specific 90th percentile value of LVMI. ECG criteria for the diagnosis of LVH were Sokolow-Lyon criteria and Cornell criteria.
Results:
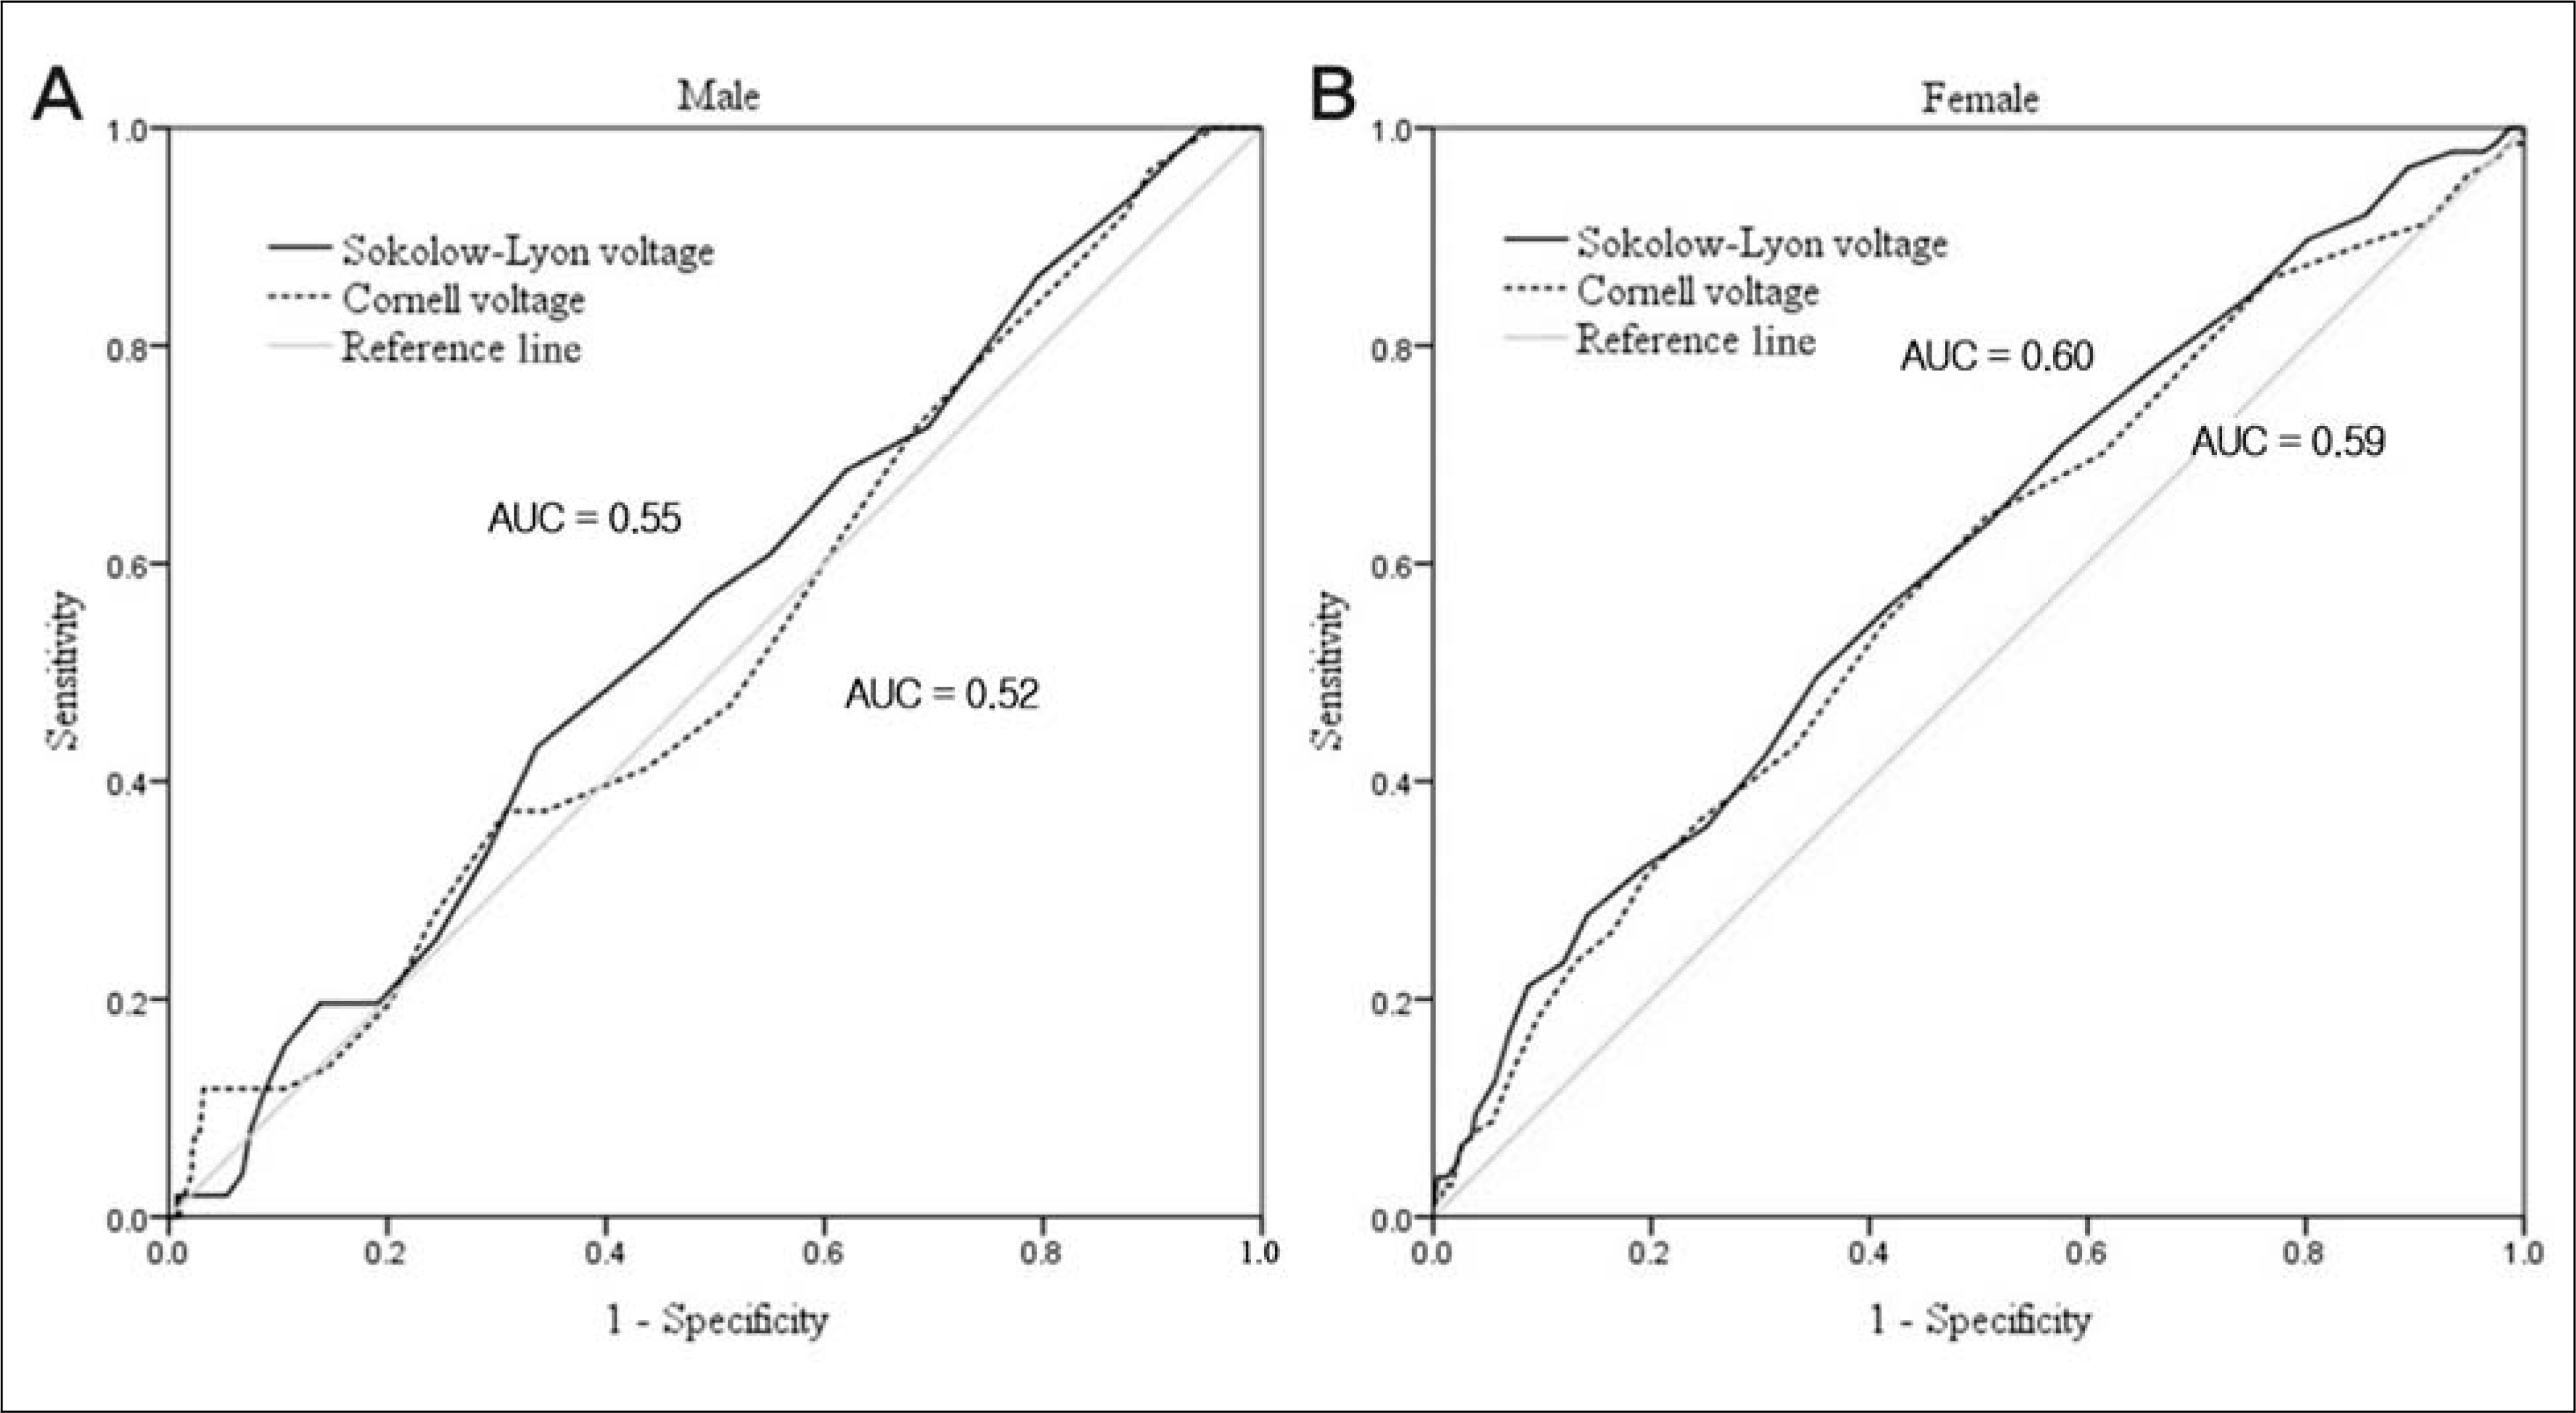
The LVMI was significantly higher in male subjects (91.1 ± 23.9 g/m2 vs. 83.9 ± 21.7 g/m2, p < 0.001). The cutoff values were 120.8 g/m2 in male subjects and 112.2 g/m2 in female subjects. The sensitivity and specificity of Sokolow-Lyon criteria were 5.6% and 93.6% in male, 4.1% and 97.8% in female. Those of Cornell criteria were 2.8% and 98.7% in male, 14.3% and 95.8% in female. In male, the area under the receiver operating characteristic curves of Sokolow-Lyon voltage and Cornell voltage were 0.55 and 0.52. And those in female were 0.59 and 0.60.
References
1. Kannel WB, Gordon T, Offutt D. Left ventricular hypertrophy by electrocardiogram: prevalence, incidence, and mortality in the Framingham study. Ann Intern Med. 1969; 71:89–105.
2. Kannel WB, Gordon T, Castelli WP, Margolis JR. Electrocardiographic left ventricular hypertrophy and risk of coronary heart disease: the Framingham study. Ann Intern Med. 1970; 72:813–22.

3. Sundstrom J, Lind L, Arnlov J, Zethelius B, Andren B, Lithell HO. Echocardiographic and electrocardiographic diagnoses of left ventricular hypertrophy predict mortality independently of each other in a population of elderly men. Circulation. 2001; 103:2346–51.

4. Kim HM, Jung JH, Lee HS, Kim CH, Cho GY. Relation of inappropriate left ventricular hypertrophy on Framingham risk score and vascular stiffness in hypertensive women. J Korean Soc Hypertens. 2013; 19:10.

5. Sever PS, Dahlof B, Poulter NR, Wedel H, Beevers G, Caulfield M, et al. Prevention of coronary and stroke events with atorvastatin in hypertensive patients who have average or lower-than-average cholesterol concentrations, in the Anglo-Scandinavian Cardiac Outcomes Trial-Lipid Lowering Arm (ASCOT-LLA): a multicentre randomised controlled trial. Lancet. 2003; 361:1149–58.

6. Woythaler JN, Singer SL, Kwan OL, Meltzer RS, Reubner B, Bommer W, et al. Accuracy of echocardiography versus electrocardiography in detecting left ventricular hypertrophy: comparison with postmortem mass measurements. J Am Coll Cardiol. 1983; 2:305–11.

7. Pewsner D, Juni P, Egger M, Battaglia M, Sundstrom J, Bachmann LM. Accuracy of electrocardiography in diagnosis of left ventricular hypertrophy in arterial hypertension: systematic review. BMJ. 2007; 335:711.

8. Park SM, Ro YM, Ahn JC, Lim DS, Park CG, Kim YH, et al. An appraisal of the electrocardiographic criteria for diagnosis of left ventricular hypertrophy in Koreans: comparison to echocardiographic measurement of left ventricular mass. Korean Circ J. 2004; 34:775–83.

9. Schiller NB, Shah PM, Crawford M, DeMaria A, Devereux R, Feigenbaum H, et al. Recommendations for quantitation of the left ventricle by two-dimensional echocardiography. American Society of Echocardiography Committee on Standards, Subcommittee on Quantitation of Two-Dimensional Echocardiograms. J Am Soc Echocardiogr. 1989; 2:358–67.
10. Devereux RB, Lutas EM, Casale PN, Kligfield P, Eisenberg RR, Hammond IW, et al. Standardization of M-mode echocardiographic left ventricular anatomic measurements. J Am Coll Cardiol. 1984; 4:1222–30.

11. Vasan RS, Benjamin EJ, Larson MG, Leip EP, Wang TJ, Wilson PW, et al. Plasma natriuretic peptides for community screening for left ventricular hypertrophy and systolic dysfunction: the Framingham heart study. JAMA. 2002; 288:1252–9.

12. Sokolow M, Lyon TP. The ventricular complex in left ventricular hypertrophy as obtained by unipolar precordial and limb leads. Am Heart J. 1949; 37:161–86.

13. Casale PN, Devereux RB, Kligfield P, Eisenberg RR, Miller DH, Chaudhary BS, et al. Electrocardiographic detection of left ventricular hypertrophy: development and prospective validation of improved criteria. J Am Coll Cardiol. 1985; 6:572–80.

14. Levy D, Garrison RJ, Savage DD, Kannel WB, Castelli WP. Prognostic implications of echocardiographically determined left ventricular mass in the Framingham Heart Study. N Engl J Med. 1990; 322:1561–6.

15. Kim TS, Youn HJ, youn HJ. From hypertension to heart failure. Korean Hypertension J. 2009; 15:1–11.
16. Kannel WB. Prevalence and natural history of electrocardiographic left ventricular hypertrophy. Am J Med. 1983; 75:4–11.

17. Wong CY, O’Moore-Sullivan T, Leano R, Byrne N, Beller E, Marwick TH. Alterations of left ventricular myocardial characteristics associated with obesity. Circulation. 2004; 110:3081–7.

18. Hinderliter AL, Light KC. Willis PWt. Racial differences in left ventricular structure in healthy young adults. Am J Cardiol. 1992; 69:1196–9.
19. Harshfield GA, Koelsch DW, Pulliam DA, Alpert BS, Richey PA, Becker JA. Racial differences in the age-related increase in left ventricular mass in youths. Hypertension. 1994; 24:747–51.

20. Daimon M, Watanabe H, Abe Y, Hirata K, Hozumi T, Ishii K, et al. Normal values of echocardiographic parameters in relation to age in a healthy Japanese population: the JAMP study. Circ J. 2008; 72:1859–66.
21. Park SW. Multicenter trial for estimation of normal values of echocardiographic indices in Korea. Korean Circ J. 2000; 30:373–82.

22. Chobanian AV, Bakris GL, Black HR, Cushman WC, Green LA, Izzo JL Jr, et al. The Seventh Report of the Joint National Committee on Prevention, Detection, Evaluation, and Treatment of High Blood Pressure: the JNC 7 report. JAMA. 2003; 289:2560–72.

23. Park JK, Shin JH, Kim SH, Lim YH, Kim KS, Kim SG, et al. A comparison of cornell and sokolow-lyon electrocardiographic criteria for left ventricular hypertrophy in Korean patients. Korean Circ J. 2012; 42:606–13.

24. Alfakih K, Walters K, Jones T, Ridgway J, Hall AS, Sivananthan M. New gender-specific partition values for ECG criteria of left ventricular hypertrophy: recalibration against cardiac MRI. Hypertension. 2004; 44:175–9.
25. Okin PM, Devereux RB, Jern S, Kjeldsen SE, Julius S, Dahlof B. Baseline characteristics in relation to electrocardiographic left ventricular hypertrophy in hypertensive patients: the Losartan intervention for endpoint reduction (LIFE) in hypertension study. The Life Study Investigators. Hypertension. 2000; 36:766–73.
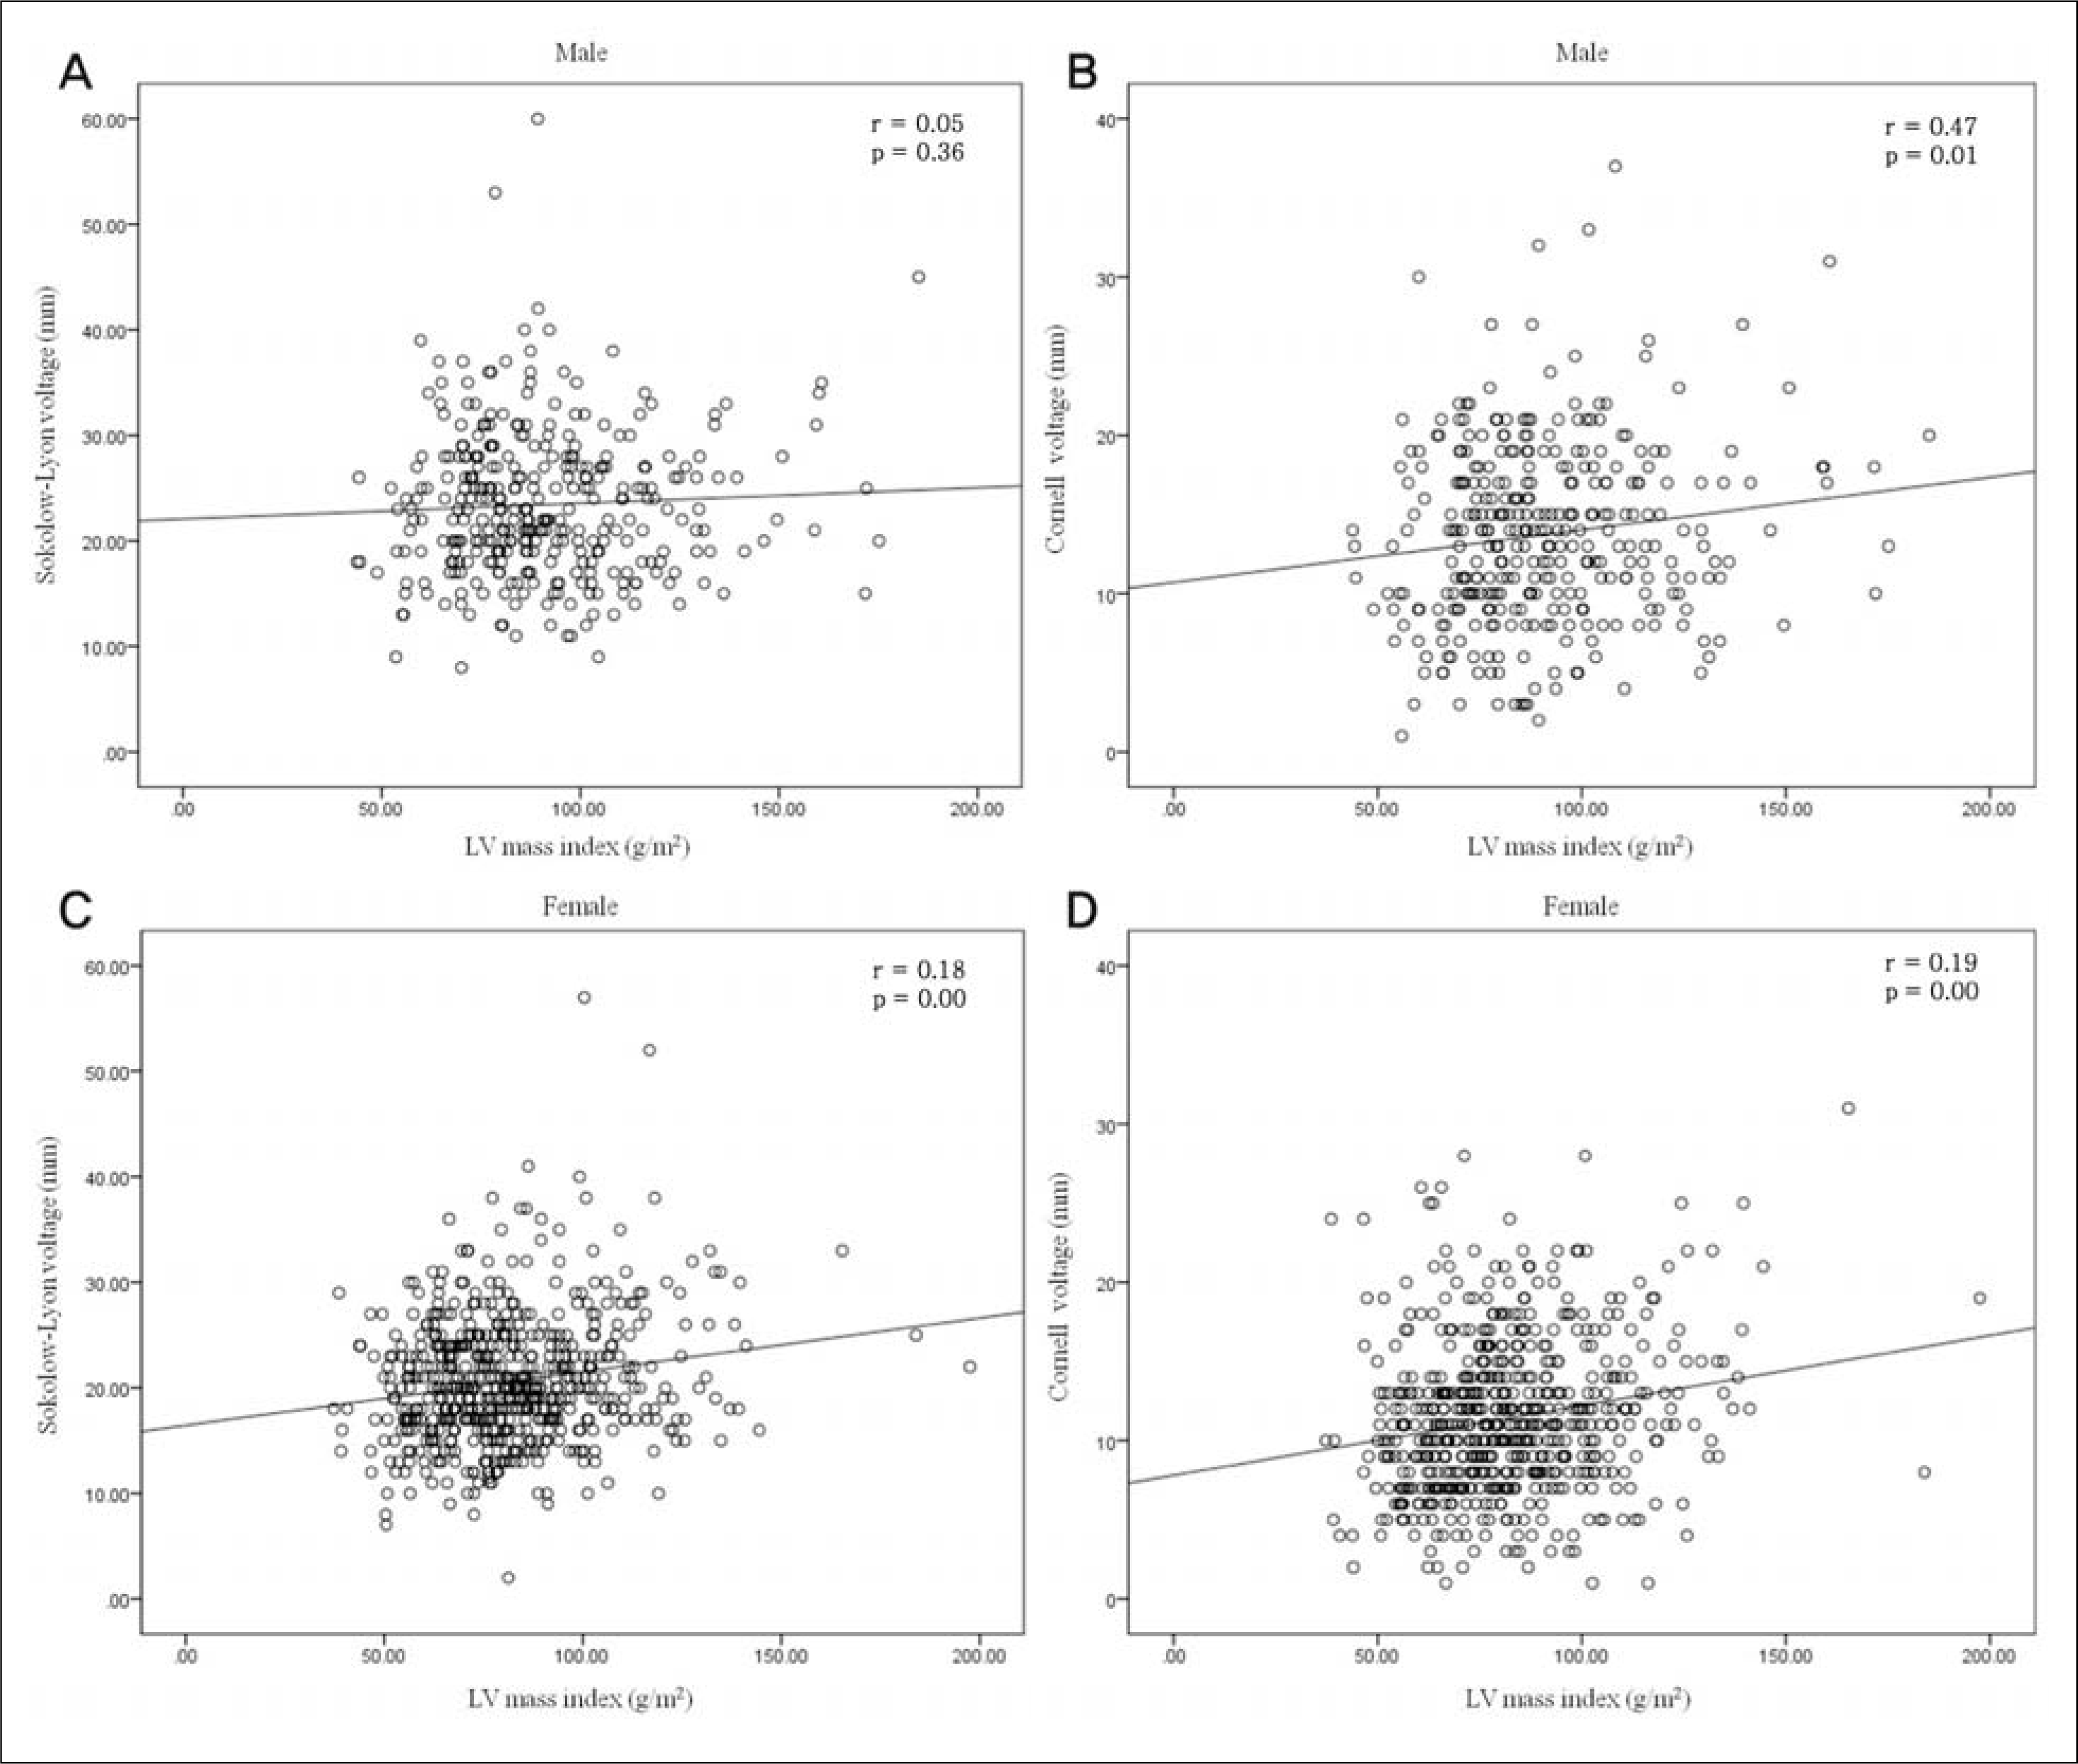
Fig. 1.
The correlation of electrocardiogram criteria and left ventricular (LV) mass index (g/m2). (A) The correlation between Sokolow-Lyon criteria and left ventricular mass index in male. (B) The correlation between Cornell voltage criteria and left ventricular mass index in male. (C) The correlation between Sokolow-Lyon criteria and left ventricular mass index in female. (D) The correlation between Cornell voltage criteria and left ventricular mass index in female.

Fig. 2.
Receiver operating characteristic curves for electrocardiogram criteria for detecting left ventricular hypertrophy in (A) male and (B) female. AUC, area under the curve.

Table 1.
Demographic and clinical characteristics of male subjects
Table 2.
Demographic and clinical characteristics of female subjects
Table 3.
Echocardiographic parameter in male subjects
Table 4.
Echocardiographic parameter in female subjects
Table 5.
Electrocardiographic characteristics of male subject
Table 6.
Electrocardiographic characteristics of female subject
Table 7.
Diagnostic performance of electrocardiographic left ventricular hypertrophy criteria


 PDF
PDF ePub
ePub Citation
 Print
Print


 XML Download