

 PDF
PDF ePub
ePub Citation
 Print
Print


Introduction
The kidney performs two major functions: First, it participates in the maintenance of a relatively constant extracellular environment that is required for adequate cellular function. This is achieved by the excretion of waste products of metabolism and of water and electrolytes that are derived from dietary intake. Second, it secretes hormones that participate in the regulation of systemic and renal hemodynamics, red cell production, and mineral metabolism1).
The cellular environment is maintained by ion pump in the cellular membrane. For example, the sodium is unable to diffuse freely across the cell membrane. Thus, transmembrane transporter or channels are required for sodium reabsorption to take place.
Renal function is controlled and influenced by cultural factors such as living environment, and dietary habits. Because of special living environment and dietary habits, the Korean's "normal" renal function was different from the western people in the 1960's2). About 40 years ago, Hong et al.2) reported that in Koreans, two thirds of the urine osmolality is contributed by NaCl, while less than 1/3 is by urea. Such composition of urine osmolality is due to a low protein and high salt diet. Nowadays, the Korean's dietary habit has changed because of a westernized life style. In this study, we investigated if there were differences in urine comp osition and omolality according to age.
Materials and Methods
1. Study population
The subjects consisted of 284 Koreans, 142 males and 142 females, living in Chonbuk and Chonnam province in Korea. Their age ranged from 7 to 68 years of age. According to the study subjects' age, groups were defined as follows: group I has patients under 15 years of age, group II between 16 and 20 years, group III between 21 and 30, group IV between 31 and 40, group V between 41 and 50 years, and group VI over 50 years of age. Each group consisted of males and females in similar ratios. We performed routine physical examinations and biochemical analyses on their 24 hour urine samples. A written informed consent was obtained from all subjects. Total body water was calculated by Watson methods [male; 2.45+0.34×Weight (kg)+0.11×Height (cm)-0.095×Age (years), female; -2.1+0.25×weight (kg)+0.11 Height (cm)]3). Chonbuk National University Hospital Ethical Committee approved the protocols used for this study.
2. Chemical analyses of serum and urine sample
Blood and urine electrolytes were measured by ASTRA-8 (Beckman, Utah, USA) and HITACHI 7600-110 (Tokyo, Japan). Blood and urine osmolality was measured by the FISKE Micro-osmometer model 210 (MA, USA). Urine ammonia was measured by the osmometry method4).
3. Statistic analyses
All analyses were conducted using the SPSS Statistical Software Package (version 11.0 : SPSS Inc, Chicago, IL, USA), and all data are expressed as means±SD. Differences in biochemical parameters between groups were assessed by student's t-test. Correlations between 24 hours urine volume, and urine electrolyte excretion were tested by Pearson's correlation. A P value of <0.05 was regarded as significant.
Results
1. Total body water, 24 hour urine electrolytes, osmolality and ammonia excretion according to the age
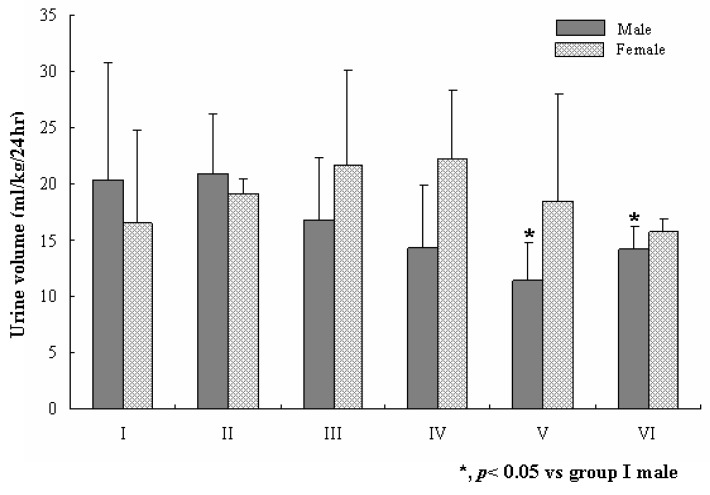
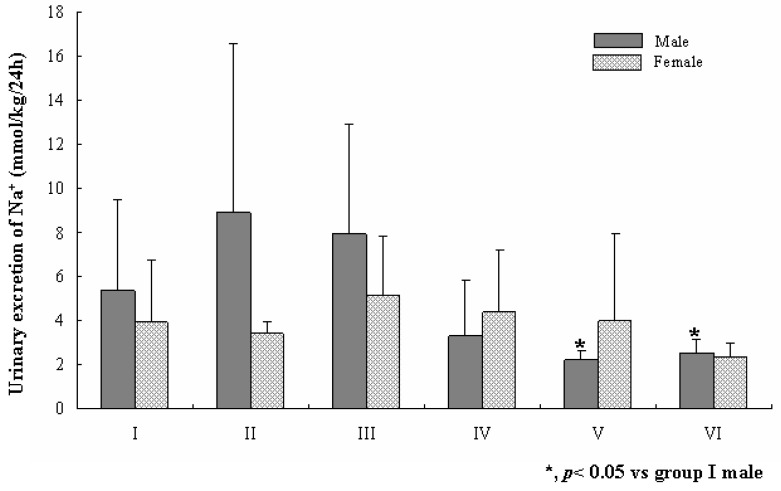
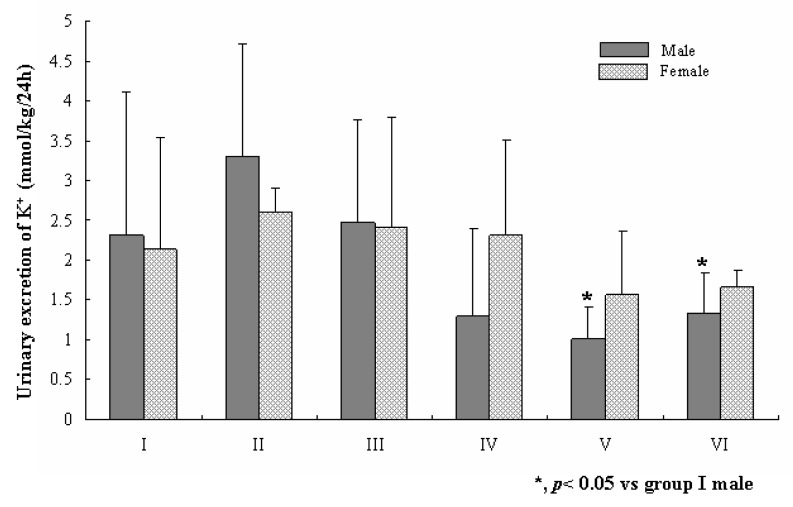
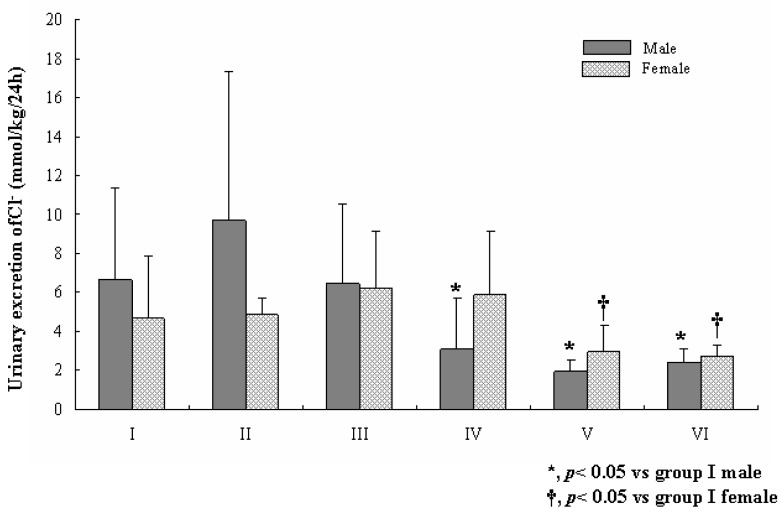
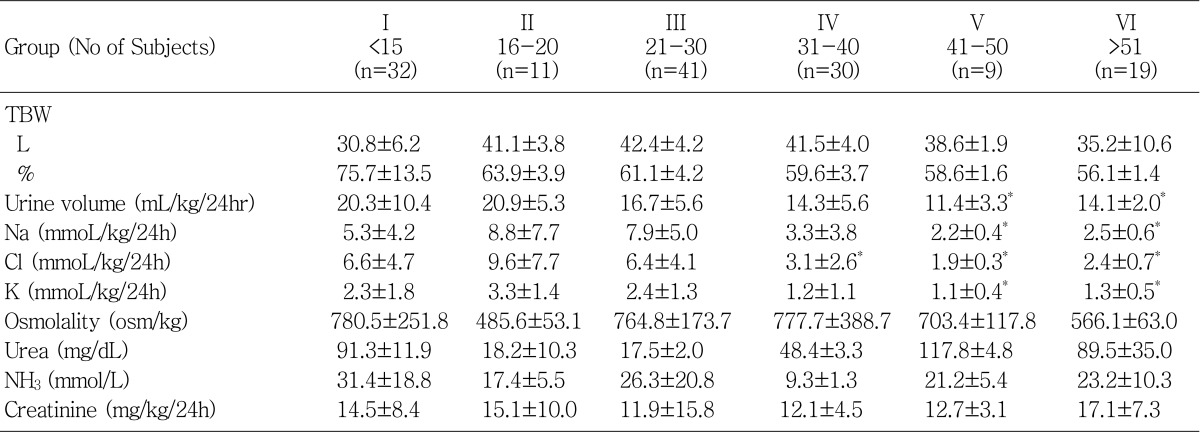
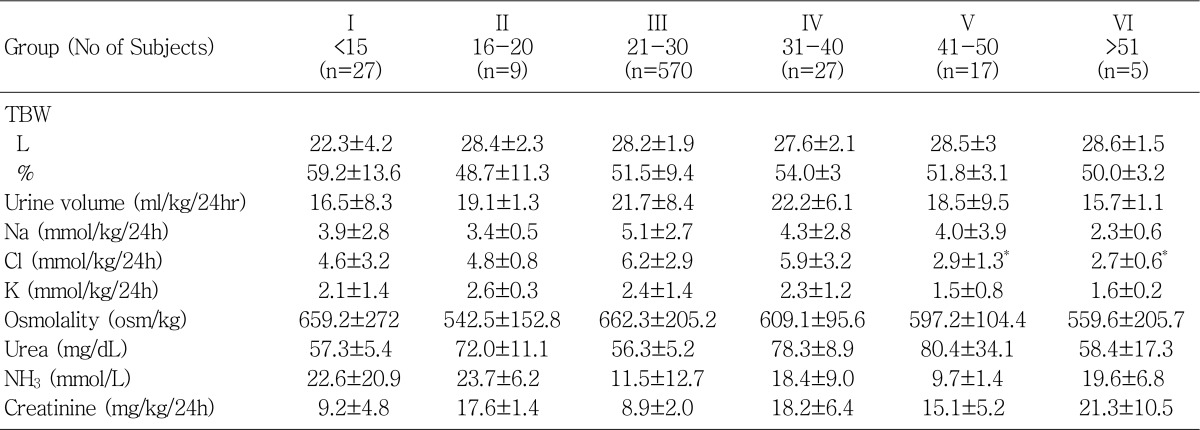
In case of the male, total body water, Na and Cl excretion, urine ammonia excretion were significantly changed between groups. In case of the female, total body water and urine creatinine excretion were significantly changed between groups. The other parameters were similar between both male and female groups (Table 1, 2, Fig. 1-4).
In the groups I and II, the total body water was increased significantly in both males and females. In the group II male, urine volume, Na+ and K+ excretion were not changed compared to the group I male. But, urine osmolality and urea were decreased in the group II males (Table 1). Urine ammonia excretion was 31.4±18.8 mmol/L in the group I males as compared to 17.4±5.5 mmol/L in the group II males, the difference being statistically significant (p<0.05). In the females, urine osmolality was decreased in group II as compared to the group I (Table 2). But, Na+ and K+ excretion were not changed compared to the group I female. Urea was increased in the group II female. Urine ammonia excretion was similar between the groups I and II female (Table 2).
In the groups I and III, Na+ and K+ excretion, urine osmolality, urea and ammonia excretion were similar in the group III males (Table 1). In the females, urine volume, Na+ and K+ excretion, urine osmolality, urea and creatinine excretion were similar in the group III, but urine ammonia excretion were decreased in the group III (Table 2).
In the groups I and IV, urine volume, Na+, K+, Cl- excretion and urea and urine ammonia excretion were decreased in the group IV male (Table 1). In the female, Na+, K+ and Cl- excretion, urea and urine ammonia excretion were increased in the group IV female (Table 2).
In the groups I and V, urine volume, Na+ and K+ excretion and urine ammonia excretion were decreased in the group V male, but urea excretion were increased (Table 2). In the female, K+ and urine ammonia excretion were decreased in the group V (Table 2).
In the groups I and VI, urine volume, Na+, K+ and urine osmolality ammonia were decreased in the group IV male (Table 1). In female, urine volume, Na+ and K+ excretion and urine ammonia excretion were decreased in the group VI (Table 2).
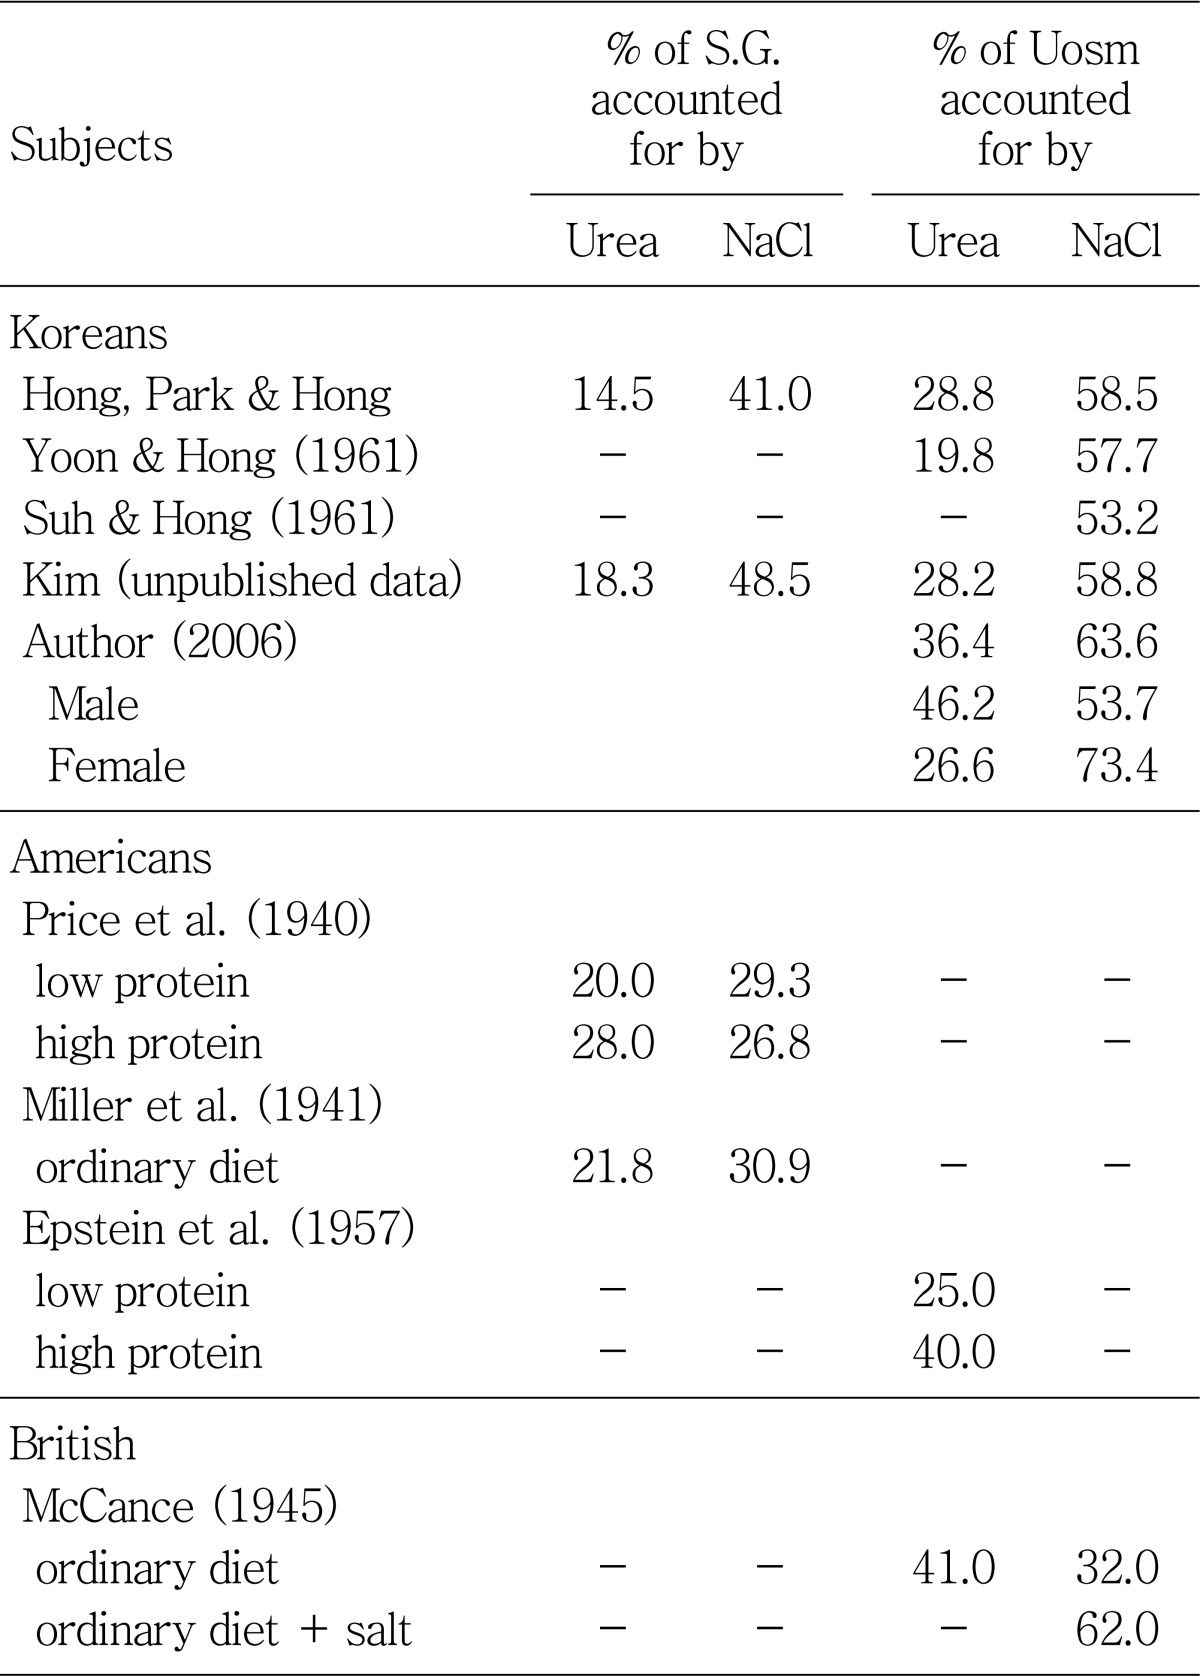
We calculated the urine osmolar contribution of NaCl and urea. Our results showed that NaCl composed 63.6% of total urine osmolality and Urea composed 36.4% of total urine osmolality (Table 3).
2. Correlation between 24 hour urine volume, Na+, K+ and creatinine excretion
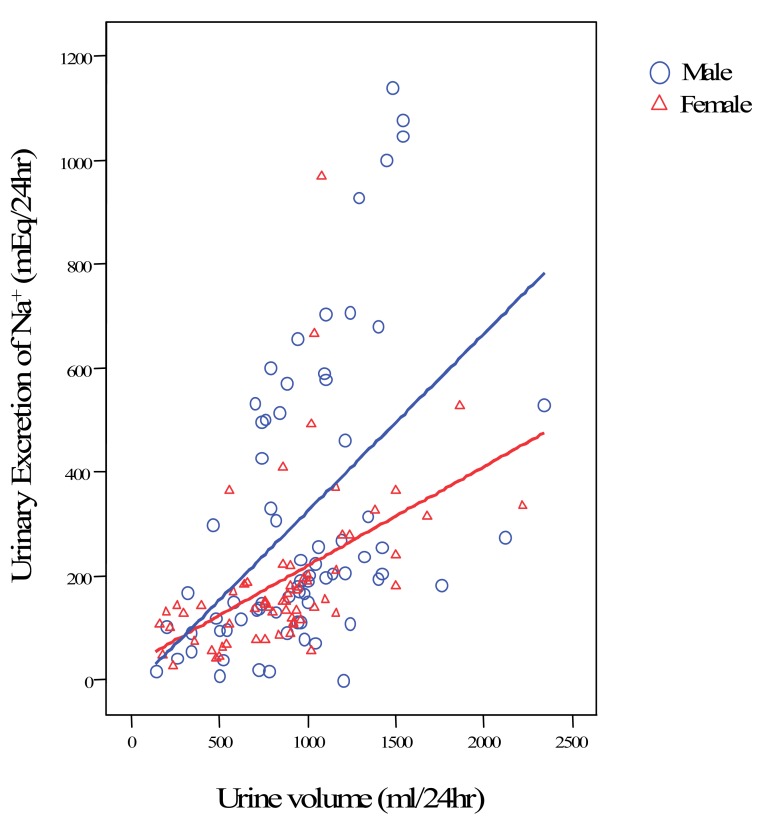
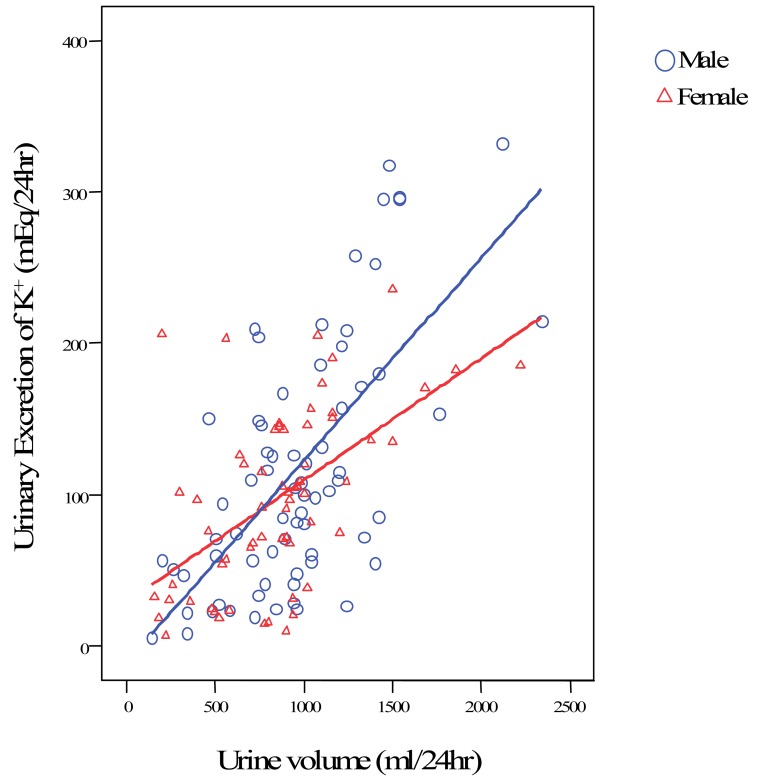
The correlation between 24 hour urine volume and Na+ excretion was significant (male : R=0.487, p<0.001, female : R=0.49, p<0.001) in both the male and female groups (Fig. 5). The correlation between 24 hour urine volume and K+ excretion was significant (male : R=0.657, p<0.001, female : R=0.553, p<0.001) in both the male and female groups (Fig. 6).
Discussion
Urine concentration ability in the renal tubule is influenced by several conditions, such as ADH secretion, water intake, dehydration, or protein intake. The Indicator of urine concentration ability is urine omsolality. Boyarsky et al. reported a urine osmolality of 789 mOsm/kgH2O when 5 units of Pitressin tannate was injected5). Wardener et al. reported that the urine concentrations following the intravenous administration of pitressin were 865 and 885 mOsm/kgH2O in the subjects6). Epstein et al. reported that urine osmolality was 902 mOsm/kgH2O during continuous pitressin infusion7). In the dehydrated state, urine osmolality were 1,400 mOsm/kgH2O in westerners and 1,170 mOsm/kgH2O in Koreans. Some differences are seen in urine osmolality between westerners and Koreans. The osmolar composition of urine in the occidentals indicate that urea is responsible for 56.2% and NaCl is responsible for 43.8%.
Chang et al.8) reported that the 24 hour urine volume was 1,312±50 mL, ammonia excretion was 46±0.02 mg/dL, NaCl excretion was 280.5±0.6 mEq/L, and urine osmolality was 755±21.2 mOsm/kgH2O in a healthy young man in the 1960's. Our results indicate that urine volume is slightly decreased in males and females in the twenties compared to teenager's. Urea excretion in the twenties is slightly decreased in male but in case of female, there was no changes compared to teenager's. Ammonia excretion is slightly decreased in males and females in the twenties compared to teenager's. Our urine Na+ excretion in the twenties is 7.94±5 mmol/kg/24hr in male, 5.12±2.7 mmol/kg/24hr in female. About 40 years ago, Hong et al.2) reported that the urine osmolality accounted for by NaCl is 58.5%, while that by urea was 28.8% in healthy Koreans. In our results, NaCl composed 63.6% of total urine osmolality and Urea composed 36.4% of total urine osmolality. This result indicates that salt may be responsible for two thirds of urine omsolality. The causes are unknown but we postulated that it is due to larger intake of fast food among those in the twenties, and the fact that overall diet habit has not changed since the 1960's.
In conclusion, urine osmolar composition is similar to the 1960's, but further studies are required to elucidate the change of urine composition in this population for another 50 years.
 XML Download