

 PDF
PDF ePub
ePub Citation
 Print
Print


Introduction
Urate (uric acid) is the major inert end product of purine degradation in humans and higher primates in contrast to most other mammals because of the genetic silencing of hepatic enzyme uricase, which is oxidized to water soluble allantoin1), and serum urate concentration is determined by the balance between production and elimination2). The kidney plays a dominant role in urate elimination because it excretes approximately 70% of the daily urate production. Particularly, the renal proximal tubule has an important role in transport of organic anions including urate3).
Renal handling of uric acid in the proximal tubule seems bidirectional, apical absorption via the urate/anion exchanger and basolateral uptake via organic anion transporters4). The organic anion transporter type 1 (OAT1) is expressed at the basolateral membrane of proximal tubular cells and functions as an organic anion/dicarboxylate exchanger that takes up organic anions from the plasma into proximal tubular cells. The organic anion transporter type 3 (OAT3) is also localized at the basolateral membrane of the proximal tubular cells, and may be involved in the transport of endogenous and exogenous organic anions5). Also, OAT3 has been identified as an organic anion/dicarboxylate exchanger similarly to OAT16). In addition, URAT1 is a urate-anion exchanger regulating blood urate levels and has been reported to be expressed in the apical membrane of proximal tubular cells. It may be targeted by uricosuric and anti-uricosuric agents7).
However, the physiologic roles of these urate transporters in regulation of uric acid transport in the kidney are not clearly defined8). Hyperuricemia and gout in humans have important clinical implications because of their pathogenic roles in atherosclerosis and other cardiovascular diseases9). This study was undertaken to investigate in rat kidneys whether the protein abundance of URAT1, OAT1 and OAT3 is affected by the increase in uric acid intake.
Materials and Methods
1. Animals and experimental protocols
We used specific pathogen-free male Sprague-Dawley rats (Orient BIO Co., Korea) weighing 180-220 g. The rats were randomly divided into control (n=6) and uric acid-supplemented (n=6) groups. The control rats were fed regular rat chow 15 g per 180 g BW per day and the uric acid-supplemented rats were additionally given 0.75 g of uric acid (Sigma, St Louis, MO) per 180 g body weight per day for 8 days. Drinking water was freely accessible to both groups. All the rats ate the entire amount of the offered rat chow and showed a steady increase in body weight throughout the study period.
2. Semiquantitative immunoblotting
After the animal experiment, kidneys were harvested and semi-quantitative immunoblotting was carried out from cortical homogenates using polyclonal peptide-derived antibodies to URAT1, OAT1, and OAT3. When the rats were killed, kidneys were rapidly removed for dissection of the cortices. The cortices were placed in 10 mL of ice-cold isolation solution containing 250 mM sucrose, 10 mM triethanolamine (Sigma), 1 ug/mL leupeptin (Sigma), and 0.1 mg/mL phenylmethylsulfonyl fluoride (Sigma) titrated to pH 7.6. The mixture was then homogenized at 15,000 r.p.m. with three strokes for 15 sec using a tissue homogenizer. After homogenization, total protein concentration was measured using the bicinchoninic acid protein assay regent kit (Sigma) and was adjusted to 2 µg/uL with isolation solution. The samples were then stabilized by adding 1 volume of 5× Laemmli sample buffer per 4 volumes of sample and by heating to 60℃ for 15 min.
Initially, 'loading gels' were performed for each sample set to allow fine adjustment of loading amount so as to guarantee equal loading on subsequent immunoblots. A 10 µg aliquot of protein form each sample was loaded into individual lanes, electrophoresed on 12% SDS-polyacryl-amide minigels using a Mini PROTEAN® III electrophoresis apparatus (Bio-Rad, Herculs, CA) and then stained with Coomassie blue dye (G-250, Bio-Rad; 0.025% solution made in 4.5% methanol and 1% acetic acid). After destaining, selected bands from these gels were scanned (GS-700 Imaging Densitometry, Bio-Rad) to determine the density and relative amounts of protein loaded in each lane. Finally, protein concentrations were 'corrected' to reflect these measurements.
For immunoblotting, the proteins were transferred eletrophoretically from unstained gels to nitrocellulose membranes (Bio-Rad). After blocking with 5% skim milk in PBS-T (80 mM Na2HPO4, 20 mM NaH2PO4, 100 mM NaCl, 0.1 percent Tween-20, pH 7.5) for 30 min, membranes were probed overnight at 4℃ with the respective primary antibodies. For probing blots, all antibodies were diluted into a solution containing 150 mM NaCl, 50 mM sodium phosphate, 10 mg/dL sodium azide, 50 mg/dL Tween 20, and 0.1 g/dL bovine serum albumin (pH 7.5). The secondary antibody was goat anti-rabbit IgG conjugated to horseradish peroxidase (31458; Pierce, Rockford, IL) diluted to 1:5,000. Antibody-antigen reaction sites were viewed using an enhanced chemiluminescence substrate (ECL™ RPN 2106; Amersham Pharmacia Biotech, Buckinghamshire, UK). Relative quantification of resulting immunoblot band densities was carried out by densitometry using a laser scanner and ImageQuaNT software (Molecular Analyst version 1.5, Bio-Rad, Hercules, CA).
4. Statistical analysis
Values were presented as mean±SEM. Quantitative comparisons between the groups were made by the Mann-Whitney U test (Statview software; Abacus Concepts Inc., Berkeley, CA). To facilitate comparisons in the semiquantitative immunoblotting, we normalized the band density values by dividing by the mean value for the normal control group. Thus the mean for the normal control group is defined as 100%. p<0.05 was considered as indicative of statistical significance.
Results
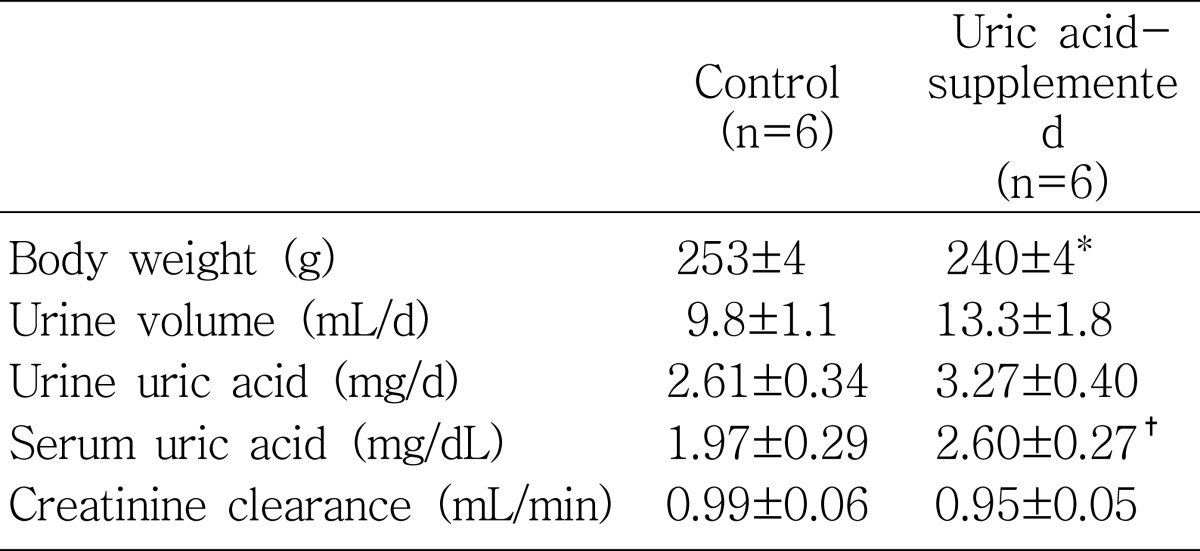
Physiologic parameters measured after the animal experiments are summarized in Table 1. In response to uric acid supplementation for 8 days, serum uric acid level showed an increasing tendency as compared with the control rats (p=0.055). Serum uric acid concentrations were 2.60±0.27 mg/dL in uric acid-supplemented rats and 1.97±0.29 mg/dL in the control rats, respectively. However, the urinary uric acid excretion was not significantly different between the uric acid-supplemented rats (3.27±0.40 mg/d) and the control rats (2.61±0.34 mg/d).
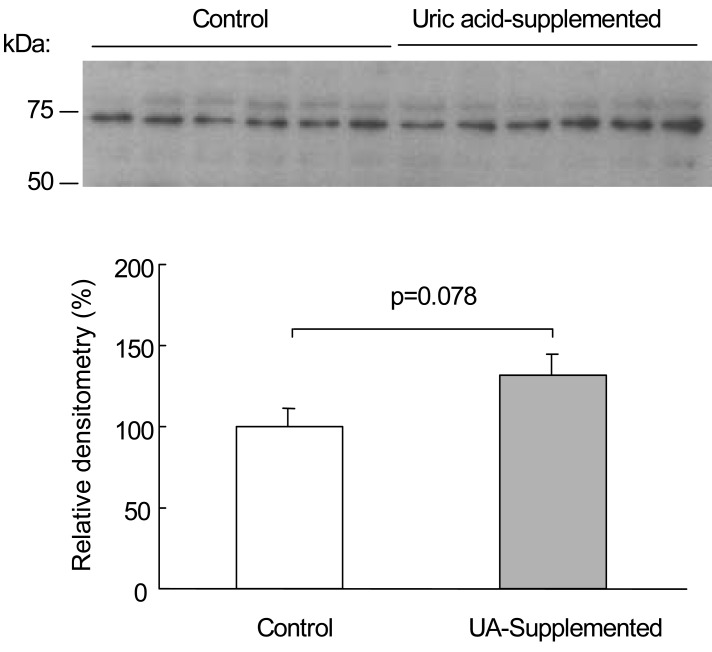
Fig. 1 shows the immunoblot of URAT1 from renal cortical homogenates. The antibody to URAT1 detected a band that corresponded to the UTAT1 protein, with a molecular mass of approximately -75 kD, in the renal cortex. Uric acid supplementation for 8 days resulted in an insignificant change in URAT1 protein abundance in the renal cortex. Relative densitometry revealed that the URAT1 protein abundance in the uric acid-supplemented rats was 132±14% (p=0.078, Fig. 1).
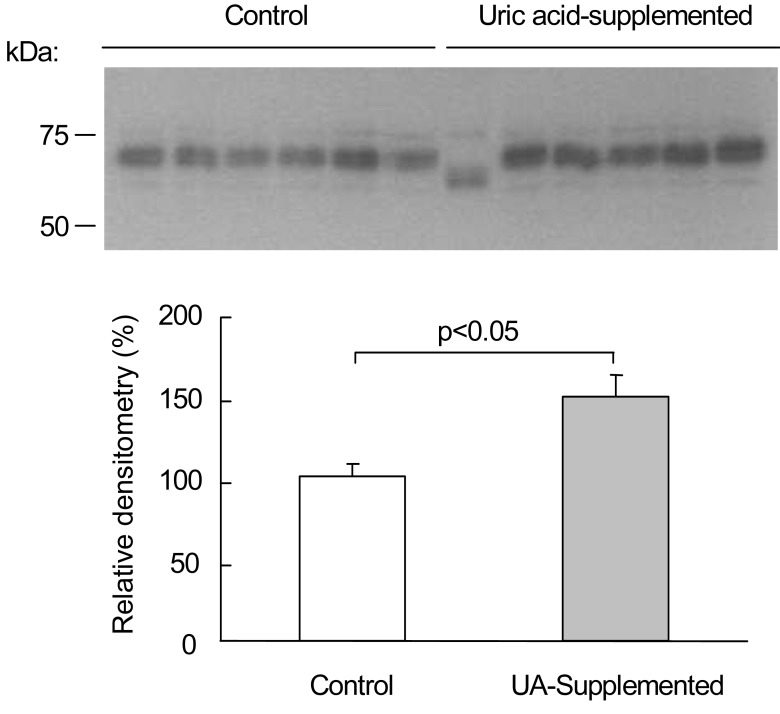
Notably, OAT1 protein abundance was significantly increased in response to uric acid supplementation. Fig. 2 shows the immunoblot of OAT1 from renal cortical homogenates. The antibody to OAT1 detected a specific band that corresponded to the OAT1 protein, with a molecular mass of approximately -70 kD, in the renal cortex. Uric acid supplementation for 8 day resulted in a significant increase in OAT1 protein abundance in the cortex. OAT1 protein abundance was significantly (p=0.037) increased in the uric acid-supplemented rats (148±13%) compared with the control rats (100±8%).
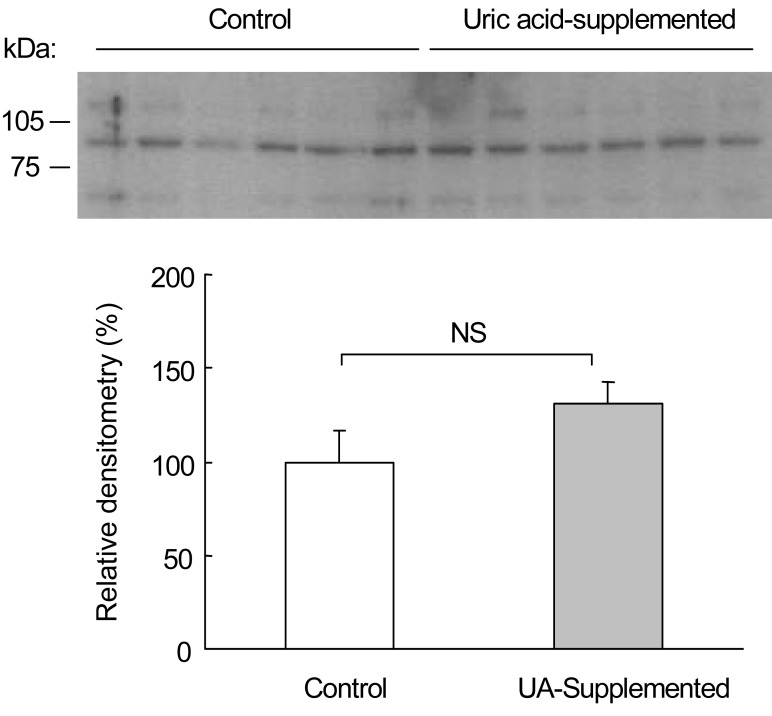
We also carried out OAT3 immunoblotting from the rat kidneys. Fig. 3 shows the immunoblot of OAT3 from renal cortical homogenates. OAT3 protein abundance was not significantly different between the uric acid-supplemented rats (131±12%) and control rats (100±17%).
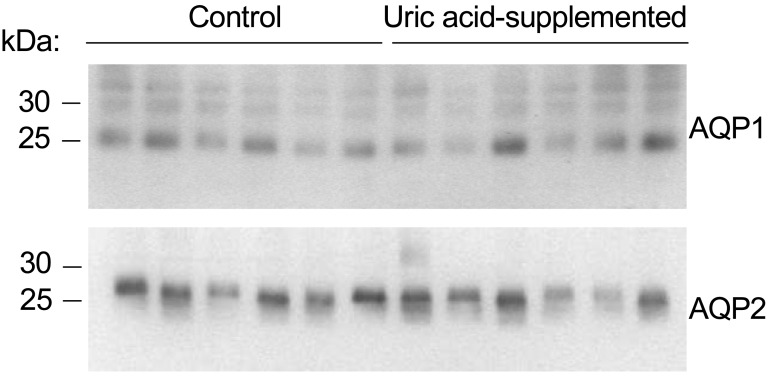
Throughout the study period, both the control and uric acid-supplemented rats showed a steady increase in body weight: from 198±2 g to 253±4 g in the control rats and from 199±2 g to 240±4 g in the uric acid-supplemented rats. Thus, the amount of weight gain was significantly lower in the uric acid-supplemented rats than in the controls (p<0.05). Although the daily urine output was not significantly different between the two groups (Table 1), it was significantly larger in the uric acid-supplemented rats than in the controls (55.0±6.9 vs. 38.7±3.9 µL/g/d, p<0.05) when it was expressed per g body weight. Creatinine clearance showed no difference between the two groups.
This relative difference in urinary concentration led us to carry out immunoblotting against water channels aquaporin 1 and aquaporin 2. The immunoblot results shown in Fig. 4 revealed that both aquaporin 1 and aquaporin 2 protein abundances had no significant differences between the control and uric acid-supplemented rats.
Discussion
We examined the effects of uric acid supplementation on the abundance of OAT1, OAT3, and URAT1 proteins in the kidney using semi-quantitative immuoblotting. The results showed that OAT1 protein abundance in the renal cortex was significantly increased by uric acid supplementation whereas URAT1 and OAT3 protein abundances were not significantly affected.
Although urate may have beneficial effects in conjunction with genetic or environmental factors, such as scavenging potential harmful radicals in our body12, 13), it can cause significant health problems, including complications associated with urate crystals such as kidney stones and gout. Humans are the only mammals in whom gout is known to develop spontaneously, probably because hyperuricemia only commonly develops in humans14). The absence of uricase, combined with extensive reabsorption of filtered urate, results in urate levels in human plasma that are approximately 10 times those of most other mammals15). Urate accumulation in the higher primates has been proposed to have evolutionary advantages. However, hyperuricemia can be detrimental in human, as demonstrated by its proven pathogenetic roles in gout and nephrolithiasis and by its putative roles in hypertension and other cardiovascular disorders16). Thus, we tried our animal model of urate excess to investigate renal adaptation on the level of urate transporters.
There is general agreement that virtually all urate transport occurs in the renal epithelial cells of the proximal convoluted tubule. Since transport is bidirectional, urate anions must be capable of moving both from lumen to blood and from blood to lumen at this site17). Although reabsorption and secretion may occur simultaneously within a single cell under specific conditions, there is direct evidence that net reabsorption occurs in the early part of the proximal convoluted tubule (S1 region), net secretion in the S2 region and post-secretory reabsorption, if it exists, in the later part (S3 region) of this section of the nephron18, 19). The rOAT1, which is mainly located in S2, constitutes a specific mechanism for the secretion of urate from the blood to the lumen at the proximal tubules17). Our result of increased abundance of rOAT1 in response to uric acid supplementation suggests the contributory role of rOAT1 to enhance urate secretion to relieve the state of urate excess. On the other hand, the rOAT3 has different localization in the basolateral membranes of the proximal tubules20). Since it is distributed over S1, S2, and S3 segments, the contributions of rOAT1 and rOAT3 in the basolateral uptake of organic anions may differ.
As a new member of the OAT family, URAT1, may act for urate reabsorption7) in the kidney, where the protein is located at the apical (luminal) membrane of the epithelium of proximal tubules. The URAT1 has been demonstrated to be located on the brush borders of apical membranes of the proximal tubule and may constitute a specific mechanism for the reabsorption of urate from the lumen (extracellular) to the cytosol (intracellular) at the proximal tubule. Initially we hypothesized that URAT1 might be down-regulated in response to uric acid supplementation. However, our results showed that the URAT1 was not altered by uric acid supplementation at least on the level of transporter protein abundance.
In conclusion, among the uric acid transporters in the rat kidney, OAT1 may have a regulatory role in response to the increase in uric acid intake in the rat kidney. The up-regulation of OAT1 would exert to stimulate urinary uric acid excretion and might contribute to protection from hyperuricemia. Therapeutics that are designed to modify OAT1 activity for enhancing secretion of uric acid might be useful in treating pathologies that are associated with hyperuricemia and gout.
 XML Download