

 PDF
PDF ePub
ePub Citation
 Print
Print


Introduction
Acid-base disturbances, especially metabolic acidosis are common in severely injured and critically ill patients. Conventional measures, such as anion gap and base deficit are calculated values that are used to identify the presence and degree of acidosis and to guide corrective therapy. Physicochemical analysis is an alternative approach based on the principles of electroneutrality and conservation of mass, and may be accurate for defining the presence and type of acidosis and unmeasured anions.
We sought to apply these physicochemical principles to analyze the acid-base status of the intensive care unit (ICU) patients and hemodialysis (HD) patients and compare the results with conventional analysis between the ICU and HD group.
Materials and Methods
We studied the ICU and HD patients with metabolic acidosis at Eulji University Hospital from the first of August 2006 to the 31st of August 2006.
The study was approved by the ethical committee of the Eulji University Hospital and written informed consent was obtained from patients and legal representatives.
Patients with metabolic acidosis were identified from the fasting venous and arterial blood samples. The hemodialysis patients with metabolic acidosis were identified from the pre-hemodialysis fasting venous and arterial blood samples.
Serum chemistry, serum electrolyte, and serum magnesium were measured using standard laboratory techniques. Plasma lactate concentrations were determined by an enzymatic method (Cobas, Swizerland) with reference value 0.5-2.2 mmol/L, detection limit 0.2 mmol/L.
Hyperchloremia was defined as serum chloride concentration of ≥110 mmol/L, and hyperlactatemia as serum lactate concentration of >2 mmol/L.
Physicochemical Approach (Stewart Method)
* Anion gap observed (AGobs)=(Na+K)-(Cl+HCO3)
* albumin corrected anion gap (AGalb-corr)=AGobs+2.5 (4.5-albumin)
* albumin and lactate-corrected anion gap (AGcorr)=AGobs+2.5 (4.5-albumin)-lactate
* Base deficit corrected for unmeasured anions (BDua)
: The base-deficit (BD) was calculated as the negative of the standard base-excess reported from the blood gas analyzer 8). Base deficit (BD) was corrected for free water, chloride, and albumin concentration.
: BDua=BD-(BEfw+BEcl+BEalb)=BD-0.3×(Na-140)-[102-(Cl×140/Na)]-3.4×(4.5-alb)
* Strong ion difference apparent (SIDa) is simply the difference between the activity of all abundant cations (Na+, K+, Mg2+, Ca2+) and the activity of all abundant anions (Cl-, lactate, urate). Normally this difference is approximately 40 mEq/L.
: SIDa=Na++K++Mg2++Ca2+-Cl-corrected-lactate-urate-[UA-]
(all in mEq/L)
In this equation, [UA-] represents the concentration of the unidentified strong anions (e.g. ketoacids, lactate and exogenous substances etc.). Since urate is typically not an important factor (<0.2 mEq/L), it is usually omitted.
- Clcor = Clmeasured×(Nanormal/Naobserved)=Clmeasured×(142 mEq/L/Naobserved)
- In this study, we used SIDa=Na++K++Mg2++Ca2+-Cl-corrected-lactate, simplified SIDa=Na++K+-Cl-corrected-lactate.
* Strong ion difference effective (SIDe) is given by the relationship of pH, CO2, phosphate, and protein. Therefore, [SID]e is a measure of the remaining anions, (ie, normally -40 mEq/L). Serum albumin and inorganic phosphate mainly represented total concentrations of the weak nonvolatile weak acids (Atot).
SIDe = HCO3-+Atot = HCO3-+albumin+PO4- = HCO3-+[alb×(0.123×pH-0.631)]+phos×(0.309×pH-0.469)] = [1000×2.46×10-11×pCO2/10-pH]+[alb×(0.123×pH-0.631)]+phos×(0.309×pH-0.469)]
* Strong ion Gap (SIG)=SIDa-SIDe
Both the BD and SIG become more positive as the concentration of unmeasured-anions increases.
Statistical analysis
Data were collected from patient charts and the hospital computer system. All statistical analyses were performed using software from SPSS 11.5. Data are presented as mean±SD. Statistical analysis was preformed using the student's t-test and chi-square test where appropriate. A p-value<0.05 was considered statistically significant.
Results
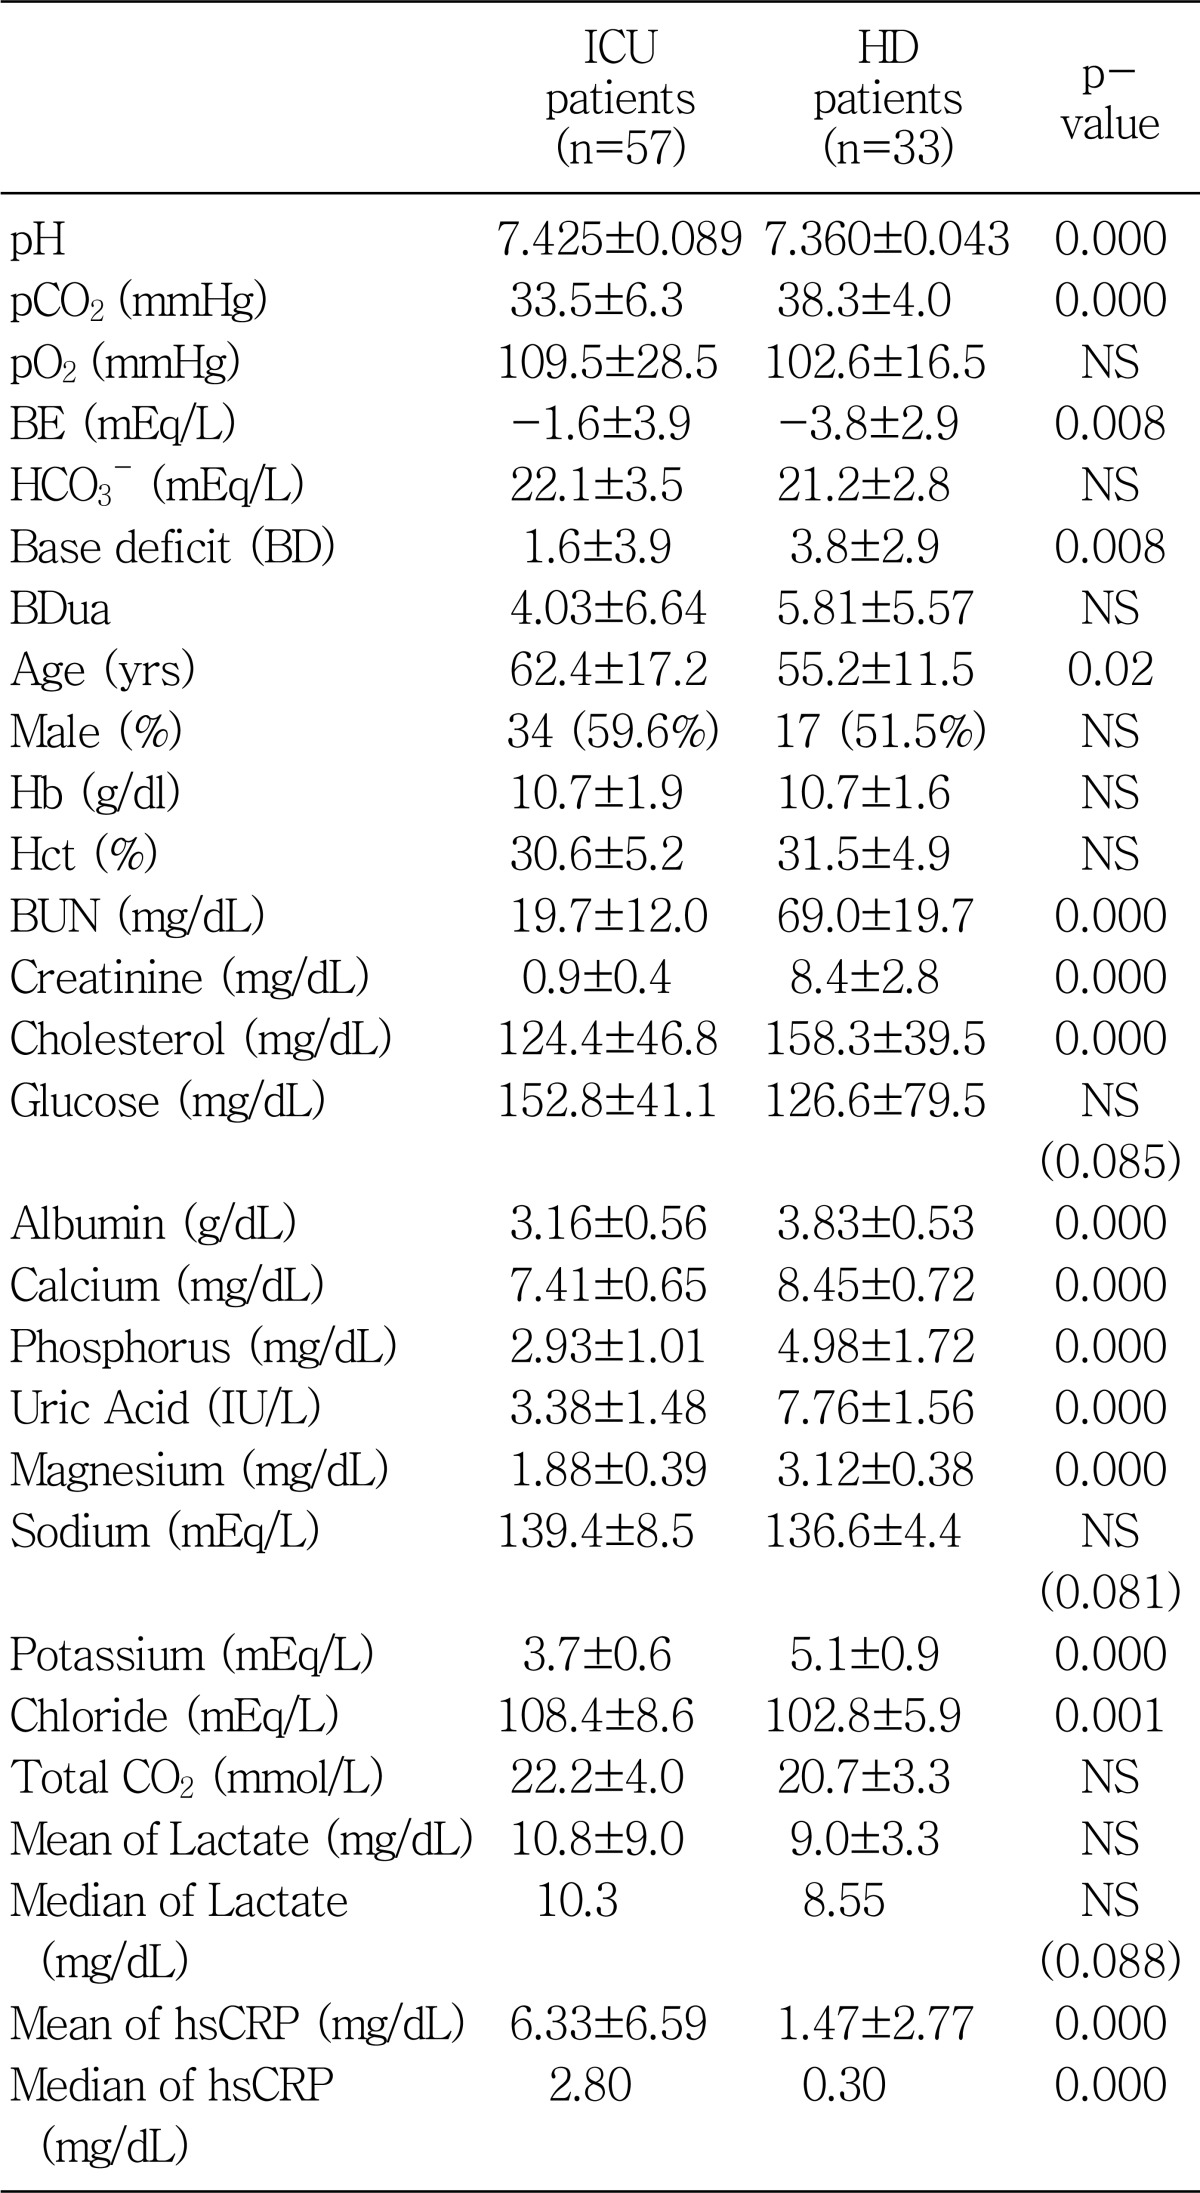
Fifty-seven ICU patients and 33 HD patients were enrolled in this study. Patients characteristics, acid-base and electrolyte data for the study population are presented in Table 1. The ICU patients showed significantly higher pH (7.425±0.089 vs 7.360±0.043) with lower pCO2 (33.5±6.3 vs 38.3±4.0) and lower base deficit (1.6±3.9 vs 3.8±2.9) compared with the HD patients (Table 1). But, the base deficit corrected for unmeasured anions (Bdua) was comparable between the two groups. The HD patients showed higher BUN, creatinine, cholesterol, glucose, albumin, calcium, phosphorus, uric acid, magnesium, and potassium, except for lower chloride and median hsCRP compared with the ICU patients (Table 1).
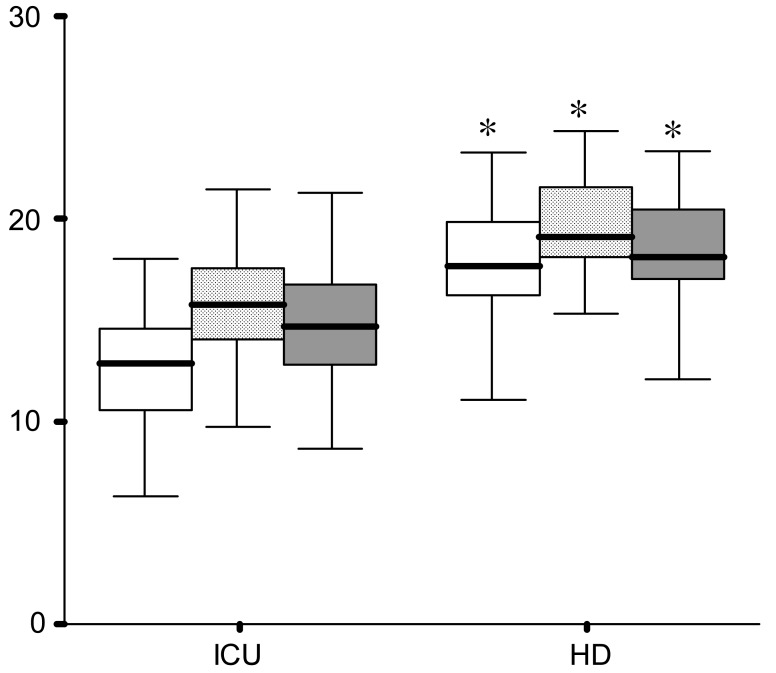
Anion gap observed (AGobs), albumin-corrected AG, and albumin and lactate-corrected AG were significantly decreased in the ICU group (12.6±3.3, 16.0±2.9 and 14.8±3.0 respectively) compared with the HD group (17.7±3.8, 19.4±3.3 and 18.4±3.4 respectively) (p=0.000, Fig. 1).
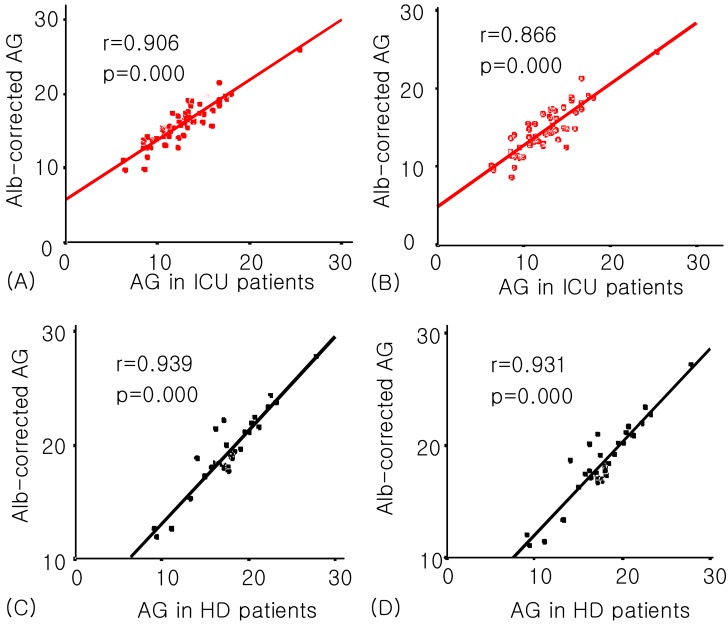
AGobs was significantly correlated with AGalb-corr and AGcorr in both groups, but the correlation coefficients for the ICU group were decreased when the serum lactate levels were used together (AGcorr) (Fig. 2).
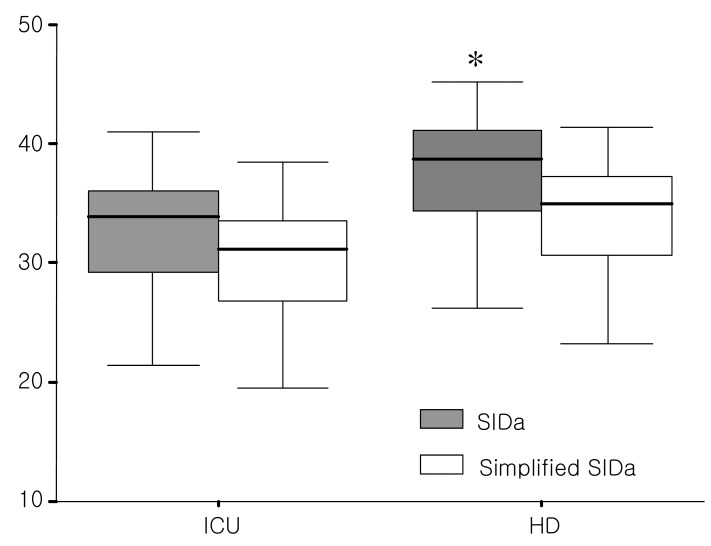
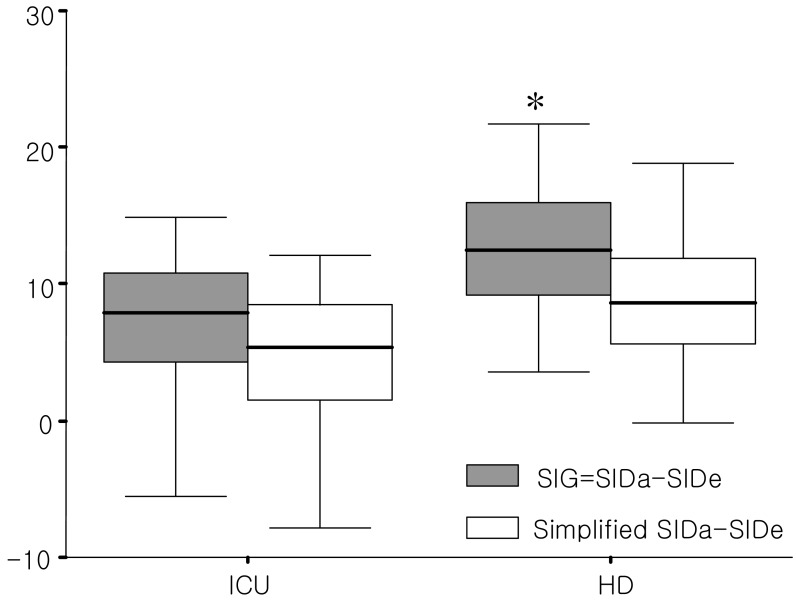
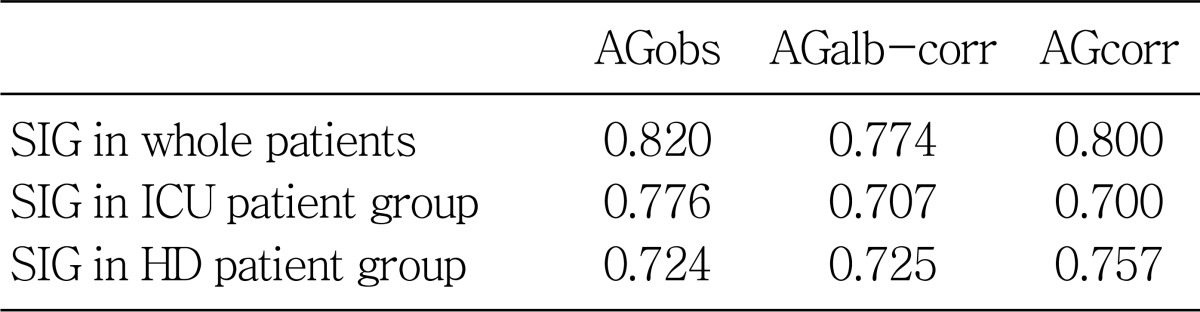
The strong ion difference apparent (SIDa) was significantly higher in the HD group than the ICU group (37.5±5.3 vs 33.9±9.0, p=0.045, Fig. 3). On the other hand, the strong ion difference effective (SIDe) was comparable between the ICU and HD group (24.7±3.5 vs 25.2±2.9). Therefore, the strong ion gap (SIG) was significantly higher in the HD group than the ICU group (12.3±5.3 vs 8.6±8.8, p=0.043, Fig. 4). SIG in ICU group showed the highest correlation coefficient with AGobs, whereas SIG in HD group with AGcorr (Table 2).
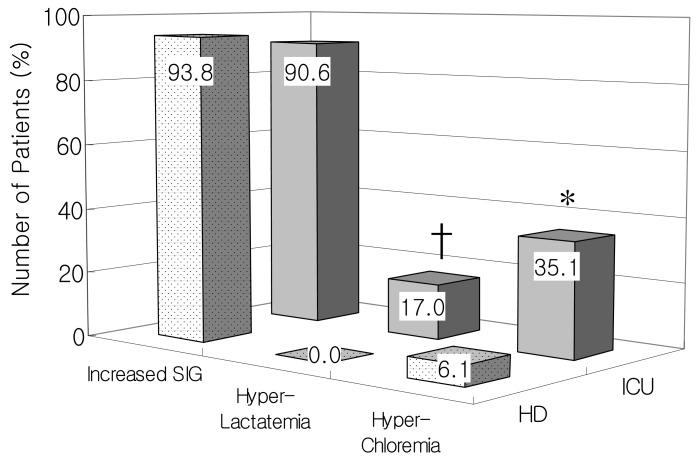
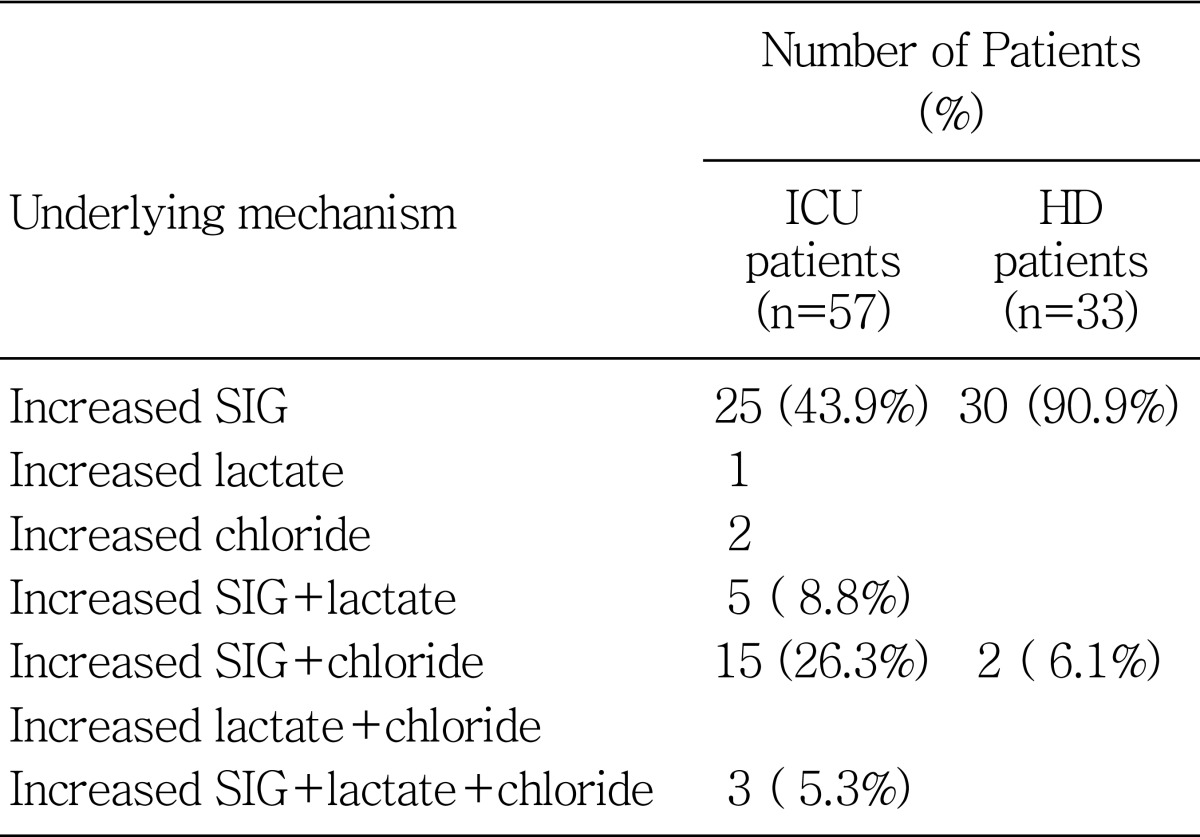
The contributions of the three main causes of metabolic acidosis (hyperchloremia, hyperlactatemia, and increased levels of other unmeasured strong anions) were presented in Table 3. Increased SIG was comparable between the ICU group (n=48, 90.6%) and the HD group (n=30, 93.8%). Hyperlactatemia (n=9, 17.0% vs n=0, 0%) and hyperchloremia in the ICU group (n= 20, 35.1% vs n=2, 6.1%) showed significantly increased numbers of patients compared with the HD group (Fig. 5).
Discussion
We conducted this study to compare the clinical significance of SIG between adult ICU patients and maintenance HD patients with metabolic acidosis.
Several clinical and biologically relevant findings emerged in this study. First, the conventional AGobs levels showed a decreased correlation coefficient with the AGcorr levels in the ICU group, which suggested that hyperlactetemia was main contributing mechanisms in the ICU group than the HD group.
Second, the HD group showed significantly higher SIDa and SIG levels compared to those in the ICU group. This result may represent unmeasured anions was the main mechanism of metabolic acidosis in HD patients.
Third, AGobs, AGalb-corr, AGcorr, SIDa and SIG levels were significantly increased in the HD patient group than the ICU patient group in our study. In conventional method by AGobs, the results mean that hyperkalemia and hypochloremia made the higher AGobs metabolic acidosis in the HD group than the ICU group. Using physicochemical method by SIDa and SIG, the results mean that hypermagnesemia and hypercalcemia including hyperkalemia and hypochloremia were included in these mechanisms.
Fourth, concerning the contributions of the three main causes of metabolic acidosis, number of patients with increased positive SIG was comparable between the ICU and HD group, whereas hyperlactatemia and hyperchloremia was significantly increased in the ICU group compared with the HD group. In relation to these etiology, lower SIDa and SIG levels were seen in the ICU group compared to those in the HD group.
Fifth, SIG in ICU group showed the highest correlation coefficient with AGobs, whereas SIG in HD group with AGcorr. These results suggest that selecting different diagnosing tools is needed to understand and explain the metabolic acidosis according to patient population.
Acid-base balance evaluation according to the Henderson-Hasselbalch equation enables us to assess the contribution of respiratory (pCO2) and/or nonrespiratory (metabolic, HCO3-) components to the acid-base balance status. A new approach to acid-base balance 'evaluation according to Stewart-Fencl, which is based on a detailed physicochemical analysis of body fluids, defined three independent variables that enable us to accurately define metabolic disturbances of the acid-base balance. The main physicochemical principle, which must be accomplished in body fluids, is the rule of electroneutrality. There are 3 components in biological fluids which are subject to this principle : a) water, which is only in minor parts dissociated into H+ and OH-, b) 'strong', i.e. completely dissociated, electrolytes, which therefore do not interact with other substances, and body substances, such as lactate, and c) 'weak', i.e. incompletely dissociated substances1). Therefore 3 independent variables are: One is the SIDa, and the second is total concentrations of the weak non-volatile weak acids (Atot), represented mainly by albumin and inorganic phosphate. Raising Atot while holding SIDa constant causes metabolic acidosis (and vice versa); also, lowering plasma SIDa while holding Atot causes metabolic acidosis (and vice versa)2). Third, respiratory acid-base balance disturbances are assessed according to pCO2, in the same way as in a conventional approach3).
To obviate these concerns, the Stewart approach, later modified by Figge, Fencl and Watson, was developed. This approach is based on the principles of electroneutrality and conservation of mass4). Quantitative physicochemical analysis of the results was preformed with Stewart's quantitative biophysical methods as modified by Figge et al. to take into account the effects of plasma proteins. This method involves first calculating the SIDa. SIDa is simply the difference between the activity of all abundant cations (Na+, K+, Mg2+, Ca2+) and the activity of all abundant anions (Cl-, lactate, urate). Normally this difference is approximately 39±1 mEq/L. Values lower than 38 express metabolic acidosis and values over 40 mean metabolic alkalosis3, 5). This equation, however, does not take into account the role of weak acids (CO2, albumin and phosphate) in the balance of electrical charges in plasma water. This is expressed through the calculation of the SIDe. Therefore, SIDe is a measure of the remaining anions, i.e. normally -40 mEq/L. The formula for SIDe was as determined by Figge et al. This formula quantitatively accounts for the contribution of weak acids to the electrical charge equilibrium in plasma. The relative balance of plasma positive and negative charges drives water association and dissociation by the law of mass action6). Once weak acids are quantitatively taken into account, the SIDa-SIDe should equal 0 (electrical charge neutrality) unless there are unmeasured charges to explain this "ion gap". Such charges are described by the SIG. A positive value for SIG must represent unmeasured anions (sulfate, keto acids, citrate, pyruvate, acetate, gluconate, etc.) exceeding unmeasured cations in the circulation that must be included to account for the measured pH. When the SIG is less than zero, cations exceed anions1, 5-7).
Lactate is considered a useful indicator of illness severity and a useful predictor of mortality rate. However, lactate measurements are not immediately and easily available in all ICUs. Therefore, the conventional anion gap (AG) and base excess (BE) have been used to predict lactate levels. However, the AG is considered a poor predictor of hyperlactatemia in the critically ill because of the confounding effects of hypoalbuminemia, the presence of unmeasured anions, the degree of hyperlactatemia targeted for detection, and the multifactorial nature of any acidosis7).
Stewart-Figge methodology has been found to be useful in explaining acid-base changes in various clinical situations, where conventional analysis was deficient. The SIG is not artificially affected by conditions such as alkalosis, hypoalbuminemia, or dehydration. By contrast, these conditions are known to affect the anion gap artificially5). The source of acidosis in a broad range of critical illness remains unknown. Lactic acid accounts for only a fraction of the acidosis seen in these conditions. The curious presence of unidentified anions in the circulation represents a potential mechanism of acidosis. The concepts inherent in the strong ion difference dictate that an addition of anions to the circulation will increase the hydrogen ion concentration either by bringing hydrogen ions with them or by increasing water dissociation5). Therefore, Stewart's approach not only explains fluid induced acid-base phenomena, but also provides a framework for the design of fluids for specific acid-base effects8-11).
Classically, metabolic acidosis is defined as a decrease in blood pH secondary to a decrease in the bicarbonate concentration. The decrease in bicarbonate concentration may be secondary to an excess of acids that will consume bicarbonates, reflecting the open character of this buffering system, or to a loss of bicarbonates through the digestive or the renal route12). According to this theory, metabolic acidosis may be secondary to a decrease in the SIDa (increase in Cl-, lactate, or other strong anions) or to an increase in weak acids (mainly hyperphosphatemia). On the other hand, hypoalbuminemia, which is very common in ICU patients, may obscure the presence of strong ions because it has an alkalizing effect. Acidosis resulting from advanced renal insufficiency is called uremic acidosis. Thus the hallmark of uremic acidosis is a diminished GFR. The acidosis of advanced renal failure characteristically presents a high anion gap (normochloremic acidosis) caused by accumulation of sulfate, phosphate, and organic anions. However, the accumulation of these anions per se is not the cause of the acidosis. Metabolic acidosis would not disappear if these anions were removed, for example, by dialysis. Reduction in renal acid excretion and accumulation of uremic anions are both the result of reduced renal function, but not causally related to each other13).
In our study, the mean SIG values were 8.6 mEq/L among ICU patients and 12.3 mEq/L among HD patients. Measurement technology also might be responsible for these differences, as the mean SIG value for critically ill patients reported in the literature can vary from 0 to 13 mEq/L5, 7, 14, 15) and its calculation requires the measurement of nine variables.
In conclusion, the physicochemical approach can elucidate the mechanisms of metabolic acidosis in ICU and HD patients compared with conventional measures. Complex acid-base disorders are easier to understand, explain, and rationalize using Stewart's methods compared with the traditional model. Advances in basic chemistry, mathematics, and computer science may yet provide new insight into a complex acid-base problem.
 XML Download