

 PDF
PDF ePub
ePub Citation
 Print
Print


Introduction
Metabolic alkalosis is a primary acid-base disturbance manifested as an elevated arterial pH and increased PaCO2 due to alveolar hypoventilation. A retrospective study of arterial blood gases in hospitalized patients showed that metabolic alkalemia was the most common acid-base disturbances, occurring in 51% of the abnormal cases1). Metabolic alkalosis may occur due to elevated plasma HCO3- concentration that is usually induced by H+ loss from the gastrointestinal tract (i.e. vomiting or nasogastric suction) or from the kidney (i.e. diuretic therapy). Metabolic alkalosis may also be produced in bicarbonate retention, hydrogen ion movement into the cells, or in certain forms of volume contraction2). In both medical and surgical patients, alkalemia is most likely to occur in patients who are sicker and have had a complicated hospital course. The mortality rate among medical patients exceeded that of surgical patients when the pH level was greater than 7.48. There was an inverse correlation between the pH value and the prognosis3).
Mannitol is a 6-carbon alcohol with a molecular weight of 182. For being an obligatory solute, mannitol may be used either as an osmotic diuretics to maintain water excretion, or to reduce the cerebral edema or intracranial pressure in cerebrovascular disease; a rapid infusion of 20% mannitol solution has been widely used4). Although various studies on the effectiveness of mannitol have been performed, there are few reports on acid-base disorder in Korea. This study is based on acid-base and electrolyte changes seen after the intravenous infusion of hypertonic mannitol was given for the prevention of cerebral edema.
Materials and Methods
The patients, who were hospitalized at Chonbuk National University Hospital for the symptoms and signs of cerebral hemorrhage from January 2005 through December 2005, were enrolled in this study. The diagnosis of cerebral hemorrhage was made based on the characteristic symptoms (e.g., headache, vomiting, hemiparesis etc.), and focal neurologic signs. In some cases the diagnosis of cerebral hemorrhage was documented by brain computed tomography. Among 21 patients, 7 patients were diagnosed as acute subdural hematoma, 6 as intracranial hematoma, and 8 as subarachnoid hemorrhage.
2. Study protocol
The study was a retrospective, open labeled controlled trial. Patients were randomly assigned to various amounts of 15% mannitol to be administered. Group A had 300-900 mL of 15% mannitol infused over 60 to 90 minutes. Group B had 1,200-2600 mL over 12 to 24 hours. Group C had 3,200-4,900 mL over more than 24 hours. Arterial blood samples for arterial blood gas analysis (Nova biotech; El Cajon, CA, USA) were obtained. The serum electrolytes, BUN and creatinine were also measured by ASTRA-8 (Beckman; Fullerton, CA, USA). The serum and urine osmolality were measured by osmometer (Advanced; Norwood, MA, USA).
Results
1. Patients
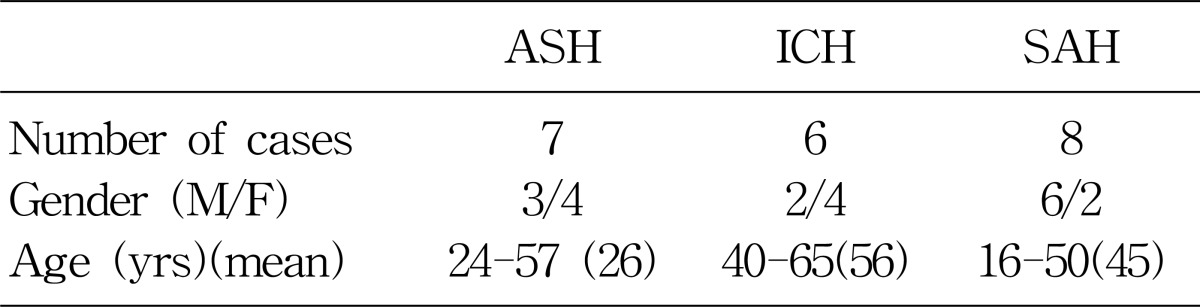
There were 21 patients enrolled for the study and patients' profiles were described in Table 1. There were 11 male and 10 female patients.
2. Acid-base and electrolyte changes after the infusion of 15% mannitol over the period of 60 to 90 minutes
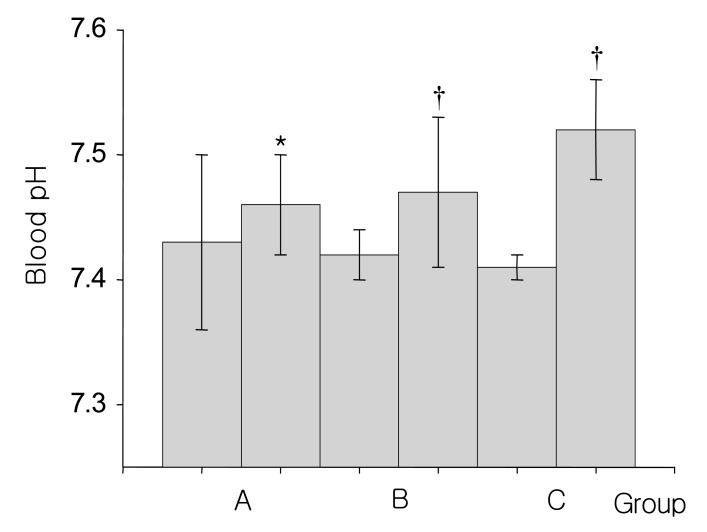
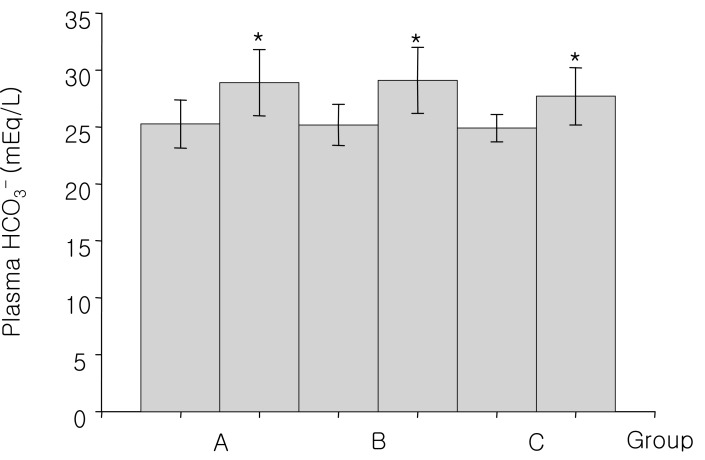
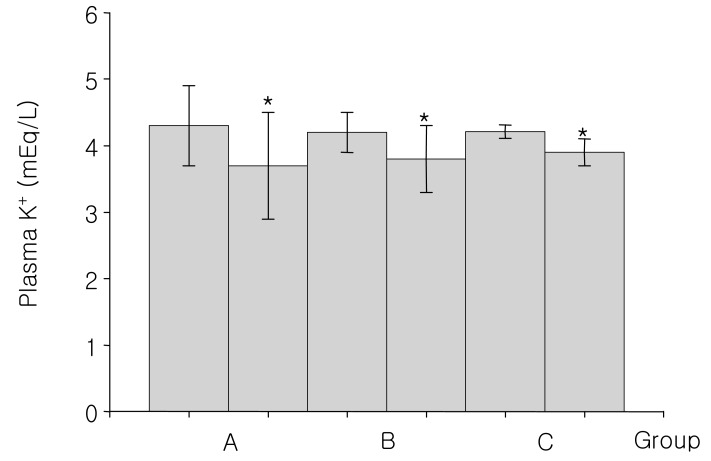
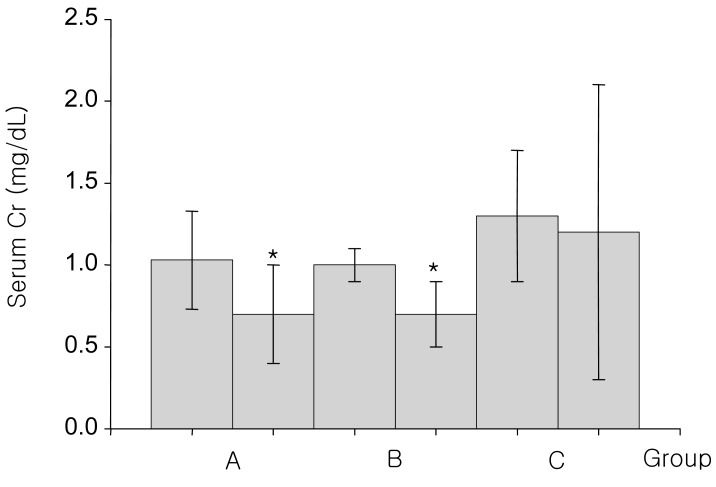
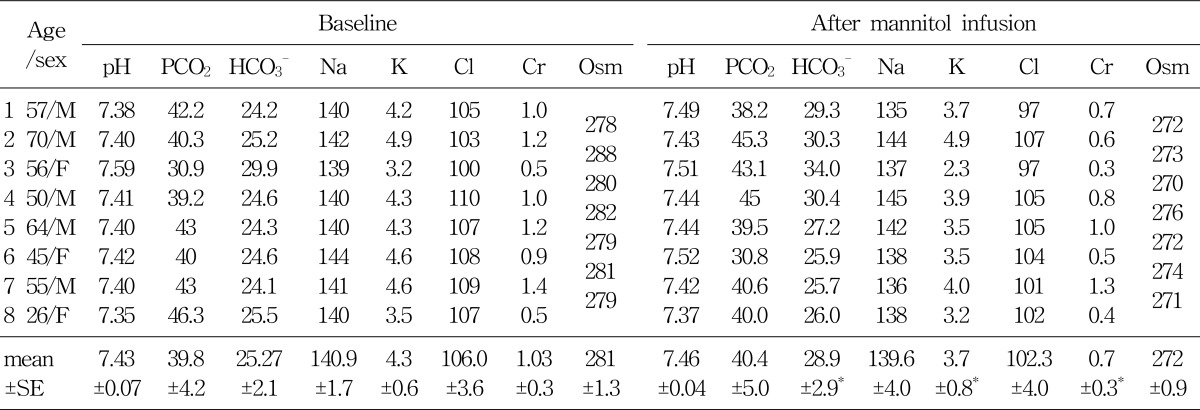
Group A, consisted of 8 patients, were infused with 300-900 mL of the 15% mannitol over the period of 60 to 90 minutes. The baseline mean blood pH was 7.43±0.07. At 90 minutes after 15% mannitol infusion, blood pH increased significantly to 7.46±0.04; The serum HCO3- increased significantly from 25.3±2.1 mEq/L to 28.9±0.6 mEq/L; Serum potassium level decreased significantly from 4.3±0.6 mEq/L to 3.7±0.8 mEq/L; Serum creatinine level decreased from 1.03±0.3 mg/dL to 0.7±0.3 mg/dL. The changes seen in creatinine level may be due to an increased glomerular filtration rate (Table 2).
3. Acid-base and electrolyte changes after the infusion of 15% mannitol over the period of 12 to 24 hours
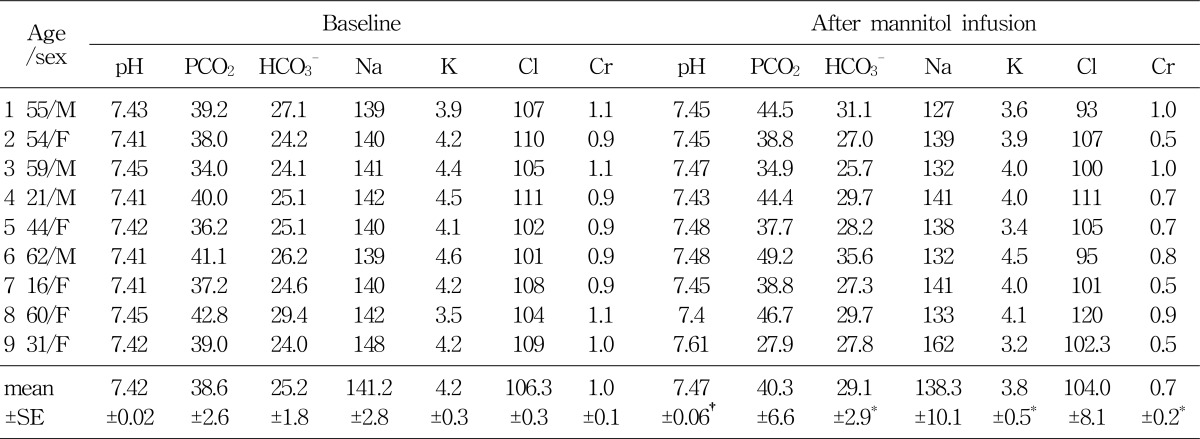
Group B, consisted of 9 patients, were infused with 1,200-2,600 mL of the 15% mannitol over the period of 12 to 24 hours. Blood pH, serum HCO3-, serum potassium, and serum creatinine level at the baseline and after 15% mannitol infusion were following: blood pH (7.42±0.02 versus 7.47±0.06), serum HCO3- (25.3±1.8 versus 29.1±2.9 mEq/L), serum potassium (4.2±0.3 versus 3.8±0.5 mEq/L), serum creatinine (1.0±0.2 versus 0.7±0.2 mg/dL) (Table 3). The values showed significant difference before and after 15% mannitol infusion. Decreased creatinine level may be due to the change in the glomerular filtration rate.
4. Acid-base and electrolyte changes after infusion of 15% mannitol over more than 24 hour period
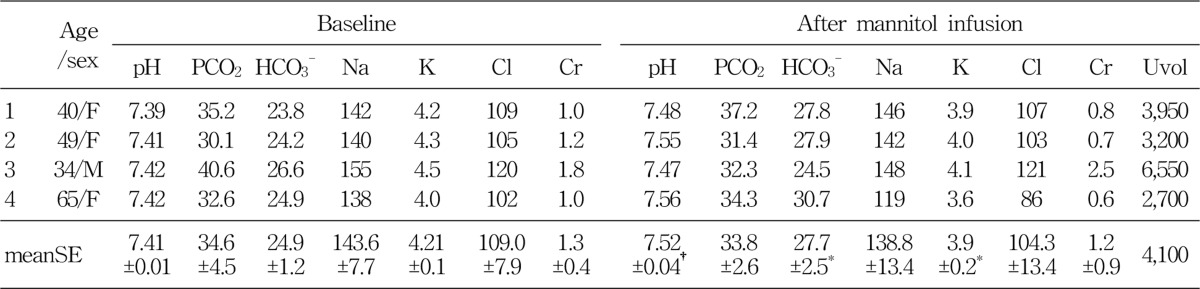
Group C, consisted of 4 patients, were infused with 15% mannitol over more than 24 hour period. Total amount of infused mannitol was 3,200 to 4,900 mL. The Baseline mean blood pH was 7.41±0.01. After the 15% mannitol infusion, the blood pH increased to 7.52±0.04. Serum HCO3- increased from 24.9±1.2 mEq/L to 27.7±2.5 mEq/L. Serum potassium level decreased from 4.2±0.1 mEq/L to 3.9 mEq/L. Serum creatinine decreased from 1.3±0.4 mg/dL to 1.2±0.9 mg/dL, which may be due to increased glomerular filtration rate (Table 4).
Discussion
Intravenous infusion of 15% mannitol may increase the blood pH and serum HCO3-, and decrease the serum potassium and creatinine levels. Metabolic alkalosis may occur due to increased renal HCO3- production after mannitol infusion2). Increased GFR after mannitol infusion may increase the distal tubular Na+ loading and proximal tubular HCO3- reabsorption. This phenomenon, in turn, may increase renal HCO3- production, and cause metabolic alkalosis.
Osmotic diuretics are obligate solutes of low molecular weight, and are freely filtered at the glomerulus and poorly reabsorbed by the renal tubules. The osmotic effect of mannitol depresses proximal reabsorption of water more than sodium, thereby decreasing proximal tubular sodium concentration. The natriuretic effect of mannitol results from decreased sodium reaborption in the loop of Henle4).
Intravenous infusion of hypertonic solution of mannitol has been shown to be effective in lowering intracranial pressure and decreasing the mass of brain, as well as lowering intraocular pressure5). Upon infusion of hypertonic mannitol (3 to 3.6 g/kg in 45 to 90 minutes), osmolarity of serum was increased from 28 to 42 mOsm/L), and the osmotic gradient between cerebrospinal fluid and serum was 16 to 35 mOsm/L5). The decreased cerebrospinal fluid pressure is due to the movement of water from the brain into extracellular fluid. The movement of water out of the brain in response to the osmotic effect of mannitol decompresses the brain when cerebral edema is present4).
Metabolic alkalosis may be produced by elevated plasma HCO3- concentration and decreased renal HCO3- excretion in the urine. In this study, hypokalemia occurred after mannitol infusion. Decreased serum potassium level may cause increased proximal tubular HCO3- reabsorption and distal tubular H+ secretion. Hypokalemia and aldosterone stimulate the H+-K+ ATPase and H+-ATPase pump, and may have an effect on distal hydrogen secretion.
In summary, these results showed that intravenous infusion of mannitol could induce metabolic alkalosis and hypokalemia, regardless of its dose. The mannitol induced alkalosis may be caused by increased renal HCO3- production.
 XML Download