

 PDF
PDF ePub
ePub Citation
 Print
Print


Abstract
Purpose
This study was to estimate salt preference and sodium intake of pregnant women, and identify the relationship between salt preference and sodium intake.
Methods
Research design was a cross sectional correlational survey with 197 pregnant women who visited outpatient clinics for antenatal care. The sodium intake levels were estimated by the amounts of sodium intake using the 24-hour recall method and sodium concentration in spot urine. The data were analyzed using descriptive statistics, t-test, ANOVA and Pearson's correlation.
Results
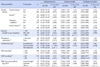
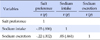
Sodium intake using 24-hour recall method was 3,504±1,359 mg. Sodium intake levels had statistically significant differences depending on income. The average amount of sodium in spot urine was 2,882±878mg/day. Sodium excretion levels had statistically significant differences depending on whether participants had preexisting hypertension in their family history and Body Mass Index (BMI) pre-conception. Salt preference was 62.61±20.96 out of 180 points. Salt preference had significant differences depending on income, parity, gestational age, BMI pre-conception and showed negative correlation with sodium quantity in spot urine.
Figures and Tables
Table 1
Nutrient Intakes of Pregnant Women (N=197)
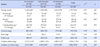
Table 2
Responses of Salt Preference Questionnaire Items by Gestational Age (N=197)
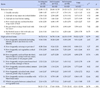
Table 3
Salt Preference, Sodium Intake, Sodium Excretion according to Characteristics of Pregnant Women (N=197)
Summary Statement
▪ What is already known about this topic?
The amount of nutritional knowledge and eating habits among pregnant women. The dietary quality evaluation of pregnant women and the evaluation of dietary information, efficacy of folic acid and iron levels of pregnant women.
▪ What this paper adds?
Pregnant womens'sodium intake from foods eaten and sodium excretion in spot urine were 1.7-fold and 1.4-fold, respectively, compared to WHO salt intake recommendation.
▪ Implications for practice, education and/or policy
As pregnancy progressed salt preference scores were elevated. Education for limited salt intake is necessary for pregnant women.
References
1. Kim HW. Development of the pregnancy nutrition knowledge scale and its relationship with eating habits in pregnant women visiting community health center. J Korean Acad Nurs. 2009; 39(1):33–43.

2. Women Health Nursing Curriculum Research. Women's health nursing II. 8th ed. Paju: Soomoonsa;2016. p. 116–117.
3. Bhutta ZA, Das JK, Rizvi A, Gaffey MF, Walker N, Horton S, et al. Evidence-based interventions for improvement of maternal and child nutrition: What can be done and at what cost? Lancet. 2013; 382(9890):452–477.
4. Davidson MC, London ML, Ladewig PW. Olds' maternal-newborn nursing & women's health across the lifespan. 8th ed. New Jersey: Pearson Prentice Hall;2008. p. 320.
5. Nowon Health Center. Mother and child health service [Internet]. Seoul: Author;2014. cited 2014 July 22. Available from:http://www.nowon.kr/health/health.jsp?mid=613101.
6. Korea Centers for Disease Control and Prevention. The Korea national health and nutrition examination survey [Internet]. Osong: Author;2014. cited 2014 August 10. Available from:https://knhanes.cdc.go.kr/knhanes/index.do.
7. Ministry of Food and Drug Safety. The guideline of dietary behaviors and nutrient intakes for women of childbearing age [Internet]. Osong: Author;2013. cited 2014 August 24. Available from:http://www.mfds.go.kr/nutrition/ebook/20121015_1/ecata log.html.
8. The Korean Nutrition Society. 2015 Dietary reference intake for Koreans. Seoul: Author;2016.
9. Shin EK, Lee HJ, Lee JJ, Ann MY, Son SM, Lee YK. Estimation of Sodium Intake of Adult Female by 24-Hour Urine Analysis, Dietary Records and Dish Frequency Questionnaire (DFQ 55). Korean J Nutr. 2010; 43(1):79–85.
10. Kim HJ, Paik HY, Lee SY, Shim JE, Kim YS. Salt usage behaviors are related to urinary sodium excretion in normotensive Korean adults. Asia Pac J Clin Nutr. 2007; 16(1):122–128.
11. Park YS, Son SM, Lim WJ, Kim SB, Chung YS. Comparison of dietary behaviors related to sodium intake by gender and age. Korean J Community Nutr. 2008; 13(1):1–12.
12. Kim MK, Han JI, Chung YJ. Dietary behavior related to salty food intake of adults living in a rural area according to saline sensitivity. Korean J Nutr. 2011; 44(6):537–550.
13. The Korean Nutrition Society. Dietary reference intakes for Koreans. First revision. Seoul: Author;2010.
14. Lee SK. A study on dietary sodium intake of office workers [master's thesis]. Sungnam: Kyungwon University;2011. 1–53.
15. Yoon JS, Park JA, Son SM. The iron status and diet quality of pregnant women during the first five months of pregnancy. Korean J Community Nutr. 2003; 8(6):803–813.
16. Women Health Nursing Curriculum Research. Women's health nursing II. 7th ed. Paju: Soomoonsa;2012. p. 517.
17. Kurabayashi T, Mizunuma H, Kubota T, Kiyohara Y, Nagai K, Hayashi K. Pregnancy-induced hypertension is associated with maternal history and a risk of cardiovascular disease in later life: Japanese cross-sectional study. Maturitas. 2013; 75(3):227–231.
18. Kim HJ. Development of sodium usage behavior questionnaire and a case-control study on dietary factors related to hypertension in Koreans [dissertation]. Seoul: Seoul National University;2006. 67–70.
19. Ahn EJ, Noh HY, Chung JY, Paik HY. The effect of zinc status on salty taste acuity, salty taste preference, sodium intake and blood pressure in Korean young adults. Korean J Nutr. 2010; 43(2):132–140.
20. Chang SO. Effect of a 6-month low sodium diet on the salt taste perception and pleasantness, blood pressure and the urinary sodium excretion in female college students. Korean J Nutr. 2010; 43(5):433–442.
21. Lee JY, Cho DS, Kim HJ. The effect of salt usage behavior on sodium intake and excretion among Korean women. Nutr Res Pract. 2012; 6(3):232–237.
22. Kim HH, Jung YY, Lee YK. A comparison of salty taste assessments and dietary attitudes and dietary behaviors associated with high-salt diets in four regions in Korea. Korean J Community Nutr. 2012; 17(1):38–48.
23. Park YS. Effects of dietary factors on urinary sodium excretion and establishing simplifies method to estimate salt intake [dissertation]. Seoul: Seoul National University;1988.
24. Crume TL, Brinton JT, Shapiro A, Kaar J, Glueck DH, Siega-Riz AM, et al. Maternal dietary intake during pregnancy and offspring body composition: The Healthy Start Study. Am J Obstet Gynecol. 2016; 215(5):609.e1–609.e8.
25. Rasmussen KM, Catalano PM, Yaktine AL. New guidelines for weight gain during pregnancy: What obstetrician/gynecologists should know. Curr Opin Obstet Gynecol. 2009; 21(6):521–526.
26. Han YS, Lee SS. Association of nutrient intake and pregnancy outcome with gestational weight gain. Korean J Nutr. 2010; 43(2):141–151.
27. Tkachenko O, Shchekochikhin D, Schrier RW. Hormones and hemodynamics in pregnancy. Int J Endocrinol Metab. 2014; 12(2):e14098.
28. Lim HJ. A Study on the sodium and potassium intakes and urinary excretion of adults in Busan. Korean J Community Nutr. 2012; 17(6):737–751.
29. Kim HH, Lee YK. Analysis of presumed sodium intake of office workers using 24-hour urine analysis and correlation matrix between variables. Korean J Nutr. 2013; 46(1):26–33.
30. Lumbers ER, Pringle KG. Roles of the circulating renin-angiotensin-aldosterone system in human pregnancy. Am J Physiol Regul Integr Comp Physiol. 2014; 306(2):R91–R101.
 XML Download