

 PDF
PDF ePub
ePub Citation
 Print
Print


Introduction
Great advances have been made in cone-beam computed tomography (CBCT). This modality is extensively used for maxillofacial treatments. CBCT has many applications and is used for making precise measurements, detecting the location of anatomical structures, evaluating airway abnormalities or asymmetry in maxillofacial bones, and analyzing endodontic or periodontal problems.1234
The lower patient radiation dose, shorter imaging time, lower cost, and higher resolution are some of the advantages of CBCT over conventional computed tomography (CT).56 However, CBCT has some limitations, such as poor soft-tissue contrast and restrictions related to the cone beam projection geometry.7
Evaluation of bone density in the maxillofacial region is a prerequisite for implant placement. Aside from the height and width of the intended bone, bone quality is an important criterion for the success of implant treatment.8 The Hounsfield unit (HU) is a standard index used in conventional CT for evaluating the degree of calcification of a bone.9
Because of the different mechanisms of image production in CBCT, gray values are distinct from the HUs of MDCT.10 Many factors can affect the gray values of CBCT images, such as type of the device, the signal-tonoise ratio, different types of artifacts, image acquisition settings, the position of the object in the field of view (FOV), and the presence of objects inside or outside the FOV.101112 All these factors can affect the results of bone density assessment with CBCT.
Knowledge of the effects of each of these factors on the results of bone density assessment can minimize errors and improve the quality of CBCT images. The size of the FOV is a variable that has not been well analyzed in recent studies. In a recent study, Rodrigues et al.10 used a phantom with 3 cylinders containing water, plaster, and motor oil. They scanned the phantom with CBCT and multidetector CT (MDCT) devices using 3 FOV sizes. The results showed significant differences in the mean gray values (MGVs) of CBCT according to the size of the FOV. A comparison of the CBCT and MDCT results showed significant differences for the 3 materials in the 3 FOV sizes.
The optimal size of FOV varies according to an individual's needs. A small FOV is used to assess a limited area in 1 jaw (i.e., for the insertion of only 1 implant). A large FOV is used for orthodontic treatments or full-mouth implant surgery. Differences in the size of the FOV can affect the quality of CBCT images.
The main objective of this study was to evaluate the effect of FOV size on gray values in 2 different CBCT systems. In other words, for each CBCT system, the gray values of images obtained with a large FOV were compared with those of images taken with a small FOV. For this purpose, 2 CBCT systems-the Cranex 3D and Newtom 3G systems-were used with 2 FOV sizes (small and large) for each model.
The second objective of this study was to compare the results of CBCT systems with MDCT images as the gold standard after standardizing the method of analysis. Although Hounsfield units (HUs) in CT have been used as reference values in many studies,131415 variations may nonetheless be present between different systems and different energy levels from the same MDCT scanner. Thus, calibration of the system and using the same exposure parameters during the study can prevent variation in HUs. In this way, the HUs calculated for other materials would be reproducible and correct values.
This study evaluated 3 bone substitutes commonly used for bone grafting in the maxillofacial region. Our study compared the density of these materials with each other using 2 CBCT systems and MDCT as the gold standard.
Materials and Methods
Radiographic phantom
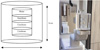
An acrylic radiographic phantom was constructed as a standard experimental object in order to evaluate the density of 4 different materials. It was made from transparent polymethyl methacrylate (PMMA). The phantom consisted of 4 acrylic cylinders that were 2 cm in diameter, 1 cm high, and had a wall thickness of 2 mm. Three cylinders were loaded with 3 types of bone substitutes commonly used for bone grafting in the maxillofacial region: namely, Nanobone (Artoss GmbH, Rostock, Germany), Cenobone (TRC, Kish free zone, Iran), and Cerabone (Mebios GmbH, Dieburg, Germany). All bone substitutes were mixed with sterile saline according to the manufacturer's instructions. One other cylinder was filled with distilled water as a standard control material. The cylinders were then sealed with acrylic plates and centered in a bigger cylinder with that was 8 cm in diameter and 8 cm high. The outer cylinder was also filled with distilled water to simulate body fluids (Fig. 1).
Radiographic scans
The MDCT system was calibrated to set values of HUs approximately equal to 0 for water (Table 1). The exposure parameters, including voltage (kVp) and amperage (mA), as well as the software used for image acquisition in MDCT, were the same throughout the study for the purpose of standardization and in order to avoid variability in the calculated HUs.
The phantom was scanned with 3 different protocols. First, the phantom was scanned with CBCT using the NewTom 3G (QR srl., Verona, Italy) system with small (8 cm×8 cm, 0.2 mm voxel size) and large (13 cm×16 cm, 0.3 mm voxel size) FOVs. Scanning was carried out at 3–8 mA and 110 kVp. Next, the phantom was scanned with CBCT using the Cranex 3D (Sordex, Tuusula, Finland) system with small (4 cm×6 cm, 0.136 mm voxel size) and large (6 cm×8 cm, 0.2 mm voxel size) FOVs. The exposure settings included 5 mA and 90 kVp. Finally, the phantom underwent MDCT using the Somatom Spirit system (Siemens, Erlangen, Germany) with a 13 cm×16cm FOV as the gold standard. Scanning was carried out at 70 mA and 110 kVp.
The phantom was placed at the center of the FOV for imaging. A scout was obtained from the phantom, and its position within the FOV was adjusted such that it was centered within the FOV as closely as possible. The long axis of the phantom was aligned perpendicular to the plane of X-ray beam movement. This was done to standardize the methods used in the study.
Viewing software
In each CBCT system, the acquired data were reconstructed with the respective software programs and were then imported as Digital Imaging and Communications in Medicine data files into OnDemand3D dental software (Cybermed, Seoul, Korea) to ensure that a single standard method of analysis was used. This software rescaled the gray values imported from each system. By doing so, we prevented errors due to the use of multiple software programs. All procedures were done using the same computer system.
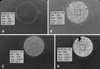
For calculation of the MGVs of each material, 40 regions of interest (ROIs) were used. They were positioned at the center of 10 random axial cuts with intervals of at least 0.5 mm. Each axial cut contained 4 ROIs with an area of 2 mm×2 mm. The MGV for each cylinder was calculated using the results of 40 ROIs (Fig. 2).
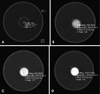
The HU values for the MDCT images were calculated with the same method using Clear Canvas Workstation software (Clear Canvas, Toronto, ON, Canada) (Fig. 3). Two expert oral and maxillofacial radiologists carried out the above protocols in this study.
Statistics
The reliability of the measurements made by the 2 raters was assessed using the intraclass correlation coefficient.
The coefficient of variation (=100×standard deviation/mean) was calculated to assess variation in the gray values of each material derived from each imaging protocol. Comparisons were made between the MGVs of each material in the 2 FOV sizes using the paired-sample Student t-test. Comparisons were made between the MGVs of each material with others using analysis of variance (ANOVA). Comparisons of the 3 systems (2 CBCT systems and 1 MDCT system) were made using the Tukey post hoc test. Statistical analyses were carried out at the P=.05 level of significance using SPSS version 17.0.0 (SPSS Inc., Chicago, IL, USA).
Results
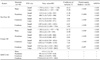
The intra-rater agreement for the gray values of each material derived from both CBCT and MDCT measurements showed excellent agreement. Table 1 shows the MGVs of each material with the 2 FOV sizes for the 2 CBCT systems and the HU values of MDCT as the gold standard in our study.
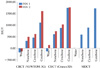
As shown in Table 1, the paired-sample Student t-test showed significant differences in the MGVs between the small and large FOVs for all materials tested in both CBCT systems (P<.05) except for Cerabone in the Cranex 3D system, for which the MGVs were not significantly different between the 2 FOV sizes (P>.05). The images obtained with large FOVs had significantly higher MGVs than those taken with small FOVs (Fig. 4).
ANOVA showed significant differences between the MGV of each material in comparison with others for both FOV sizes in each CBCT system. Among the 3 bone substitutes, Cerabone showed the highest MGV, while Nanobone showed the lowest (Table 1).
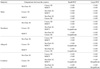
Comparison of the 3 imaging systems (2 CBCT and 1 MDCT) in terms of the MGVs derived from each system using the Tukey post hoc test showed no significant difference between the MGVs of the Cranex 3D CBCT system and the HU values of MDCT for all bone substitutes imaged with a small FOV, although distilled water showed a significant difference for small FOVs. Comparison between the HUs derived from MDCT and the MGVs of the 2 CBCT systems with large FOVs showed significant differences between the systems for all materials except Cerabone (P<.05, Table 2).
Discussion
The 3-dimensional nature of implant placement sites necessitates the use of CBCT for dental implant treatment planning, since it provides high-quality 3D images with a relatively low patient radiation dose and cost. Recently, the potential of CBCT for bone quality assessment has been suggested.16 There is no universally accepted method for bone quality classification.171819
In CBCT images, the density values are not valid and reproducible, as in medical CT, because of the arbitrary grey levels,18 the artifacts that may be displayed,1820 higher scatter levels,20 and non-calibrated gray values and standard exposure settings for different types of CBCT systems.16
Furthermore, the type of CBCT system and the image acquisition settings, the position of the object in the FOV,2122 the amount and uniformity of the mass outside of the FOV, and the total mass per slice,212223 as well as the size of the FOV,2223 can affect the gray values measured by CBCT.
One disadvantage of CBCT is its inability to display the actual HUs, as does medical CT. It is important to be able to assess the bone quality accurately for successful implant planning. The quality of cortical and cancellous bone can affect primary implant stability and consequently the success of treatment.16 This is more important when the implant is inserted in a bone-grafted region. The accuracy of gray values in CBCT systems is questionable. Therefore, it is necessary to compare these modalities with an accurate system as the gold standard. MDCT applies HUs as a standard unit for assessing tissue density and can serve as the gold standard for this purpose. Such a comparison would provide data that could help clarify which CBCT system, with which FOVs, better determines bone quality. To date, the manufacturers of CBCT systems have not standardized gray levels for evaluating bone density. Furthermore, CBCT systems vary significantly because they have different hardware and software.16
Thus, a CBCT system with specific exposure settings yielding the same results as MDCT would be a more reliable way to evaluate bone density. This was the logic behind the comparison of the MGVs derived from each CBCT system with MDCT as the gold standard.
In this study, we first designed an acrylic phantom to minimize the effect of confounding factors. This study used 4 different materials and placed them over each other such that the plane of the X ray beam was perpendicular to the long axis of the phantom. By doing so, we standardized and equalized the amount of the X-ray beam that reached each material. Rodrigues et al. used a phantom in the same way with respect to this point,10 but Nackaerts et al. positioned the long axis of the phantom parallel to the plane of X-ray beam movement, which could cause symmetric variation of gray values along the phantom.24
In our study, we reduced the space between materials by attaching the cylinders to each other. By doing so, we sought to position all materials at the center of the FOV.
Our study used 3 different bone substitutes that are commonly used for bone grafting in periodontal and implant surgery. This can help maxillofacial radiologists and surgeons assess bone quality at the site of bone grafts. To the best of the authors' knowledge, this has not been attempted before. Rodrigues et al. used motor oil and plaster to decrease the costs of their experiment,10 whereas our study used bone substitutes in a volume similar to the amount used for bone grafting in periodontal and implant surgery. Thus, we used cylinders that were 2 cm in diameter and 1 cm high. The results of our study show that both CBCT systems used in our study had the ability to distinguish all the tested bone grafting materials through an assessment of their gray values. Among the 3 tested bone substitutes, Cerabone showed the highest MGV, while Nanobone showed the lowest MGV.
Air bubbles entrapped in cylinders during mixing of bone substitutes with saline could affect the MGVs calculated for each cylinder. To minimize the effect of this factor, our study used a relatively large number of smaller ROIs so that we could calculate the MGVs and HUs with minimal error.
The size of the acrylic phantom represented the smallest FOV used in the NewTom 3G CBCT scanner. This led to a reduction of the mass outside of the FOV in all image acquisitions and eliminated the discontinuity of the X-ray beam that reached the phantom.10 This issue was not considered in the studies by Katsumata et al.2223
Rodrigues et al. used an i-CAT scanner in their study,12 but we used 2 other CBCT scanners (NewTom 3G and Cranex 3D) that are widely used in dental clinics and maxillofacial radiology departments in Iran.
The Cranex 3D system has only 2 FOV sizes: small (4 cm×6 cm) and large (6 cm×8 cm). Therefore, our study used only 2 FOV sizes, but in order to generate more data, we also used the NewTom 3G system with small and large FOVs. Evidence shows that different FOV sizes do not significantly affect the HUs of MDCT images;182526 therefore, our study used a single FOV size for the MDCT scanner as the gold standard.
In the results of our study, only the MGV of Cerabone in the Cranex 3D system did not significantly differ between the small and large FOVs. This finding may be attributed to its high density, which led to smaller changes in the MGV with different exposure settings.
Few in vitro or in vivo studies have evaluated the effect of FOV size on the properties of CBCT images. Pauwells et al. used a PMMA phantom containing 6 different materials (air, PMMA, 50 mg/cm3 hydroxyapatite [HA50], HA100, HA 200, and aluminum). They used 13 CBCT systems and 1 MDCT system. They concluded that even though most CBCT systems showed a good overall correlation with CT numbers, large errors were found during the quantitative analysis. They also reported that the Scannora 3D (Soredex, Tuusula, Finland) system with a medium-volume FOV and the Kodak 9500 with a low-volume FOV had the least error for density measurements in assessments of medium-density materials (such as bone) when compared to the MGVs of MDCT (Siemens, Erlangen, Germany).27 Our study confirmed their results, because when assessing the MGVs of bone substitutes in small FOVs, there was no significant difference between the Cranex 3D and MDCT systems. This difference was not significant for water, which may have been due to the higher noise and radiation scattering in materials with low density (such as water). Rodrigues et al. achieved the same results when analyzing water with an i-Cat system (Imaging Sciences International Inc., Hatfield, PA, USA).10 In this study, the Newtom 3G system showed no significant correlation with the MDCT results, except for Cerabone in large FOVs; this finding shows that the Newtom 3G system was unreliable in terms of the comparability of its results with the HUs of MDCT.
Thus, the type of CBCT system, the density of materials, and the exposure settings (such as FOV size) are important for obtaining gray values equivalent to MDCT results. Codari et al.28 reached the same conclusion after comparing the effects of 3 CBCT systems, 2 FOV sizes, and 3 high-density materials on metal artifacts when scanning an acrylic phantom with 3 metallic materials (titanium, copper-aluminum alloy, and amalgam).
Some studies have reported that smaller FOVs reduce the radiation dose administered to the patient,21 improve the resolution of the image, and increase the variability of gray values.2229303132 Our study showed that smaller FOVs increased the variability of gray values, except for water in the NewTom 3G device and Cerabone in the Cranex 3D system. The coefficient of variation also showed less variability in the gray values of higher-density materials (such as Cerabone), which is believed to be the result of noise reduction. Katsumata et al. reported significant variation in the gray values when objects of different masses were evaluated with different FOVs. In their study, a larger FOV eliminated the mass outside of the FOV and resulted in less variability in gray values.23
In conclusion, the size of the FOV used in CBCT systems significantly changed the MGVs of the materials tested in this study, except for Cerabone in the Cranex 3D system. Both CBCT systems had the ability to distinguish the 3 types of bone substitutes via a comparison of their MGVs. The Cranex 3D system with a small FOV showed a significant correlation with MDCT results in terms of the MGVs of the 3 bone substitutes tested in this study.
 XML Download