

 PDF
PDF ePub
ePub Citation
 Print
Print


Introduction
Recently, the use of cone-beam computed tomography (CBCT) has rapidly increased in many fields of dentistry. The advantages of CBCT include a lower patient dose, higher resolution, and lower cost than conventional computed tomography (CT). However, although the dose of CBCT is lower than that of conventional CT, it is higher than that of conventional radiography, which is commonly used in dental practice.1
The concept of the effective dose was developed to provide a measure of the stochastic risk from exposure to low doses of ionizing radiation, and it should not be applied to estimations of the risk posed to an individual patient.23 There are several reasons for this. Foremost, the effective dose represents risk to a reference subject with average values of characteristics, such as age, gender, and genetic radiation sensitivity. Another reason is that effective dose estimation is subject to numerous sources of uncertainty.23 However, despite these limitations, the effective dose is a useful metric for comparing alternative imaging modalities in terms of relative risk. By employing the same methods of dose measurement for different examinations, units, or protocols, we can evaluate which options result in greater or lower risk.2 There have been many studies related to CBCT dosimetry using thermoluminescent dosimeters (TLDs) in an anthropomorphic phantom.2456 This is the most widely used method for determining the effective dose, but it is very complicated and time-consuming. A major drawback in using TLD technology is the need to replace the TLDs after every exposure.7 It was reported that the use of personal computer-based Monte Carlo (PCXMC) software (Radiation and Nuclear Safety Authority, Helsinki, Finland) could be an alternative to the traditional method for assessing the effective dose.891011 Several researchers have reported using the PCXMC program for C-arm CT procedures,1213 chest radiography,1415 dental CBCT,711 oblique lateral radiography and bitewing radiography,8 and panoramic radiography.9
Kawasaki et al.15 calculated organ and effective doses using the PCXMC software for pediatric chest radiographic examinations and compared them to those obtained by inphantom dose measuring system using silicon photodiode dosemeters. They concluded that the effective doses obtained using the PCXMC software agreed within 23% with those obtained using the dose-measuring system, revealing the usefulness of this software for evaluating the effective dose. Koivisto et al.7 compared the effective dose from a Promax 3D CBCT device with an 8 cm×8 cm field of view (FOV) using metal-oxide semiconductor field-effect transistor (MOSFET) dosimeters and PCXMC simulations. They reported that the observed difference between the MOSFET and PCXMC values was relatively small (17%).
Although PCXMC software might be a promising alternative to TLD technology for estimating the effective dose of dental CBCT, few studies711 on this subject have been published. The objectives of this study were to calculate the effective doses in dental CBCT with large and medium FOVs using the PCXMC software, and to compare them with those measured using TLDs and an anthropomorphic phantom.
Materials and Methods
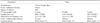
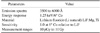
The Alphard VEGA (Asahi Roentgen Ind. Co., Kyoto, Japan) CBCT scanner was used for this study. Table 1 shows the technical specifications of this CBCT scanner obtained from its manual and some references1617 and the radiographic exposure parameters for the measurement of the effective dose. The protocols of the cephalometric (C) mode (20.0 cm×17.9 cm FOV), the panoramic (P) mode (15.4 cm×15.4 cm FOV) for the maxilla, and the implant (I) mode (10.2 cm×10.2 cm FOV) for the maxilla were selected. The exposure factors of kV, mA, and exposure time were set to the optimized options used at our hospital for imaging adult men. The dose-area product (DAP) was measured using the DIAMENTOR M4-KDK with an ionization chamber (PTW, Freiburg, Germany). The DIAMENTOR M4-KDK with an ionization chamber is designed to measure the DAP and entrance dose in the range of 50-150 kV, with the radiation qualities described in IEC 61267 for use during fluoroscopy and radiography. For TLD, TLD-100 chips (3.2 mm×3.2 mm×0.89 mm; Thermo Electron Cor., Oakwood Village, OH, USA) and an adult male Alderson Radiation Therapy phantom of the head and neck (ART-210A; Radiology Support Devices Inc., Long Beach, CA, USA) were used. Table 2 shows the specifications of the TLD-100 chips.
Measurements
The DAP meter and ionization chamber were calibrated at the PTW-Freiburg calibration laboratory before the measurement of DAP. The ionization chamber of the DAP meter was located on the tube side of the CBCT scanner. For each mode, the DAP value was measured at the scout and main projections. All measurements were repeated 3 times and averaged. The averaged values were corrected by correction factors considering the temperature and air pressure during the DAP measurements.
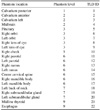
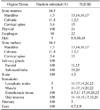
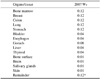
The TLD chips were calibrated and annealed by Iljin Radiation Engineering Company (Hwaseong, Republic of Korea). Twenty-two TLD chips were inserted in the adult male phantom and CBCT was performed in the C mode, P mode for the maxilla, and I mode for the maxilla with the optimized exposure settings used at our hospital. The TLD chips were used to record the absorbed doses at 22 locations in the head and neck of the phantom (Table 3). For each examination, background radiation was also measured using 5 TLD chips that were not exposed to radiation. The average measured background radiation was subtracted from the measured dose of each irradiated TLD chip. The tissue-absorbed doses (in µGy) at each anatomical site were calculated from the irradiated TLD readouts. The products of these values and the percentage of the tissue or organ irradiated in a radiographic examination (Table 4) were used to calculate the equivalent dose (HT) in µSv. The estimated fraction of a tissue or organ irradiated used by Ludlow and Ivanovic6 was adopted for this study. The effective dose (E) expressed in µSv was calculated using the equation: , where E is the product of the tissue weighting factor (WT) and the equivalent dose (HT). Table 5 shows the 2007 ICRP tissue-weighting factors.18
PCXMC simulation program
PCXMC20Rotation program for the main projection of the CBCT scan
The PCXMC20Rotation software was used to calculate the effective dose of the main projection in each mode of CBCT. Dose-determining factors such as the patient's age, X-ray voltage, filtration, the number of projection angles, the oblique angle of the central ray, the focus-to-reference point distance (FRD), the X-ray beam width and height at the reference point, the reference points on the X-, Y-, and Z-axes, and the input dose quantity (DAP) were entered for the dose calculation. In this study, the patient age was 30 years, the X-ray voltage was 80 kV, the filtration was 2.8 mm Al equivalent, the oblique angle of the central ray was 0°, and the FRD was 71.5 cm (in C mode) and 65 cm (in P and I modes). The X-ray beam width and height at the FRD were calculated using the collimator dimension, focus-collimator distance (FCD), and focus-rotation center distance available from the CBCT scanner manual. The examination was simulated with 360 views at 1° intervals. The input DAP was the measured DAP value divided by 360.
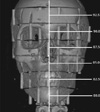
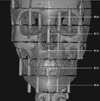
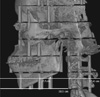
The reference points on the X-, Y-, and Z-axes (Xref, Yref, and Zref) were determined as follows. In the PCXMC program, the coordinate system originates in the middle of the base of the trunk of the phantom. The positive Z axis points upwards, the X axis points to the left-hand side, and the Y axis points to the back of the phantom. In C, P, and I modes, Xref was set to zero, because the midsagittal plane of the patient must be centered in each mode. The Zref of each mode was determined using coronal images of the 3-dimensionally reconstructed CBCT of the phantom, based on the anthropomorphic radiation analogue dosimeter (RANDO) phantom head with superimposed PCXMC coordinates (Z), as suggested by Koivisto et al.7 The Zref values for C, P, and I modes were set to 86.2 cm, 85 cm, and 84.5 cm, respectively (Figs. 1,2,3).
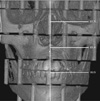
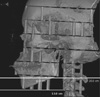
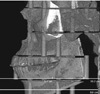
To determine the value of the Y-axis at the head and neck area, we used the ‘radiograph’ graphics shown on ‘the x-ray examination data input form’ screen of the PCXMC software for guidance and found that the Y-axis value of the most mid-anterior point of the cervical vertebrae inferior to the mandible was approximately −1.0 cm. The Yref value of each mode was determined using lateral images of 3-dimensionally reconstructed CBCT scans of the phantom. The Yref values for C, P, and I modes were set to −4.0 cm, −3.8 cm, and −5.8 cm, respectively (Figs. 4,5,6). The input values in the main projection in C, P, and I modes are shown in Table 6. The PCXMC20Rotation software calculated the absorbed organ and effective doses based on ICRP 103.18
PCXMC program for the scout views of the CBCT scans
The Alphard VEGA scanner uses a scout image in the clinical protocol for imaging patients in C, P, and I modes. A scout image in each mode is a form of true lateral radiography, which can be considered a kind of general projection radiography. The PCXMC program was used to evaluate the effective dose of the scout projection in each mode. Dose-determining factors such as patient age, X-ray voltage, filtration, projection angle, the oblique angle of the central ray, the focus-to-skin distance (FSD), the X-ray beam width and height at the FSD, the reference points on the X-, Y-, and Z-axes, and the input dose quantity (DAP) were entered for the dose calculation. The patient age was 30 years, the X-ray voltage was 80 kV, the filtration was 2.8 mm Al equivalent, the projection angle of the central ray was 0°, and the oblique angle was 0°. The X-ray beam width and height at the FSD were calculated using the collimator dimensions, FCD, and FSD.
Xref, Yref, and Zref are the coordinates of an arbitrary point inside the phantom through which the central axis of the X-ray beam is directed. According to the user's guide of this program, choosing any point along the intended beam center-line results in the same calculation. The coordinates of the approximate skin entrance point for each mode were used in this study. The Yref and Zref values for each mode were determined to be the same as those of the main projection of each mode. The FSD and Xref values in C, P, and I modes were set to 64.2 and 7.3 cm, 57.7 and 7.3 cm, and 58.5 and 6.5 cm, respectively. The input values for the scout projections in C, P, and I modes are shown in Table 7. The PCXMC2.0 software calculated the absorbed organ and effective doses based on ICRP 103.18
Results
The effective doses of each mode of CBCT calculated by the PCXMC software and measured using TLDs in an ART phantom are shown in Table 8. The effective doses in C, P, and I mode calculated by the PCXMC software were 181 µSv, 300 µSv, and 158 µSv, respectively. The effective doses obtained by the PCXMC calculations were 16%–18% smaller than those obtained through TLD measurements in each mode.
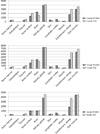
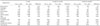
The absorbed doses in various organs and tissues calculated by the PCXMC software and measured using TLDs in an ART phantom are shown in Table 9 and Figure 7. For most organs and tissues, the absorbed doses obtained by PCXMC calculations were smaller than those measured using TLDs. Among the organs that made a large contribution to the effective dose (bone marrow, thyroid gland, salivary gland, extrathoracic airway, and oral mucosa), the largest underestimation was found for the extrathoracic airway in C and P modes for the maxilla and the thyroid gland in I mode for the maxilla.
Discussion
The PCXMC software is a Monte Carlo-based simulation computer program for calculating the patient's organ dose and the effective dose of an X-ray examination.719 It allows a free adjustment of the X-ray projection and other examination conditions of projection radiography. The PCXMC20Rotation software is the same program as the normal PCXMC2.0 with a slightly modified interface, allowing easy dose calculations in cases where the X-ray system has a central point of rotation and the radiation is aimed at the patient from various directions, so that the central axis of the beam goes through this point (the reference point of PCXMC). In this study, PCXMC20Rotation and PCXMC2.0 were used for the calculation of the main projections and scout projections of CBCT, respectively.
For the calculation of the effective dose for dental CBCT using PCXMC20Rotation, several dose-determining factors should be entered. The determination of the reference points on the Y-, and Z-axes is particularly important because variation in these values produces large changes in the effective dose calculation.9 The reference point corresponds to the rotational axis of the CBCT machine. The rotational center of CBCT changes according to the size and location of the FOV. The input value of the reference point on the Z-axis was determined based on the RANDO phantom head with superimposed PCXMC coordinates (Z), as suggested by Koivisto et al.7 In regard to the input value of the reference point on the Y-axis, Koivisto et al.7 set Yref to be −5 cm for CBCT scans with an FOV of 8×8 cm. For the calculation of effective doses of CBCT scans with FOVs of different sizes and locations in this study, Yref had to be determined for each mode separately. First, to detect the location of the origin on the Y-axis in the head and neck area, we used the ‘radiograph’ graphics shown on ‘the x-ray examination data input form’ screen of the PCXMC software for guidance and found that the Y-axis value of the most mid-anterior point of the cervical vertebrae inferior to the mandible was about −1.0 cm. Based on this value, the reference points on the Y-axis could be calculated on lateral images of 3-dimensionally reconstructed CBCT scans of the phantom.
When Koivisto et al.7 calculated the effective dose from a Promax 3D CBCT apparatus with an FOV of 8 cm×8 cm using a PCXMC simulation, they set the rotation axis of the simulations to a Yref of −5 cm and a Zref of 83 cm. The CBCT images of the RANDO phantom shown by them covered the oral cavity, involving the maxilla and mandible equally. The simulations were made with a rotation angle range of 200° with 2° graduations in 101 steps, and the scout projection was not considered. They reported that the effective dose calculated by the above method was 136 µSv. In the present study, the effective dose in the I mode for the maxilla with an FOV of 10.2 cm×10.2 cm was 158 µSv. The center of the FOV on the Z-axis in this mode was 84.5 cm, slightly higher than that reported by Koivisto et al.7 The rotation angle was 360° and simulations were made with 1° intervals in 360 steps. In addition, the scout projection was simulated in this study.
Our results showed that the effective doses of dental CBCT scans of large and medium FOVs calculated by the PCXMC software were 16%–18% smaller than those obtained using TLD technology. Kawasaki et al.15 calculated the effective doses using PCXMC software in pediatric chest radiographic examinations with a field size of 21.5 cm×30 cm and compared them to those obtained using the in-phantom dosimetry system. They concluded that the effective doses calculated using PCXMC software agreed within 23% with those obtained using the dose measuring system, confirming the usefulness of this software for evaluating the effective dose. Koivisto et al.7 reported that the total effective dose from a CBCT device obtained using PCXMC software was 136 µSv, lower than the 216 µSv effective dose obtained by Qu et al.20 from the same device under the same conditions using TLD dosimetry. However, a similar study by Pauwels et al.4 using TLD dosimetry reported a lower effective dose (122 µSv) from the same device under similar conditions. Although the same TLD methods were used, these discrepancies may have been produced by differences in many details, such as the use of a different phantom, a different number of dosimeters, different TLD positioning, different FOV positioning, and so on. The difference between the PCXMC simulations and the TLD measurements can be explained by the differences in the mathematically modeled and physically realized phantoms, the necessity of having to rely on a limited number of point measurements, and the method of assessing organ doses based on the measurements.7 In this study, the effective dose calculated using PCXMC software agreed within 18% with the measurements obtained using TLD technology, confirming the usefulness of this software for evaluating the effective dose of CBCT with large and medium FOVs.
The absorbed organ doses showed more variation. Considering the tissue weighting factors, the organs that made a large contribution to the effective dose were the bone marrow, thyroid, salivary glands, extrathoracic airway, and oral mucosa. The absorbed doses of most of these organs calculated by the PCXMC software were underestimated in comparison with those measured using TLD technology. The largest underestimation was found for the extrathoracic airway in C and P mode and for the thyroid gland in I mode. This apparent underestimation in the PCXMC calculations may have been due to overestimations in the TLD measurements. Pauwels et al.4 pointed out that organ dose estimation using a small number of TLDs could deviate with differences up to 80%. Because the use of a large number of TLDs was impractical, we used a limited number of TLD, as in earlier studies.620 The large difference in the thyroid gland dose was likely due to the use of a minimal number of dosimeters. Another contributing factor to the differences in the absorbed organ doses between the 2 methods might have been the different methods of assessing the organ dose. In the organ dose estimation using TLDs for the extrathoracic airway, a different dosimeter location was chosen in earlier studies.67 To measure the organ dose of the extrathoracic airway, Ludlow and Ivanovic6 used TLDs at the salivary glands, mandibular body and ramus, cervical spine, thyroid, esophagus, and orbits. In contrast, Koivisto et al.7 used dosimeters at the cervical spine, thyroid, esophagus, and orbit. The former method, in which doses were measured at the salivary glands and mandibular body and ramus, produces a higher organ dose than the latter. Since we followed the method of Ludlow and Ivanovic,6 the absorbed organ dose of the extrathoracic airway measured using TLD technology might have been overestimated in this study.
Vassileva and Stoyanov11 reported that the effective dose from the ILUMA™ Ultra CBCT device obtained using the PCXMC software was 157 µSv. However, Ludlow and Ivanovic6 reported 498 µSv for the same CBCT system with the same exposure settings with TLD technology. Vassileva and Stoyanov11 did not suggest any possible cause for this large discrepancy, and only stated that further verification is needed. They did not describe the detailed input values such as FRD and the reference points on the X-, Y-, and Z-axes for the calculations made using the PCXMC software, so the cause of this discrepancy could not be analyzed.
In the study, the effective doses were calculated for an Alphard VEGA CBCT scanner in C, P, and I modes. Dental mode (5.4 cm×5.4 cm FOV), the smallest FOV of this scanner, was excluded because CBCT with a small FOV might show large differences in the effective dose depending on FOV positioning, and it was more difficult to determine the coordinates of the reference points for this mode. Further studies of the effectiveness of the PCXMC software for estimating the effective dose of CBCT with a small FOV are needed.
In summary, the effective doses calculated using the PCXMC software for CBCT scans with large (C mode) and medium FOVs (P and I modes) were comparable to those obtained using TLD technology, with agreement within 18%. The PCXMC software might be an alternative to TLD technology for assessing the effective dose of CBCT scans with large and medium FOVs. It was described how to determine the reference points on the Y-, and Z-axes in PCXMC, which are important dose-determining factors in this software.


 XML Download