

 PDF
PDF ePub
ePub Citation
 Print
Print


Introduction
Cone-beam computed tomography (CBCT) examinations have become significantly more common in recent years. Currently, CBCT is widely used in oral surgery, maxillofacial surgery, temporomandibular joint studies, orthodontics, endodontics, and periodontics.123 The most common clinical reason for a CBCT examination is the decision to place an oral implant. Even CBCT units with relatively low radiation doses are still considered higher-dose modalities than other radiographic dental imaging methods.4 One of the factors related to this is the lack of standardization in the CBCT equipment used in terms of configuration options. The combinations of different exposure parameters, such as tube voltage, field of view (FOV), and angle of rotation,56 directly influence the radiation dose values and image quality.7 Despite these differences in CBCT equipment, the obtained images must have high diagnostic quality, especially in periodontics and endodontics, where small details must be analyzed.8
Recently, comprehensive guidelines based on evidence acquired from the usage of CBCT in dentistry were published in the European Commission Radiation Protection Report No. 172.9 These guidelines include quality assurance and optimization strategies to ensure CBCT best practices. The establishment of quality assurance testing is important to ensure diagnostic information maintenance using optimized protocols. Moreover, the radiation doses must be as low as reasonably achievable. In addition, the aspects of the imaging process, including objective measures of equipment performance, patient dosimetry, and evaluation of clinical image quality, should be included in the tests.1011 The American Academy of Oral and Maxillofacial Radiology (AAOMR)12 also proposed recommendations related to the use of CBCT; however, they did not provide clear evaluation parameters. In the AAOMR recommendations, it is stated that the quality assurance program should include documentation of the performed quality control tests, a record of equipment performance monitoring results, dosimetry results, and a chart of patient- and task-specific exposure parameters.
System quality control should not be performed based on subjective image evaluations because depending on the computer graphics card, images can be displayed with misrepresentations of the grayscale levels. Likewise, imperfect interpolation algorithms may lead to truncation or round-off errors. In other words, subjective evaluation may contribute to many confounding factors that affect the obtained results.13
The use of phantoms is essential to make measurements of image quality parameters. Furthermore, automatic image evaluation is suggested to avoid interobserver and intraobserver disagreement.9 Few studies have presented software to assess image quality in CBCT. The procedures for determining image quality parameters presented in some software programs are manual, very time-consuming, and for the most part very expensive.131415 Consequently, this type of evaluation discourages the use of quantitative CBCT parameter analysis in clinical practice.
Therefore, the purpose of this study was to develop a package for automatic quality control, with dedicated open-access software and a quality control informatics system, that could be used to evaluate the quality of CBCT images and to manage a CBCT system over time.
Go to : 
Materials and Methods
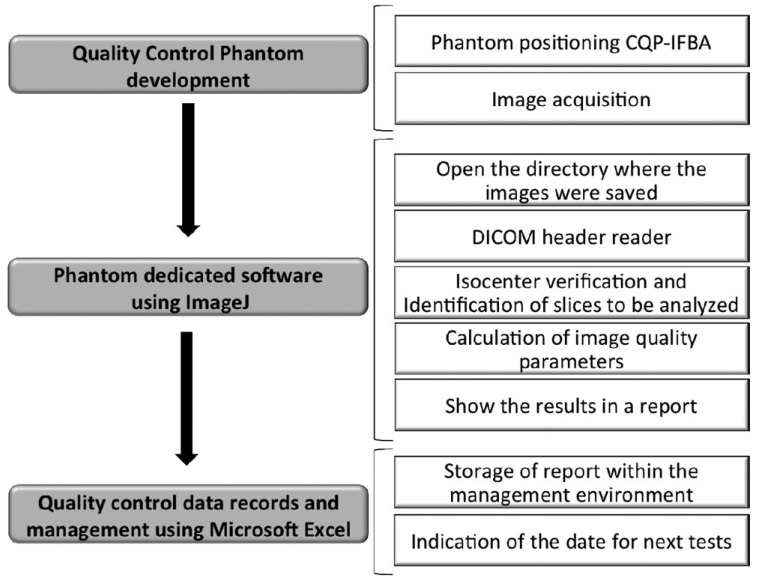
This study was divided into 3 phases: creation of a quality control phantom, the development of dedicated software for that phantom, and the development of an application to perform record management and data quality control. After phantom development, CBCT images were acquired to collect data to use in the development of dedicated software for the phantom. The structure of the study is presented in Figure 1.
Quality control phantom
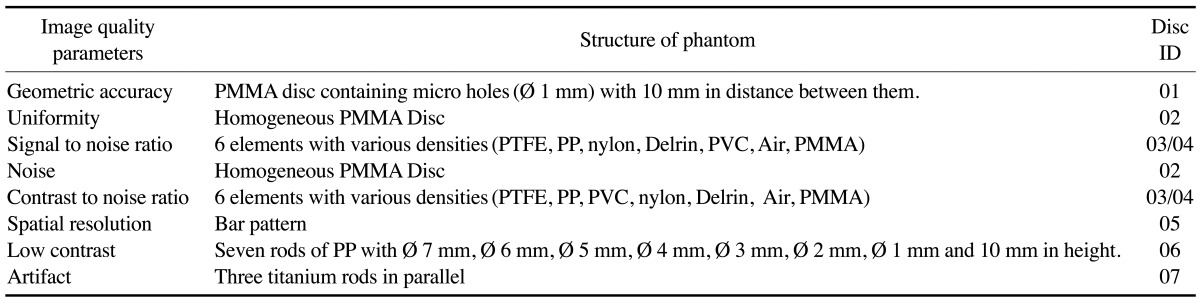
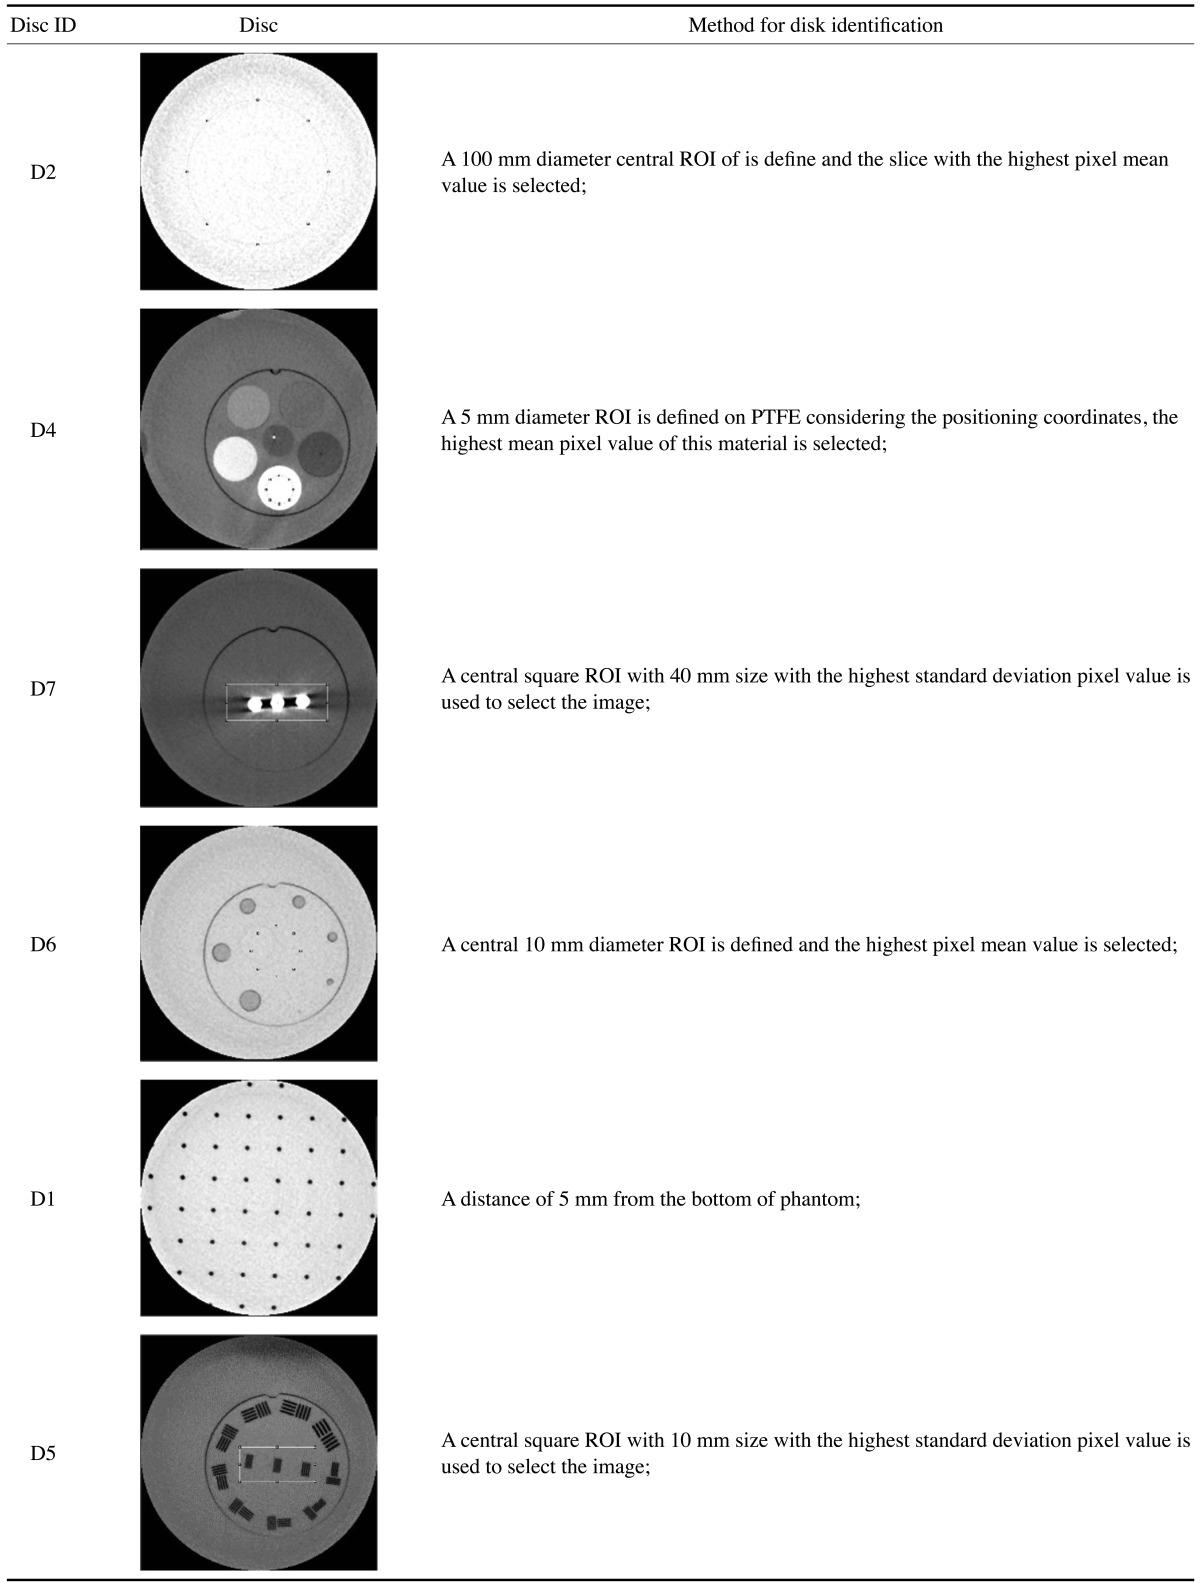
A phantom model, referred to as CQP-IFBA, was created in polymethyl methacrylate (PMMA) based on the CQ-01-IFBA prototype developed by Dr. Wilson Batista. This cylindrical phantom, 70 mm high and 150 mm in diameter, is of modular design and divided into 7 circular discs of PMMA (10 mm high and 140 mm in diameter). The phantom consists of different materials that represent structures with various densities, allowing image quality parameters to be evaluated. The phantom structure was elaborated according to the image quality parameters, as presented in Table 1.
To ensure that disc rotation did not occur, black disc marks were performed with a radiotransparent material (Fig. 2A). A docking slot was created in all the small discs disposed inside the regular discs to avoid disc rotation (Fig. 2B). Two black vertical landmarks were also defined to ensure that the phantom was aligned according to the CBCT laser positioners, since for optimal performance, it is essential to correctly position the phantom.
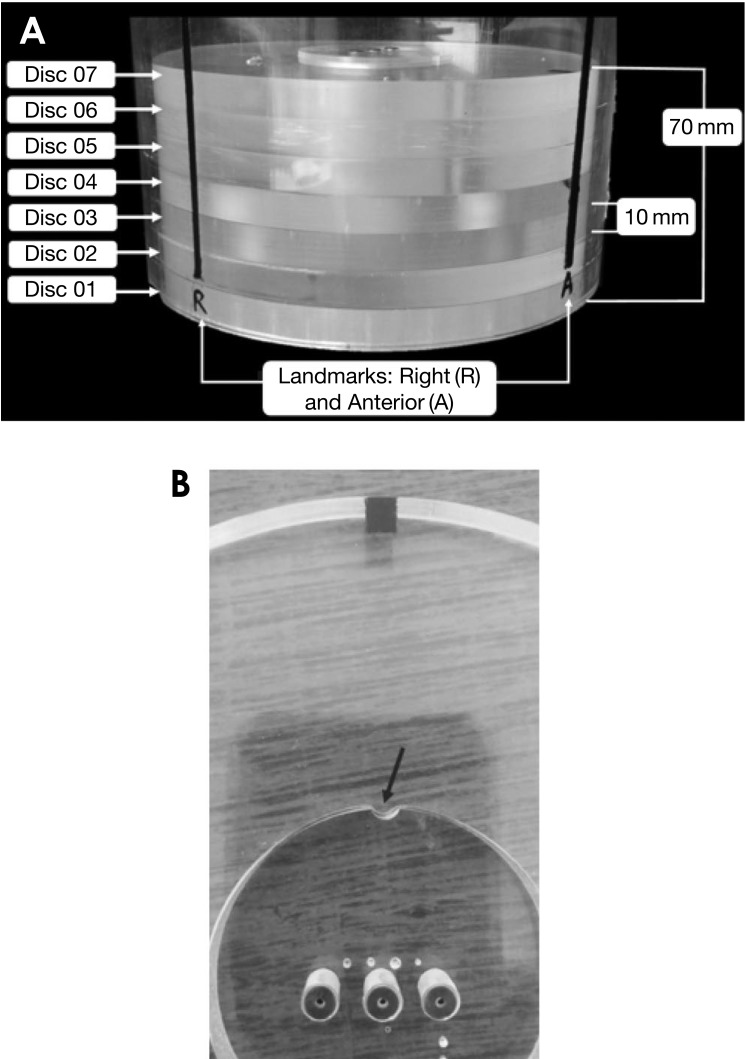
At the bottom of the phantom, disc 1 allowed the evaluation of geometric accuracy via the measurement of distances between the micro-holes. Disc 2 was a homogeneous PMMA disc (without drilling or landmarks), used to evaluate the image noise and uniformity. Disc 3 had a hole with air placed in the center of the PMMA disc. Further, disc 4 contained 5 elements with different densities placed in the periphery and the center of the disc: polyvinylchloride (PVC), polytetrafluoroethylene (PTFE), nylon, Delrin (polyoxymethylene), and polypropylene (PP). The rods inserted were 15 mm in diameter and 10 mm high. Both discs 3 and 4 were used to assess the contrast-to-noise ratio (CNR) and the signal-to-noise ratio (SNR). However, when the exposure protocol or CBCT unit had a small FOV (≤100 mm), only the centered rods were used. Disc 5 allowed the evaluation of the spatial resolution (5 line pairs/cm [lp/cm] to 16 lp/cm) by the bar pattern. Low-contrast assessment was evaluated with disc 6. In this disc, 7 rods of PP with diameters of 7 mm, 6 mm, 5 mm, 4 mm, 3 mm, 2 mm, and 1 mm, all 10 mm high, were inserted into the PMMA disc. In the upper part of the phantom, disc 7 was used to evaluate the artifact index. This final disc had a small disc inserted (50 mm in diameter and 10 mm in height) with 3 titanium implants (5 mm in diameter and 10 mm in height) to produce the metallic artifacts. The implants were located in the same plane and in parallel.
CBCT phantom acquisition was performed using 3 different CBCT scanners: NewTom™ 5G (QR srl, Verona, Italy), Cranex® 3D (Soredex Oy, Tuusula, Finland), and Scanora 3D (Soredex Oy, Tuusula, Finland). The experimental tests were conducted according to the exposure parameters available in each device, with current and optimized protocols.
To ensure that the phantom was correctly positioned within the FOV, before the phantom acquisitions, a scouting view was performed. A single scan was sufficient to include the whole phantom. The images were exported and viewed using ImageJ version 1.49e (National Institutes of Health, Bethesda, MD, USA).
Phantom-dedicated software
The CBCT quality assurance (QA) software was developed on ImageJ (National Institutes of Health, USA), to analyze image quality. After the phantom image acquisitions, Digital Imaging and Communication on Medicine (DICOM) images were opened in the ImageJ software and the user identified the directory where the images were saved. The DICOM header was read to identify the manufacture, the number of images, the voxel size (mm), FOV (mm), tube voltage (kV), tube current (mAs), exposure time (ms), and dose area product (mGy·cm2). Information from the equipment manufacturer indicated the image acquisition range orientation (top to bottom, or bottom to top).
After this procedure, the macro created an 80-mm circular region of interest (ROI) in all the image centers to identify the highest standard deviation pixel value, which corresponded to disc 03, which had a hole inside, with the air corresponding to the lowest pixel value. Based on the automatic image selection of disc 03, the positioning of the phantom was verified based on a square ROI; that is, analyzed using rectangular vertical and horizontal ROIs to identify the greatest standard deviation. The square ROI definition was based on the central part of the phantom, considering the vertical number of pixels, divided by 3 (Fig. 3).
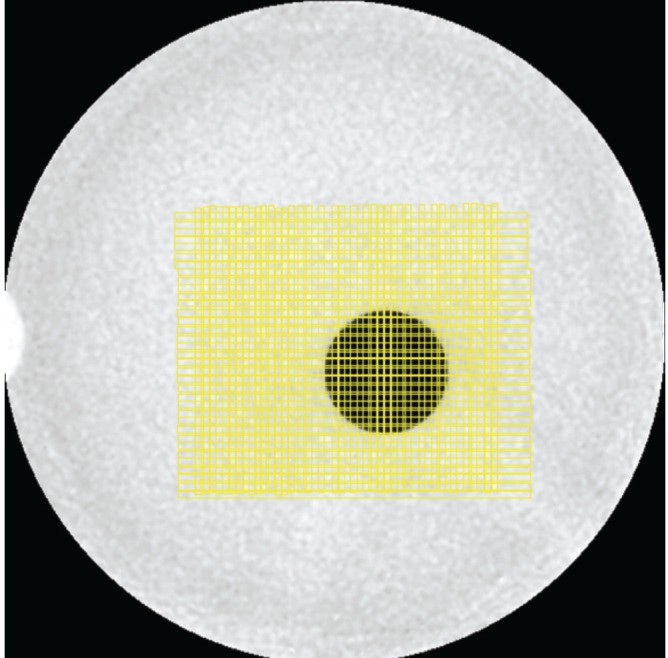
If the phantom was not well positioned according to the isocenter, the position of the ROI was automatically corrected in the image. Based on the result of the maximum standard deviation of the ROI, the center of the image was identified by its coordinates in the x- and y-axes. Thus, this automatic process reduced variability due to the lack of operator skill or the observer's experience in handling of the phantom. After the identification of disc 3, the best image per disc was selected in the order presented in Table 2.
An image for each of the 7 discs was selected, meaning that 7 images were evaluated in total. The ROIs used for image quality analyses were created in the same points of interest in the phantom based on the matrix and voxel size previously detected on the DICOM header. This allowed the software to be adapted to different manufacturers.
ROIs for image quality analysis were automatically defined based on image coordinates from the known distances of structures on the phantom. The image quality parameters evaluated were: SNR, CNR, image uniformity, image noise, geometric accuracy, spatial resolution, low-contrast resolution, and the artifact index. The methods are described below.
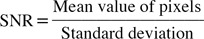
To evaluate the SNR, 6 circular ROIs (diameter, 8 mm) were placed in 6 elements of different densities: PTFE, PP, nylon, Delrin, air, and PMMA. These elements represented the signal response of different structures. The macro obtained the SNR values as:
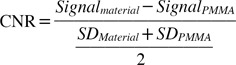
The CNR was evaluated using PTFE, PP, nylon, Delrin, air, and PMMA. A circular ROI (diameter, 8 mm) was drawn in the center of each material. For FOVs smaller than 100 mm in diameter, only the centered objects placed in disc 4 were evaluated. However, the air was evaluated using disc 03. The CNR value was calculated as: where Signalmaterial is the mean pixel value of the material; SignalPMMA is the mean pixel value of the background (PMMA), SDMaterial is the standard deviation of the material, and SDPMMA is the standard deviation of the background.
Low-contrast resolution is related to the ability to discriminate structures with slight differences in attenuation properties. Low-contrast resolution is commonly expressed as the minimum detectable size of an image structure relative to the contrast background. Low contrast was obtained through disc 6, on which 7 ROIs, 5 mm in diameter, were constructed in each polypropylene rod. The polypropylene rods had diameters of 7 mm, 6 mm, 5 mm, 4 mm, 3 mm, 2 mm, and 1 mm, with heights of 10 mm. Another ROI placed on PMMA, with the same dimensions (5 mm) and the same slice, was used to represent the background values. Low-contrast assessment was performed using polypropylene and a PMMA background and calculated using the CNR (Equation 2). Polypropylene has subtle differences from PMMA, making this arrangement suitable for representing low-contrast resolution.
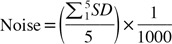
The image noise was evaluated from the application of circular ROIs (diameter, 30 mm) corresponding to one-fifth of the phantom diameter (Equation 3). These ROIs were positioned in the center of disc 2. Noise was considered as the standard deviation from the average value in 5 consecutive axial sections and calculated as:
The geometric accuracy was obtained from the known values of the distances between the micro-holes, which were measured and compared with known distances (10 mm), both vertically and horizontally.
The spatial resolution was evaluated by the bar pattern (5 lp/cm to 16 lp/cm) located in disc 5. A linear ROI in the center of the bar pattern was plotted, and a graph representing the spatial resolution was constructed.
Image uniformity was evaluated using the pixel intensity measurements obtained from disc 02. ROIs (diameter, 10 mm) were placed around the periphery, and also in the center (1 ROI) of the PMMA. The measurements were made in a transaxial slice and calculated using: where Max is the maximum mean pixel intensity of the disc 5 ROIs and Min is the minimum value of the mean pixel intensity of the ROIs.
The artifacts were measured on disc 7 of the phantom, and the mean pixel value in PMMA was obtained without the presence of metallic objects. The value of the pixel intensity from disc 7 was subtracted from the blank PMMA, and only pixels with a high signal from the metallic artifact were shown. Two ROIs were drawn around the implants, and the mean values of the adjacent exposed metal objects were obtained. The artifact index was measured as: where MPART and MPPMMA are the mean pixel values in the adjacent area of the rods and PMMA, respectively.
The metallic objects produced higher values than the PMMA; thus, a higher artifact index value was attributed to a greater contribution of the metallic artifacts.
Finally, a report was generated containing the results and an analysis of the information. In addition to quantitative information regarding image quality indicators, exposure parameters, dose area product (DAP), and the next date for quality control tests were also presented.
The results can be exported for further processing as graphical plots. The program can run independently of the operating system and has the possibility to add new functions.
Quality control data records and management
The data were automatically exported to Microsoft Excel (.xls), where they were stored in a database and saved in the Portable Document Format (.pdf). In Excel, specific informatics code was developed in Microsoft Office Visual Basic for additional processing of the data and to record the results. This system also informs the user when new tests should be performed.
Go to :
Results
The software was tested in 3 CBCT units available on the market, using 7 protocols, as shown in Table 3. The scanners had different configurations (tube potential, voxel size, and product current time) and mode of exposure (high and low dose/resolution).
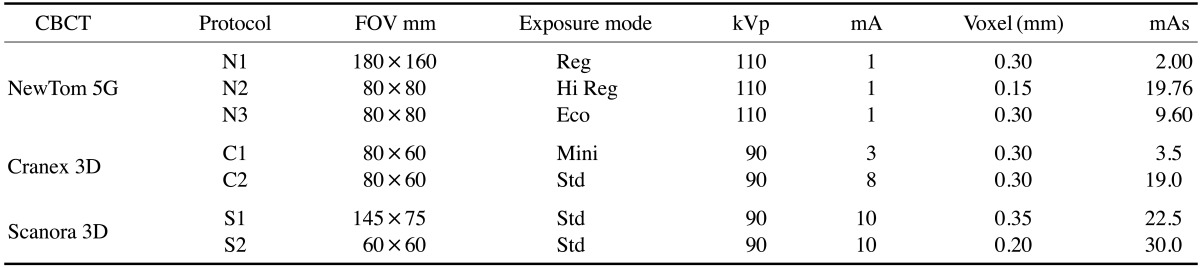
The software performed automatic measurements and calculations of the SNR, the CNR, image uniformity, image noise, geometric accuracy, spatial resolution, low-contrast resolution, and the artifact index. Figure 4 shows the imaging of the phantom and each slice used.
 | Fig. 4Images obtained in CBCT scanners. A. Disc 1 for geometric accuracy, B. Disc 2 with ROI's positioned to evaluate the image uniformity, C. Disc 2 with a circular ROI (Ø 30 mm) in the center, D. Disc 3 with central hole containing air, E. Disc 4 used to evaluate the SNR and CNR in centered and periphery elements, F. Disc 05 with pattern bars, G. Disc 06 to evaluate the low contrast, and H. Disc 7 with three metallic rods and subtracted PMMA background
|
The results obtained through CBCT QA are presented in Table 4. It was possible to observe that the SNR and CNR differed among the scanners and protocols. The highest-density objects (PTFE and PVC) presented higher values of the SNR and CNR, but were more dependent upon the exposure protocol. PP showed a lower SNR value in all protocols, while nylon displayed a lower CNR value. For the Scanora 3D and NewTom 5G, the SNR and CNR values from the centered and peripheral rods were evaluated. The values obtained in NewTom 5G with the N1 protocol did not show any significant differences, and the same behavior was observed in Scanora 3D with the S1 protocol. Regarding noise, the N1 protocol (NewTom 5G) obtained a higher value (6.66) than the other 6 protocols. In contrast, the N2 protocol presented a lower noise level than the other CBCT units.
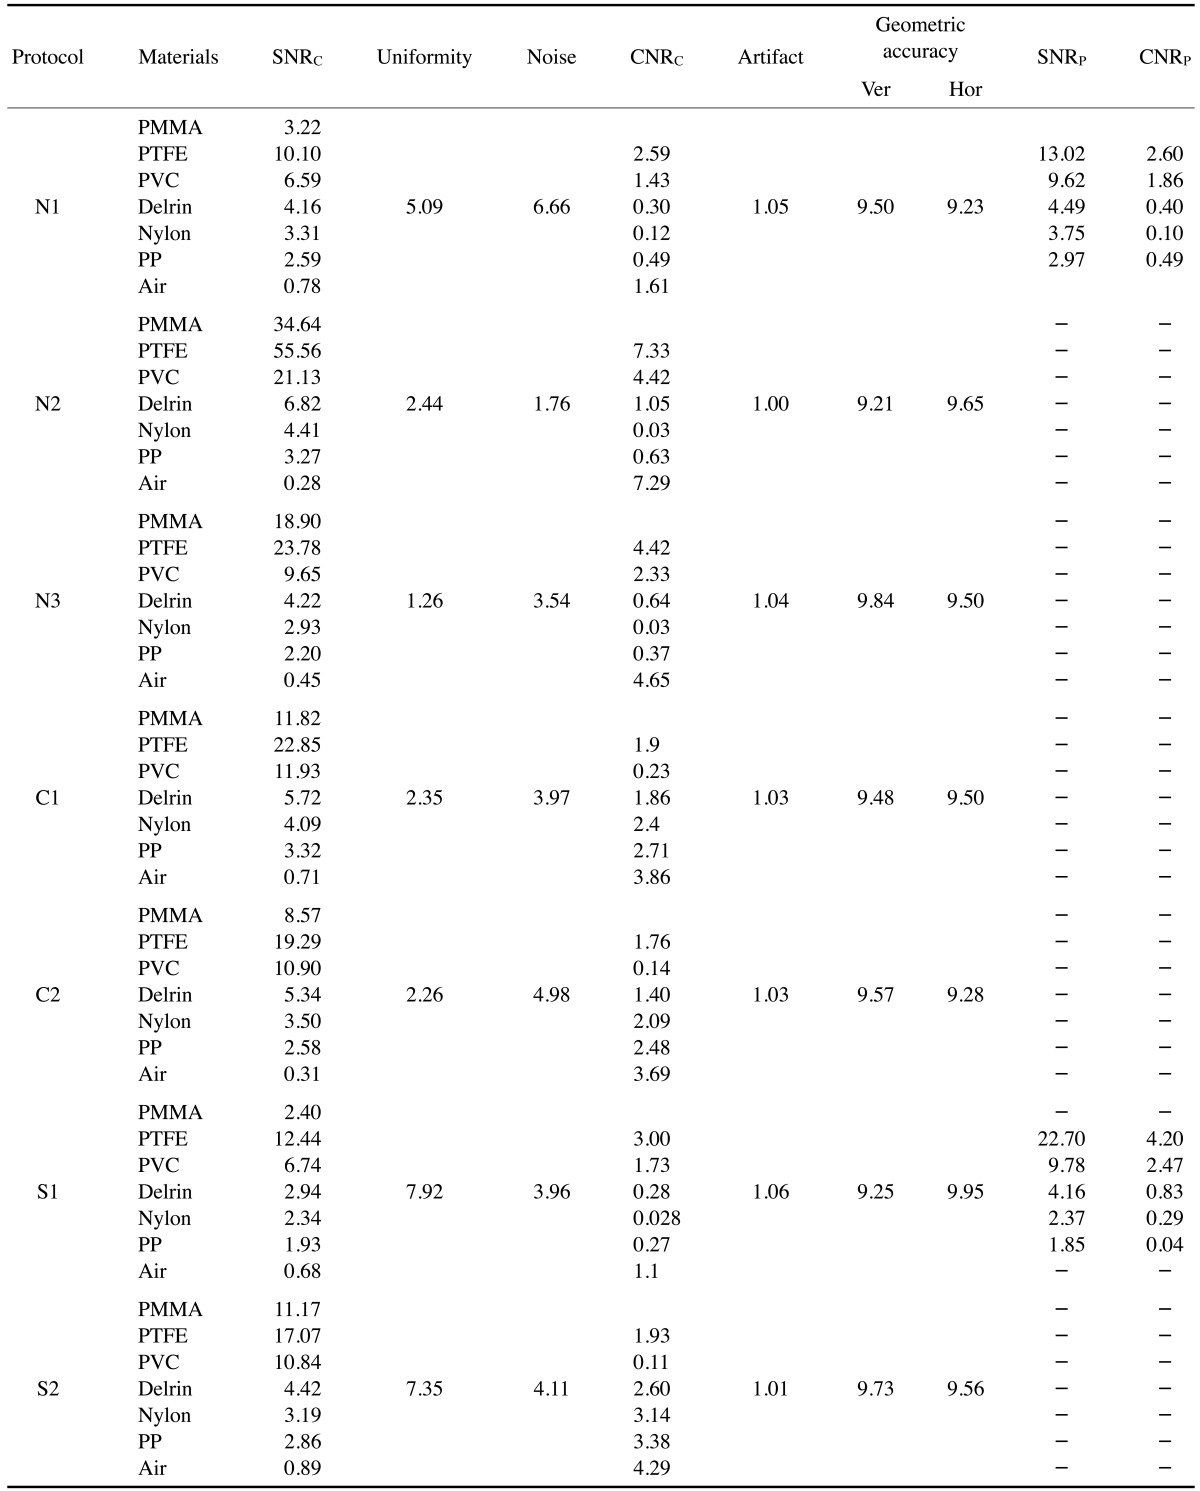
Table 4
Image analysis results for Cone beam computed tomography scanners and protocols
SNRC: signal to noise ratio in the center, CNRC: contrast to noise ratio in the center, SNRP: signal to noise ratio in the periphery, CNRP: contrast to noise ratio in the periphery, Ver: vertical, Hor: horizontal, PMMA: Polymethyl methacrylate, PTFE: polytetrafluoroethylene, PVC: Polyvinyl chloride, PP: polypropylene
![]()
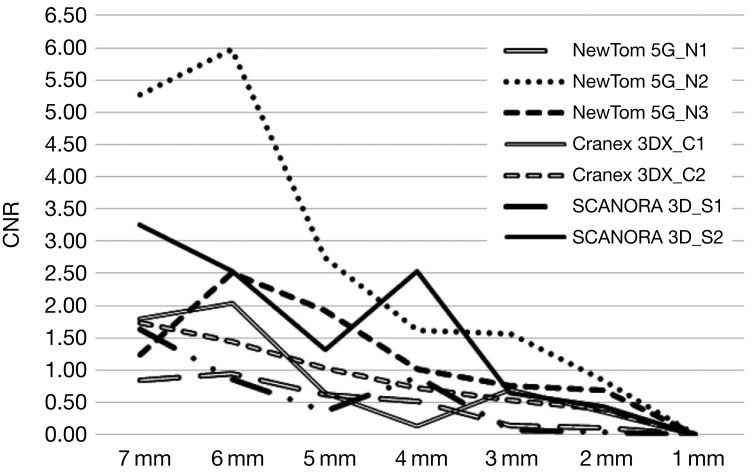
The image uniformity was also evaluated, and the FOV of 60×60 mm showed a significant non-uniform gray value distribution. For the NewTom 5G, the images also showed a non-uniform gray value distribution, mainly with the N1 protocol. In contrast, the N3 and N2 protocols showed a slightly uneven gray value distribution, as did the Cranex 3D. The results of low contrast are shown in Figure 5. The CBCT units were not able to resolve the 1 mm rod.
Geometric accuracy was assessed by measurements (vertical and horizontal) of the distance between 2 points. This test showed that the distances between the micro-holes were smaller than 10 mm.
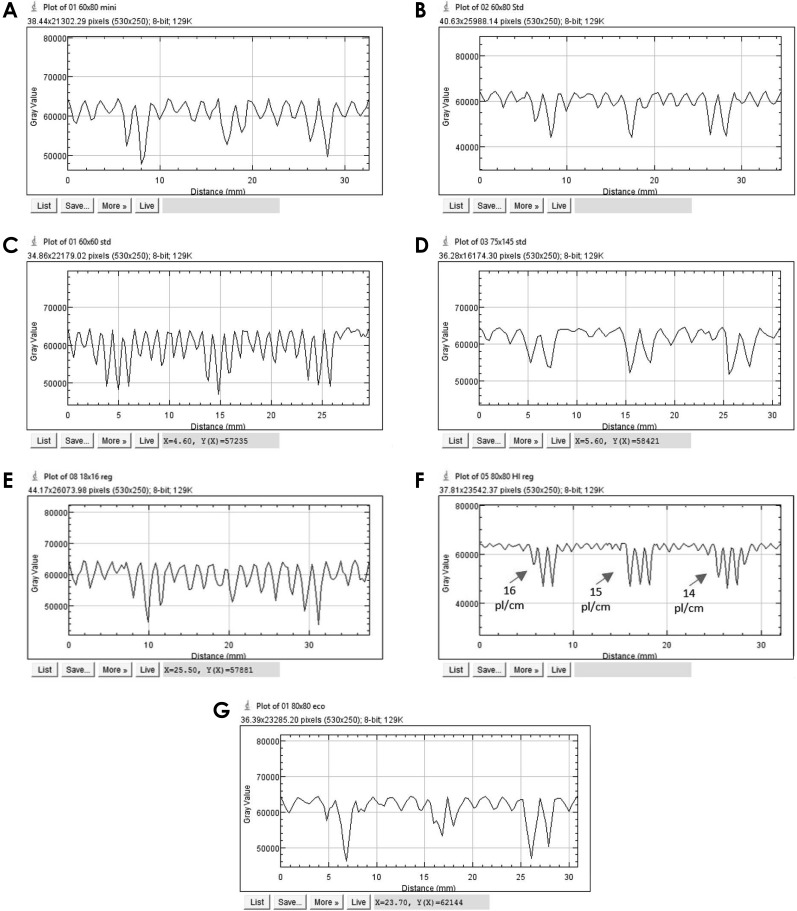
There were no significant differences in the presence of metal artifacts across the protocols evaluated. The spatial resolutions were obtained and are presented in Figure 6. The first gap represents the visualization of 15 lp/cm, the second of 14 lp/cm and the third of 12 lp/cm. The N2, C2, and S2 protocols allowed the visualization of 15 lp/cm. Other protocols were very strongly influenced by noise and, consequently, low radiation doses.
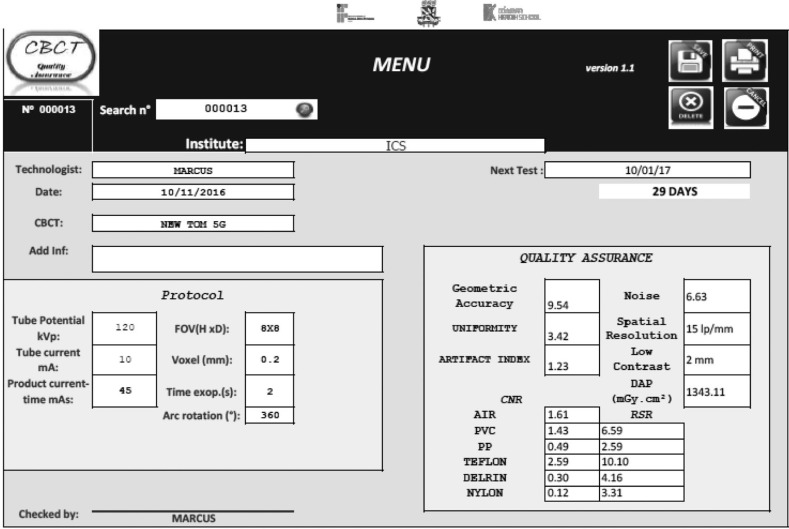
One of our goals was that the software should be user-friendly and as objective as possible for the user. Therefore, after installation, all results were obtained, presented in a report, and stored in an .xls file, as shown in Figure 7.
Go to :
Discussion
In the literature, studies have evaluated image quality through different methods including the influence of exposure parameters, or based on an subjective analysis using the visualization of anatomical reference points in anthropomorphic phantoms, skulls, or patient data, which can lead to clinically relevant results.16 However, this type of evaluation is based on the observer's experience and is also dependent upon the monitor quality.17 CBCT QA, with a standardized method, is extremely important and should be performed frequently. In addition, by performing tests proposed by the manufacturer or regulatory authority, it is possible to detect, for example, deterioration in the accuracy and the difference in contrast between structures over time, indicating that there are problems with the scanner.18 Presently, applying the recommended guidelines is time-consuming and requires qualified personnel in the health services to perform the tests. In this study, a fast and user-friendly software program was presented, in which any staff member can perform the tests, even an inexperienced user. ImageJ is open-source software and allows one to add, adjust, or implement other functions within the plugin. Since ImageJ is free software, this is an inexpensive method, as it does not require a user license. Bamba et al.11 considered this approach very useful and encouraged the development of plugins in ImageJ to evaluate image quality in CBCT with phantoms. Donini et al.19 showed the feasibility of software implemented as a plugin, such as ImageJ, to perform an image check of X-ray based projection radiography, mammography, and angiography/fluorography.
This study presented a new method to evaluate image quality parameters in CBCT. The image uniformity showed different values between CBCT devices in uniformity and in SNR. According to Reeves et al.,20 there is a lack of gray-level uniformity in CBCT images. These variations could be influenced by the applied scanning parameters. For example, when large voxels are used, the noise tends to be lower. However, maintaining a constant tube potential and increasing the product current time, using smaller voxels, will result in the image being more uniform. Furthermore, the distribution of gray levels and noise signal may also be related to the amount of mass within the FOV, the use of a wide cone angle (leading to degradation and artifacts), and the size of the reconstructed voxel.1521 For the C1 protocol in the Cranex 3DX, even using a higher current exposure time (19 mAs) than the C2 protocol (3.5 mAs), the SNR and uniformity showed only subtle differences. The C2 protocol compensated for the lower mAs by increasing the number of photons owing to the large FOV.
Likewise, an objective evaluation of the effect of downsampling on contrast resolution through calculation of the CNR is encouraged in image quality assessment.22 The CNR increased as a function of increased tube current time. However, owing to the wide range of voxel sizes used in dental CBCT, it is not possible to compare CNR values from different studies, even if the same phantoms or materials were used.23
One of elements that affected the image quality was the presence of metallic artifacts due to high-density objects such as implants. Artifacts are shown as visible structures that do not belong to the object in the image. Thus, artifacts have been argued to be one of the main causes of interference with the diagnostic quality of computed tomography and CBCT.2425 Furthermore, this effect could reduce the contrast and obscure structures, thus limiting the anatomical information. The phantom that was used had 3 metallic implants that generated artifacts. The software found the slice with the implants, made 2 rectangular ROIs parallel to the implants, and calculated the artifact index. Even though the results showed no significant differences in the artifact index value, it was possible to evaluate the effect of the adjustment of exposure parameters, such as the increase of the current exposure time or the peak tube potential.26
Spatial resolution is an important image quality parameter, especially regarding anatomical details.27 The N2 protocol showed the best spatial resolution, followed by S2 and C2. This could be related to the use of smaller voxels: the voxels in N2 were 0.15 mm, and 0.2 in S2 mm. However, according to a 2011 study by Pauwels et al.,15 voxel size alone is a poor predictor of spatial resolution. The variability of the number of line pairs found between the CBCT equipment was not only determined by the spatial resolution of the system, but was also affected by noise and geometrical accuracy.16 In addition, the spatial resolution of CBCT devices is related to the physical pixel size of the sensor, the reconstruction technique, and other factors.27
CBCT is currently exceedingly popular among orthodontists, mainly for craniometric measurements, determining the location of supernumerary and impacted teeth, and orthognathic surgery planning. The accuracy of images has been studied using different scanners,28 radiographic methods, and 3-dimensional surface-rendered imaging.29 In this study, all measurements were lower than the real values (10 mm). These variations may have been influenced by the voxel size and the number of projections.1130 Therefore, clinically, variations in distance measurements should be considered, independently of the protocol or CBCT unit.
The low-contrast test showed that the rod with a diameter of 1 mm was not observed in the 3 CBCT units. This suggests that care should be taken in the investigation of structures with low contrast and a small size. Moreover, some rods were influenced by the artifacts yielded by metallic implants, such as in disc 7. However, the device's contrast resolution was not limited by this factor.
Periodic testing is of utmost importance, both in acceptance testing and to investigate image degradation over time. Our software allows data to be stored in Microsoft Excel (with functions that contain macros to print, save as .pdf, and others), such that performance over time can be monitored, and the user is notified when new tests should be performed. Other advantages relate to the fact that manufacturers or researchers could use this software to test equipment prototypes, as well as to evaluate new image manipulation tools or new reconstruction algorithms. In this study, a new method to improve the quality control of CBCT images was presented. The user is not required to spend any time searching for the image that should be used, consequently leading to faster results and reducing the risk that inappropriate images could be used.
The main objectives of this study were to demonstrate the application of this software and to show its viability for performing image quality control. However, it was not the focus of this study to evaluate the influence of the scanning protocol.
In conclusion, the present study was performed to showcase the development of a new package to evaluate image quality in CBCT. The evaluation of this package showed results that are comparable with the image quality indicators found in the literature. The macro provided a fast, low-cost, and feasible method for analyzing CBCT images. In addition, this program can be feasibly used to perform acceptance testing and to evaluate image quality degradation over time.
Go to :
 XML Download