

 PDF
PDF ePub
ePub Citation
 Print
Print


Introduction
Dual-energy radiology refers to a range of X-ray imaging methods that exploit the spectral properties of a material's X-ray absorption. These methods are rooted in the work of Alvarez and Macovski in the mid-1970s, who proposed using a separation of a material's absorption into the different underlying atomic effects in conjunction with multiple X-ray images for various diagnostic applications.12 As early as the late 1970s, materials could be classified using dual-energy computed tomography.3
With the help of the Beer-Lambert law, the absorption of X-ray radiation after penetrating a material can be calculated. The absorption depends on energy, thickness, and the attenuation coefficient. Because of scattering, the attenuation coefficient µm is composed of the absorption coefficient τm and the scattering coefficient σm. Depending on the energy involved, the prevalent phenomenon can be Thomson scattering, the photoelectric effect, the Compton effect, or pair production.45 While the Compton effect starts to be dominant above 100 kV, the photoelectric effect is proportional to Z5, where Z refers to the atomic number of the absorber.6
Four different techniques that take advantage of the energy dependence of absorption are generally discussed in the literature: voltage-switching, dual-layer (sandwich) detectors, dual-source computed tomography (DSCT), and the use of two ordinary computed tomography images.7 Early applications used X-ray tubes switching between different operating voltages. This so-called kV-switching method is used in contemporary applications, with typical voltages between 80 kV and 140 kV and voltage changes every 0.2 ms.8
The first implementation of computed tomography with two integrated tubes (DSCT) was in 2006, and a distinction could be made between iodine and tissue, as well as collagen, in a patient study without requiring an additional radiation dose.910 Today, dual-energy methods are used in a variety of diagnostic areas for both clinical and research applications, including mammography,1112 angiography,1314 oncology,715 and bone densitometry.16 Despite the numerous medical applications of dual-energy methods, no similar technique is currently available for two-dimensional dental examinations. In contrast to the current medical applications of dual-energy methods, dental X-ray units operate at energies lower than 90 keV, which is an energy range with less variation in the absorption properties of specific materials. Depending on the material and energy, either the Compton effect or photoelectric effect dominates.417
In this study, we propose a technique for processing dual-energy dental images with the goal of classifying the materials present in the sample (an example is given in Figure 1). The feasibility of this technique was then investigated through simulations of a range of materials of interest. Experimental results using this technique for a number of artificial samples are presented.
Materials and Methods
In order to identify the materials present in a dental X-ray image, the spectral properties of the attenuation coefficient can be used. To this end, either multiple input spectra or filters placed at the front of the detector can be used. In the following section, the use of two different X-ray spectra is proposed as a way of determining material properties in dental applications.
Theory
This study considered an energy- and position-dependent attenuation coefficient µ(E,x,y,z) that describes the absorption properties of the X-ray target. The X-ray radiation was assumed to penetrate the target in the z-direction, hitting a detector at a pixel with coordinates (x,y). For the dual-energy analysis of the target, two X-ray images were taken with different photon intensity distributions Ii(E), with I ∈ {1,2}. The spatially resolved detector count could then be modeled in the following form: with the detector integration time T, the incoming distribution of photon intensity Ii(E), the energy- and position-dependent attenuation coefficient µ(E,x,y,z), and the detector absorption efficiency g(E,x,y).

For subsequent image processing, relative detector counts N̅i(x,y) were calculated by normalizing Ni(x,y). Then, the inverse tangent of the quotient of the log-normalized detector counts was considered:
The quantity h(x,y) was selected in this form since it is independent of target thickness for homogeneous targets and for monochromatic input photon spectra. The quantity h(x,y) can likewise be interpreted as the angular component of a polar coordinate system when transforming the natural logarithm of the relative count rates N̅1(x,y) and N̅2(x,y). Following the interpretation of h as angle component, the corresponding radial coordinate reads as

The value of h(x,y) could then be used to identify different classes of materials at image pixel (x,y). For the remainder of this study, a simple linear classifier was examined. In total, K different intervals κk of the form [hk,<, hk,>] were considered that satisfied the property ∪kκk=[0,2π]. The interval κk into which the angle Φ(x,y) fell determined the classification of the pixel (x,y). This procedure resulted in a classification for every pixel of the image. To combine the classification information with the intensity information of the single X-ray images in a single final image, the identified classes were mapped onto distinct colors (red, green, and blue channels), whereas the intensity values were mapped onto the alpha channel.
Simulation
To show the feasibility of the proposed classification method, computer simulations were performed to model the X-ray tube spectrum and absorption properties of different materials. For the purposes of the simulation, it was assumed that the X-ray spectrum was composed of only the bremsstrahlung of the tube voltage Utube, and followed Kramers' law for the spectral distribution of X-ray radiation produced by electrons hitting a solid target:
The distribution of photon intensity (photon flux) I(λ) over the wavelength λ depends on the minimum wavelength of the radiation given by the Duane-Hunt law (λmin=hc/eUtube) and a constant K, which is proportional to the atomic number of the tube's target material. The simulation assumed that the radiation first passed the aluminum filter of the X-ray unit with thickness dfilter. The simulated attenuation coefficient then contained a polymethyl methacrylate (PMMA) layer of thickness ddisc, which was introduced to simulate a layer of soft tissue. For a given sample material m of thickness dm, the total attenuation coefficient in the simulation was described as a piecewise constant function given by
The symbols µAl(E), µPMMA(E), and µm(E) describe the energy-dependent attenuation coefficients of aluminum, PMMA, and the sample material, respectively. All attenuation data was taken from the xraylib software library.1819 The detector absorption efficiency was assumed to be constant, with g(E,x,y)=1 for all considered energy ranges. The simulation evaluated the photon count rate (Eq. 1) for a number of different materials m and typical thicknesses d. The following simulation parameters were used: dfilter=2.5 mm, ddisc ∈ {2 mm, 15 mm}, U1=54 kV, U2=84 kV.
Experimental setup
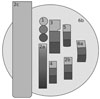
In the experiments, three sample holders, each based on a PMMA disc (125 mm diameter, 2 mm thickness; Biocryl 2.0 mm, SCHEU-DENTAL GmbH, Iserlohn, Germany), were used. Materials of different sizes were glued onto the disc using cyanoacrylate adhesive (Sekundenkleber Gel Stark+Schnell, Tesa SE, Norderstedt, Germany).
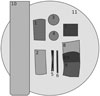
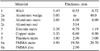
The first sample holder (Fig. 2) carried samples made of PMMA, titanium, aluminum, zirconia (zirconium dioxide), and Wisil, which is a cobalt-chromium-molybdenum alloy. An additional aluminum wedge (40 mm×60 mm×10 mm) was used to determine the X-ray penetration depth. For most materials, three different thicknesses were used to investigate thickness-dependent effects. Details on the materials and thicknesses can be found in Table 1.
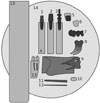
In order to resemble typical dental material compositions, the second holder (Fig. 3) bore a human tooth, a ceramic crown (VITA In-Ceram YZ, Vita Zahnfabrik H. Rauter GmbH & Co. KG, Bad Säckingen, Germany), a golden bridge, dental implants (BEGO Semados®Implantat TiPurePlus, BEGO Implant Systems GmbH & Co. KG, Bremen, Germany), a veneer made of composite (Signium Composite, Heraeus Kulzer GmbH, Hanau, Germany), materials of endodontic therapies (RealSeal, Sybron Endo, Glendora, CA, United States; Guttaperchaspitzen PluLine80, Pluradent AG & Co KG, Offenbach am Main, Germany; AH Plus Jet, Dentsply International, York, United States) and the lower jawbone of a pig (German pig from Helwig-Handels KG, Schwalmstadt, Germany).
The third sample holder (Fig. 4) focused on materials used for endodontic therapy and included various root filling materials (RealSeal, Sybron Endo, Glendora, CA, United States; Guttaperchaspitzen PluLine80, Pluradent AG & Co KG, Offenbach am Main, Germany) and sealers (AH Plus Jet, Dentsply International, York, United States; Apexit Plus Refil, Ivoclar Vivadent GmbH, Schaan, Liechtenstein; ROEKO GuttaFlow 2, Coltène/Whaledent GmbH+Co. KG, Langenau, Germany), as well as composites (GrandioSo, VOCO GmbH; exp. Ormocer LC, VOCO GmbH, Cuxhaven, Germany) and compact bone (German pig from Helwig-Handels KG, Schwalmstadt, Germany).
The sample holders were fixed to an aluminum rod of the X-ray unit normally used for calibration purposes, which is also presented in the schematic drawings.
Our experiments used a commercial dental X-ray unit (Planmeca ProMax 3D mid: an all-in-one cone-beam computed tomography unit capable of 3-dimensional and 2-dimensional imaging). It has a flat panel sensor with an active surface of 302 mm×249 mm for cephalometry, with a pixel size of 139 µm. The resulting image size of a full unprocessed scan was 2461×2052 pixels. The anode voltage can be varied from 54 kV to 84 kV at a current of 1-16 mA. Radiation passed through a 2.5 mm aluminum filter.
The X-ray unit has a number of image enhancement filters (most importantly, the S-curve to mock analog films), which were all disabled prior to taking images. This ensured that pixel values scaled linearly with intensity. The images were taken with X-ray anode voltages of 54 kV and 84 kV. Keeping the exposure time at a fixed value of 18.7 s, the current was matched to obtain nearly the same dose on every image. The low-energy images were acquired with a current of 16 mA, and the high-energy images with 4 mA. This resulted in dose area products of 42 mGy/cm2 and 38 mGy/cm2, respectively. The dose area products were read from the touch screen of the X-ray unit after the exposure.
The images were then transferred from the X-ray system as raw image data and processed in a custom-made computer program. To handle unintended movements between the recording of two images at different energies, a further preprocessing step was introduced to identify a linear transformation between the images. Images were further corrected for background adjustments by the software of the X-ray unit.
Results
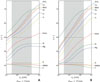
This section first presents the results obtained from the computer simulations. The results are shown in Figure 5 for two different values of ddisc.
In general, the value of h varied with the thickness of the penetrated material. Varying the thickness ddisc of the surrounding soft tissue affected the values of h for smaller thicknesses dm of the sample only. Within the thickness range of interest for dental applications (shaded in gray), different regions with similar values of h could be distinguished among the simulated materials:
Light non-metals: Elements with relatively low atomic numbers, including most soft organic materials (h<51°).
Light metals and constituents of bone: Elements with a medium atomic number, up to 20 (e.g. magnesium or aluminum, 51°<h<60°). The principal component of bone is tricalcium phosphate (Ca3(PO4)2).
Metals: Elements with higher atomic numbers (h>60°).
The simulation results indicated that a classification of different material categories based on atomic number is feasible with the proposed method, as long as there is no thick layer of soft tissue superimposed on the target sample.
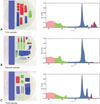
Our experimental results supported the findings of the computer simulation: Figure 6 shows colored images of the test samples, along with the distribution of h found in the images. The distribution of h showed distinct peaks that were due to the different sample materials present in the image. Although different thicknesses of the same materials were included in the sample, the values of h were found to be very similar for identical materials, as indicated by the simulation. With the help of the simulation results presented earlier, distinct peaks could be assigned to materials in the sample. For example, the PMMA portion of the sample appeared as a broad peak around h=49.0°. The thin PMMA disc with low radiation absorption introduced a large error in h. In contrast, aluminum appeared as a sharp peak at 57.5°. Heavier materials, such as titanium, had peaks at values of h above 60°.
To colorize the images based on a pixel's h value, a segmentation of h into 4 regions with cut-offs at 47.3°, 52.2°, and 60.4° was considered, and shaded in light red, green, blue, and dark red. Cut-offs were chosen based on the prominent peaks in the histogram. Prior to the computation of h, images were processed with a Gaussian filter. The initial gray value of the image was used to set the alpha channel of the final colored image. In general, the chosen methodology together with this segmentation led to a proper identification of the materials present in the samples.
When comparing experimental results with the simulation, very similar material peaks and cut-offs were obtained. The simulation for a range of materials suggested cut-offs around h=51° and h=60°, which was very close to the experimental results. Moreover, the location of the distinct peaks in the distribution of h was explained by the simulation results.
Discussion
This study has shown that dual-energy imaging works in the low-kV region of dental applications and allows the generation of colored two-dimensional X-ray images. The proposed method provides a relatively simple approach to classify groups of materials with similar atomic numbers from images acquired with commercial X-ray units. The technique was evaluated in a simulation and with experimental data from purpose-built sample holders.
The samples investigated in the experiments illustrated some of the limitations of the methodology: first, the technique depended on a sufficient penetration of the sample by radiation of both spectra. Insufficient intensity at the detector led to misclassifications, which could be observed, for example, at the gold bridge of the second sample holder. These areas with almost no intensity on the detector corresponded to an angle of h of 45.0° because there was no difference in the two images. Since these areas were mostly composed of metals with a high atomic number, they were dyed in light red to stress their correspondence to the dark red color. Second, any misalignment between the two images will lead to classification artifacts in the result. This effect was most prominent in small structures such as the gutta-percha points of the second sample holder. Third, material superposition will affect results from two-dimensional images. Superpositions are always present in extraoral images because of the cheek, and may require correction or lead to misclassification.
The problem of superimposed materials in real dental images could partly be resolved by also considering the gray values of the acquired images in addition to the angle h. The benefit from this more advanced technique is clearly shown in Figure 5: instead of classifying materials based on horizontal lines in the diagram, one could instead use sloped lines or even non-linear boundaries, depending on the gray value ρ. This would potentially decrease the classification error in situations with varying amounts of superimposed soft tissue, and this possibility is of interest for further research.
One of the disadvantages of the proposed technique is the necessity of two single images, which would result in a double dose for the patient. However, the dose necessary for analog film-based X-ray examinations is still higher than the doubled dose for colored, digital images.20 Additionally, using dual-layer detecting systems with appropriate filtering instead of voltage-switching methods would lead to doses similar to conventional grayscale X-ray units.
It is our hope that multispectral radiographs will prove to be beneficial for both dentists and their patients. At the time of birth, everything in the oral cavity is of natural origin, but throughout life, various synthetic materials are added. The oral cavity often constitutes an extraordinary region of the body in the sense that it permanently contains many different materials with high atomic numbers. This is caused by the materials used for dental restorations, which may contain radiopaque pigments such as barium sulfates (for example, in ROEKO GuttaFlow2, Colténe/Whaledent GmbH+Co. KG, Langenau, Germany) or bismuth (for example, in Apexit Plus Refil, Ivoclar Vivadent GmbH, Schaan, Liechtenstein). An unknown opaque structure in the bone or even in the nasal sinus can pose a challenge for the treating dentist, especially if the patient is unknown due to, for instance, an emergency consultation. Our technique would make it easier to differentiate between sclerosis (with typical atomic numbers around 20) and endodontic material (with atomic numbers up to 50 because of a radiopaque additive), or a retained root and a broken-off part of a bone-cutting bur or drill. The application of colored X-ray images would enable a fast classification according to the atomic number of the unknown structure, and thereby provide added diagnostic value. Additionally, gum tissue could be better distinguished from the image background, since it should appear as a green margin on the colored image. For patients, colored X-ray images increase the comprehensibility of diagnoses and treatments, as they simplify the identification of oral structures.
More work is needed to evaluate this method in a clinical context. Improvements of the method might include the use of dual-layer detectors or advanced algorithms that are able to cope with superpositions of soft tissue and other anatomic structures.
This study presents a novel technique for material decomposition based on dual-energy dental X-ray images and a demonstration of its feasibility in both a computer simulation and an experimental study using a commercially available dental X-ray unit.

 XML Download