

 PDF
PDF ePub
ePub Citation
 Print
Print


Introduction
Sialolithiasis is one of the most prevalent large obstructive disorders of the major salivary glands.1 The submandibular gland is the most frequently involved.2 The main clinical features are pain and swelling associated with eating and subsequent sialoadenitis.3
Various physical and chemical examinations, including ultrasonography, sialography, computed tomography, and magnetic resonance imaging, are commonly used to diagnose salivary gland diseases.4 99mTc-pertechnetate salivary gland scintigraphy is useful for the diagnosis of diseases that affect the salivary gland through the use of radionuclide-labeled compounds. This easy, noninvasive, and accurate method assesses the functional state and degree of injury to the gland, providing highly valuable clinical information.5 However, some authors described that 99mTc-pertechnetate salivary gland scintigraphy has rarely been used to evaluate salivary gland function; the role of this method in the diagnosis of diseases of the salivary gland has been neglected.67 Furthermore, to the best of our knowledge, the relationship between CT values of submandibular glands with and without sialolithiasis and salivary gland excretion measured using salivary gland scintigraphy has not been reported in the literature. The aim of this study was to investigate submandibular sialolithiasis with CT and scintigraphy, with a particular focus on the relationship between CT values of the submandibular glands and their excretion rate.
Materials and Methods
Patients
This retrospective study was approved by the ethics committee of our institution (ECNG-R-280). After providing written informed consent, 15 patients (8 males, 7 females; age, 20–89 years; mean age, 54.5 years) with submandibular sialolithiasis underwent CT and salivary gland scintigraphy at our university hospital from November 2013 to January 2017. The histopathological diagnosis of submandibular sialolithiasis was made by surgery in all cases.
Image acquisition
CT imaging was performed with a 16-multidetector CT scanner (Aquilion TSX-101A; Toshiba Medical Systems, Otawara, Japan) using the maxillofacial protocol at our hospital: tube voltage, 120 kVp; tube current, 150 mA; field of view, 240×240 mm; and rotation time, 0.50 s. The protocol consisted of axial acquisition (0.50 mm) with axial, coronal, and sagittal multiplanar reformation images.
Regarding salivary gland scintigraphy, after the intravenous injection of approximately 370 MBq of 99mTc-pertechnetate, salivary gland scintigraphy was performed for 60 minutes with a gamma camera (SNC-5100R and Scintipack 24000; Shimadzu, Kyoto, Japan) with a 128×128 matrix, and dynamic images were recorded on the computer at 1 frame per 20 sec. Forty-five minutes after the dynamic images started, 10% citric acid (0.50 mL) was administered orally to stimulate salivary gland excretion. The stored data were displayed on a screen (Radi- Force GX340; EIZO, Ishikawa, Japan) for analysis.
Image analysis
Two oral and maxillofacial radiologists, with over 20 years of experience, independently reviewed all images, and any discrepancies were resolved by consensus.
The size of sialoliths on CT was independently measured 3 times using CT software (INFINITT JAPAN, Tokyo, Japan) by each examiner to obtain a mean value. We used the mean value of the size of the sialoliths obtained by each examiner.
Each examiner used regions of interest (ROIs) to calculate the CT values of submandibular glands with sialoliths and the contralateral normal submandibular gland as the control group (submandibular gland without sialoliths) using CT software. Circular ROIs of each submandibular gland were drawn manually, and each examiner placed 3 ROIs with similar sizes within the submandibular gland to obtain a mean CT value. We used the mean values obtained by each examiner as the CT values of the submandibular gland of each patient.
Regarding the salivary gland excretion fraction using salivary gland scintigraphy, the data were digitally gathered and plotted on separate time-activity curves for the submandibular glands, and the ROIs of each submandibular gland were drawn manually. The salivary gland excretion fraction was defined as A (before stimulation test [counts/frame]) / B (after stimulation test [counts/frame]).
Statistical analysis
The relationships between the presence of a sialolith with CT values and scintigraphic results were compared using the Mann-Whitney U test for nonparametric data. These analyses were performed with the statistical package SPSS version 24 (IBM Japan, Tokyo, Japan). P values less than .05 were considered to indicate statistical significance.
Results
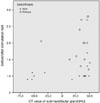
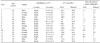
We plotted the before/after results of stimulation tests against the CT values of submandibular glands with and without sialolithiasis (Fig. 1). Table 1 shows cases of submandibular sialolithiasis with the results of CT and salivary gland scintigraphy. Of the 15 patients with submandibular sialolithiasis, 5 submandibular glands with sialolithiasis (33.3%) showed CT values of less than 0 Hounsfield units (HU). Furthermore, 5 of the 6 submandibular glands (83.3%) with CT values less than 0 HU had sialoliths. Furthermore, the number of sialolith glands showing decreased uptake was 12 (80.0%).
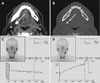
Table 2 shows the relationship between CT values and salivary gland excretion in the submandibular glands with and without sialoliths. The CT values in the submandibular glands with and without sialoliths were 9.9±44.9 HU and 34.2±21.8 HU, respectively (P=.233). Regarding the salivary gland excretion fraction measured using scintigraphy (Fig. 2), the A/B value in the submandibular glands with sialoliths (1.09±0.23) was significantly lower than in those without sialoliths (1.99±0.57, P=.000).
Discussion
Konstantinidis et al.8 stated that fat infiltration of the major salivary glands has been reported in several conditions: as part of the normal aging process in sialadenosis; in diseases related to fat metabolism, as in alcoholism, malnutrition, anorexia, bulimia, hypothyroidism, and diabetes mellitus; in HIV infections; and in autoimmune disorders such as Sjögren syndrome. Sumi et al.9 reported that CT could show some active inflammatory changes in glands affected by sialolithiasis; furthermore, CT in symptomatic patients showed that the affected glands had a greater density, while CT in asymptomatic patients showed that the affected glands had a lower density (due to fat deposition in atrophic glands). Garrett10 described differences in fat deposition in the submandibular salivary glands according to aging and chronic inflammation. In this study, 5 of the 15 submandibular glands (33.3%) with sialolithiasis showed CT values less than 0 HU, corresponding to so-called fatty degeneration. Furthermore, 5 of the 6 submandibular glands (83.3%) with CT values less than 0 HU had sialoliths. We suggest that sialolithiasis might be a factor contributing to fatty degeneration in the submandibular gland.
Sialolithiasis is diagnosed using clinical and radiographic methods.11 Furthermore, 99mTc-pertechnetate salivary gland scintigraphy is useful for the diagnosis of diseases that affect the salivary glands, as this noninvasive and accurate method assesses the functional state and degree of injury to the gland. This study showed that the A (before stimulation test [counts/frame]) / B (after stimulation test [counts/frame]) value of submandibular glands with sialoliths (1.09±0.23) was lower than that of submandibular glands without sialoliths (1.99±0.57, P=.000). Wu et al.5 reported that uptake and excretion by the glands were substantially decreased in patients with sialolithiasis. In this study, 12 of 15 sialolith glands showed decreased uptake (80.0%). We conclude that sialoliths were a factor that affected salivary gland excretion in the submandibular gland.
The limitations of this study were as follows: the number of patients with submandibular sialolithiasis was small, and logistic multivariate regression analysis was not used to determine the relationship between CT values of the submandibular glands with and without sialoliths and salivary gland excretion measured using salivary gland scintigraphy. Furthermore, our study did not evaluate the relationship between patients' clinical symptoms and biopsy results (fatty degeneration), which would have also provided supplemental information about differences in CT values and biopsy results in relation to clinical symptoms. Therefore, further research is necessary to validate these results.
In conclusion, CT values and the salivary gland excretion fraction measured using scintigraphy in the submandibular glands seemed to be useful tools evaluating submandibular sialolithiasis.

 XML Download