

 PDF
PDF ePub
ePub Citation
 Print
Print


Introduction
Cephalograms have played an important role in diagnosis and treatment planning in orthodontics.123 Posteroanterior (PA) cephalograms have traditionally been used for the evaluation of facial asymmetry, and making a diagnosis using this imaging modality requires the accurate establishment of the facial midline and correct measurements of the distances and angles of landmarks.123 The menton (Me) is the landmark that is most commonly used to determine the severity of facial asymmetry.1234 Two methods of determining Me deviation on cephalograms have been introduced. One measures the perpendicular distance of the Me from the facial midline.2 The other measures the angle between the facial line and the anterior nasal spine (ANS)-Me line or the crista galli (Cg)-Me line.135
Cephalograms have limitations in analyzing three-dimensional (3D) human facial structure because they offer a two-dimensional (2D) depiction of the anatomy that inherently produces image distortion, magnification, and superimposition.56 Meanwhile, 3D computed tomography (CT) has no image superimposition, magnification, or distortion, providing accurate 3D measurements of linear and curvilinear distances and angles. Thus, 3D CT leads to high reproducibility and accuracy.6789 Image reconstruction software also provides 3D volumetric images, free angle viewing, and selective views of soft and hard tissues.510 Previous studies have shown 3D CT to be more effective than cephalograms in facial asymmetry analysis.51011 However, 3D CT involves a higher dose of radiation, and it cannot be used for regular, periodic examinations, whereas cephalograms use a lower dose and thus can be used regularly.
The severity of facial asymmetry determined on cephalograms has been used in 3D CT analyses of facial asymmetry to classify subjects as asymmetric and symmetric.51213141516 The severity of facial asymmetry is determined by the deviation of the Me from the facial midline. However, no research has been conducted on whether the severity of Me deviation and the severity of facial asymmetry measured on cephalograms are the same as those measured using 3D CT. This study aimed to compare the severity of Me deviation and direction in PA cephalograms and 3D CT.
Materials and Methods
Study subjects
This study included 35 orthodontic patients who underwent orthognathic surgery between 2000 and 2007. The average A point-nasion-B point angle (ANB) of the patients was - 3.63°±2.65°. Among them, 15 (seven males and females; average age, 22.3±3.3 years) had a normal range of Me deviation (0 mm≤Me<2 mm), and 20 (12 males and eight females; average age, 21.9±3.4 years) had moderate asymmetry (4 mm≤Me≤8 mm) on PA cephalograms. 2 The average ANB of these patients was - 3.63° ±2.65°.
Measurement of the deviation of the Me on PA cephalograms
Cephalograms were taken using a cephalometric radiograph machine (Cranex 3+, Soredex, Helsinki, Finland) with a focal spot-object distance of 150 cm, a focal spotfilm distance of 15 cm, a current of 7-8 mA, a voltage of 80 kVp, and an exposure time of 1.2-1.7 seconds. The midfacial line was drawn as a line perpendicular to the line connecting Lo-Lo' through Nc, where Lo and Lo' correspond to the bilateral intersection of the oblique orbital line with the lateral contour of the right and left side orbits, and Nc is the neck of the Cg. The distance of the Me from the midfacial line was determined as the deviation of the Me (x1) on a PA cephalogram film, using tracing paper and a view box (Fig. 1A).2
Measurement of the deviation of the Me on 3D CT
CT scans were obtained from a spiral CT scanner (Light Speed QX/I, GE Medical Systems, Milwaukee, WI, USA). The patient was placed on the table, positioning the head with the Frankfurt horizontal line perpendicular to the floor and positioning the middle of the dentition parallel to the long axis of the machine. The imaging parameters were set at 120 kV, 200 mA, a 512×512 matrix, and a gantry angle of zero. The axial image slice was 2.5 mm, the table speed was 3 mm/s, and the scanning time was 0.8 s. The field of view was 18 cm, covering the superior of the orbit and the entire mandible. Digital Imaging and Communication in Medicine (DICOM) images were created at a slice thickness of 1.0 mm. The acquired data from these images were transferred to a personal computer, and the CT data were used to construct 3D images with the software Vworks+Vsurgery (Cybermed, Seoul, Korea). The surface shaded display was obtained at a threshold value of 126. Landmarks were identified, confirming the location on the axial, sagittal, and coronal planes. On each CT scan, the midsagittal reference plane (MRP) was made with the following three landmarks: opisthion, Cg, and ANS.516 The horizontal reference plane (HRP) was made with right orbitale and left porion and was perpendicular to the midsagittal reference plane. The coronal reference plane was made perpendicular to the midsagittal and horizontal reference planes, passing through the opisthion.1718
The Me was identified by defining its axial, midsagittal, and coronal position on the multiplanar reformation mode, and the deviation of the Me (x2) was determined as the distance of the Me from the midsagittal reference plane (Figs. 1B and C).171819
The extent of Me deviation was considered to be normal when the distance of the Me from the MRP (x) was less than 2 mm (0 mm≤x<2 mm), mild when less than 4 mm (2 mm≤x<4 mm), moderate when less than 8 mm (4 mm≤x<8 mm), and severe at values of 8 mm or higher (8 mm≤x).2
Statistical analysis
The difference in the location of the Me determined by the two imaging modalities (|x1 - x2|=Δx) was statistically analyzed using the one-sample t-test. The agreement of the deviation of the Me between the imaging modalities was evaluated through Bland-Altman plot. The correlation between x1 and x2 was analyzed by Pearson's correlation coefficient. Cohen's kappa coefficient was obtained to determine whether the two imaging modalities agreed with each other in the determination of the severity of facial asymmetry and the direction of the deviation of the Me. Statistical analysis was performed using IBM SPSS (IBM Corp., Armonk, NY, USA).
Results
The deviation of the Me was measured on PA cephalograms and 3D CT, respectively, and the results were analyzed to identify statistically significant differences between these imaging modalities in the severity of Me deviation and direction of Me.
The severity of Me deviation
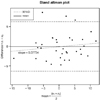
A statistically significant difference was found between x1 and x2 using the one-sample t-test (Δx=2.45±2.03 mm, p<0.05) (Table 1). A Bland-Altman plot showed that the differences (x1 - x2) were scattered around the mean (minimum mean= - 14.48 mm, maximum mean=11.82 mm). The slope of the regression line was 0.08, but no statistically significant difference from 0 was found (with a confidence of 95% with a width of 12.58 mm). Systematic errors were observed between the two imaging modalities, but those errors had no relationship with the deviation of the Me (Fig. 2). The Pearson correlation coefficient of the deviation of the Me (x1 and x2) of both imaging modalities was 0.86, which was statistically significant (p<0.05).
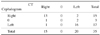
The kappa coefficient of the severity of Me deviation on both imaging modalities was 0.27, showing fair agreement. Sixteen patients (45.7%) showed a difference in the severity of facial asymmetry between the two imaging modalities. A two-stage difference was found in five patients (14.3%) (Table 2).
The direction of the Me
The kappa coefficient of the direction of the Me on both imaging modalities was 0.64, indicating substantial agreement. A discrepancy in the direction of the Me was detected in three patients (8.6%) (Table 3).
Discussion
Facial asymmetry is diagnosed when the maxillary or mandibular midline deviates from the craniofacial midline or when a bilateral difference in facial height or width is present.12345 The recently increased interest in esthetic faces has elicited an increase in the number of patients who desire to undergo orthognathic surgery, resulting in a higher utilization rate of 3D CT for diagnostic purposes.5111213141516 The Me is the landmark that is most related with the concept of facial asymmetry.1234
The measurement of Me deviation on PA cephalograms was introduced by Haraguchi et al.2 This measurement was applied to the analysis of 3D CT for the classification of patients as asymmetric or symmetric, where those with 0 mm≤Me<2 mm were classified as symmetric and those with a Me≥4 mm were classified as asymmetric.212131415 However, no research has determined whether the severity of Me deviation and the direction of the Me on PA cephalograms are the same as those obtained in 3D CT images. This study aimed to compare the severity of Me deviation and the direction of the Me on PA cephalograms and on 3D CT.
Previous research has reported that the deviation of maxillary and mandibular midfacial landmarks was inconsistent depending how the midsagittal reference plane was determined.1720 Many methods have been used to establish the MRP,5101112131416171820 but generally the methods can be classified into two groups. One group of methods first identifies the HRP with three landmarks and then establishes the MRP perpendicularly to the HRP, passing through a midfacial landmark.12131417 The other group of methods establishes the MRP with three midfacial landmarks, 51011161720 as was done in this study.
In the method in which the HRP is first identified and MRP is established perpendicularly to the HRP, the MRP is influenced by the HRP.12131417 Then, if the Cg is not used for the MRP, the MRP has no relationship with the method established by Haraguchi et al.,2 who used the Nc (the neck of the Cg) to establish the midfacial line; nevertheless, some studies have still applied the measurement of the Me by Haraguchi et al.2 to facial asymmetry analysis utilizing 3D CT.14 Likewise, the measurement of Me deviation has been uncontroversially used in the analysis of 3D CT as the standard for classifying patient groups.5121314151621
Comparing the measurements of the Me between PA cephalograms and 3D CT in 35 patients, the severity of the deviation of the Me was different to a statistically significant extent (Δx=2.45±2.03 mm, p<0.05), with 19 patients (54.3%) showing a difference in the severity of the deviation, and three patients (8.6%) showing a discrepancy in the direction of the deviation. Among 15 patients with a normal extent of Me deviation on cephalograms, six had mild deviation, one had moderate deviation, and one had severe deviation on 3D CT. Among 11 patients with moderate deviation on cephalograms, 3D CT demonstrated that two had a normal extent of deviation, three had mild deviation, and one had severe deviation. Among the nine patients with severe deviation on cephalograms, one had normal deviation and four had moderate deviation on 3D CT. Two patients with Me deviation to the right on their cephalogram showed deviation to the left on 3D CT, and one patient with Me deviation to the left on the cephalogram had deviation to the right on 3D CT (Tables 1,2,3). These differences between the imaging modalities were caused by several factors. Firstly, the landmarks Lo and Lo' that were used for the midfacial line on PA cephalograms are not actually present on the human skull. Lo is the intersection between the oblique orbital line and the lateral contour of the orbit. The oblique orbital line is the radiopaque image of the greater wing of the sphenoid bone, projected onto the orbit when a conventional cephalogram is taken.2223 The Nc is a point on PA cephalograms, but it is not a point on the 3D anatomy and it does not really exist. The midfacial line was drawn on the PA cephalograms using Lo, Lo', and the Nc as landmarks, all of which are anatomically absent on the human skull, making it impossible to identify Lo, Lo', and the Nc on 3D CT. Secondly, the distortion and magnification of 3D anatomic structures are an unavoidable and inherent problem of 2D conventional radiographs. The location of the Me could also be distorted on PA cephalograms, making its location different from that observed on 3D CT. Therefore, the midfacial line on PA cephalograms is different from the MRP on 3D CT.
The Me is an important landmark in determining the amount of facial asymmetry. The Me also determines the deviated and opposite side of the face for the analysis of bilateral differences.2351013141516171819 This study showed that applying the deviation of the Me measured on PA cephalograms to 3D CT may decrease the validity of facial asymmetry analysis. The direction of the deviation of the Me showed substantial agreement (k=0.64, p<0.05), but the discrepancy in the direction observed in three patients (8.6%) should not be neglected. The severity of facial asymmetry showed fair agreement (k=0.27, p<0.05), with a discrepancy in severity in 16 patients (45.7%) and a discrepancy of two stages in five patients (14.3%) (Tables 1 and 3). The severity of Me deviation and the direction of Me deviation were different between PA cephalograms and 3D CT in some patients. This study suggests that in a facial asymmetry analysis using 3D CT, the definition of facial asymmetry should be based on Me deviation on 3D CT, not on the cephalogram.


 XML Download