

 PDF
PDF ePub
ePub Citation
 Print
Print


Introduction
Although the need for digital dental radiography quality assurance (QA) testing is recognized, few studies have been performed on the methods and best practices for performing these tests. The Institute of Physics and Engineering in Medicine (IPEM) classified QA tests into two levels according to professional knowledge. The Level A test is relatively simple and quick, and does not require complicated testing equipment or analysis. A general dentist who receives proper training could perform the test, and the equipment should be readily available in dental clinics. Level B tests require a specialist. The IPEM further classifies QA tests according to priority. Priority 1 is the minimum standard, and, when satisfied, a clinic is considered to be in good condition. Priority 2 is the standard for clinics in the best condition.1
According to the QA guidelines of the IPEM for priority 2, the reproducibility, uniformity, beam alignment, and synchronization of exposure with tube motion in panoramic radiographs are to be evaluated every 1-3 months (Table 1).
Panoramic radiography is constructed using a complex combination of tomography and scenography, and is highly prone to errors due to factors involving the equipment. In addition, some images may have no diagnostic value due to the position of the jaw, posture of the patient, and the processing involved in data digitization.
Typically, quality control has three components: (1) safety and functionality, (2) geometry, and (3) image quality. Image quality assurance is based on the evaluation of the spatial resolution and contrast sensitivity of both clinical and phantom images.2 The quality of a phantom image is assessed by evaluating equipment functionality using standardized phantoms. It is difficult to conduct quality controls due to a lack of standards for evaluating phantom images in panoramic radiographs. The Quartz phantom was developed to comply with International Electrochemical Commission (IEC) requirements3 suggesting a minimum requirement of 2.5 line pairs per millimeter in resolution and more than 3 holes in spatial contrast for panoramic radiograph QA. Limitations in the quality of the image from the panoramic radiograph equipment may also occur because the phantoms used in the evaluation are designed to be positioned in only one region. Recently, reference line-pair values for panoramic radiographs using an arch-form phantom stand have been developed.4 With the current trend toward the use of digital imaging, panoramic radiographic examination has become common for diagnosing dental caries and other periodontal diseases. Therefore, the evaluation and maintenance of contrast sensitivity are also important, although research regarding contrast sensitivity is sparse.
This study aimed to construct a phantom to allow the verification of contrast sensitivity in the incisor region, premolar region, molar region, and temporomandibular joint (TMJ) region. We also identified reference values of contrast sensitivity using phantom image evaluations, to determine the quality necessary for an interpretable clinical image.
Materials and Methods
Fabrication of a contrast phantom for image quality evaluation of panoramic radiography
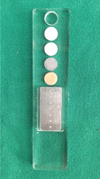
Our phantom was composed of two different parts: the top portion was for measuring the contrast-to-noise ratio (CNR) and the bottom portion was for contrast sensitivity.
First, the portion of the phantom for measuring the CNR was prepared. A rectangular polymethylmethacrylate (PMMA) plate (100×20×5 mm) was used as the background substance. Five round blocks (6 mm in diameter) were embedded at a depth of 5 mm on the plate. Each block was made with different test materials, consisting of porcelain as an enamel-equivalent material, aluminum as a cortical bone-equivalent material, polytetrafluoroethylene (PTFE) as a trabecular bone-equivalent material, polyoxymethylene (POM) as a soft tissue-equivalent material, and PMMA as a water-equivalent material (Fig. 1).567
A 5-mm thick aluminum plate with 7 pits was also prepared. The 7 round-shaped pits were all 1 mm in diameter, with depths of 0.1, 0.2, 0.3, 0.4, 0.5, 0.6, and 0.7 mm from the top to the bottom of the plate (Fig. 1).
Phantom stands
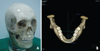
The stands for the phantom were fabricated according to the method of Choi et al.4 The stand was constructed based on the shape and size of the dental arch of a real skull phantom with a transparent soft tissue replica (X-ray phantom head product number 7280; Erler Zimmer Co., Lauf, Germany). The size of the skull phantom was measured with computed tomography (CT) images. The skull phantom was scanned with a Somatom Sensation 10 multidetector CT (Siemens AG, Erlangen, Germany). The images obtained, including 3-dimensional (3-D) reconstructed images, were analyzed using 3-D modeling software (V-works, Cybermed, Seoul, Korea) (Fig. 2).
The central arch curve was created according to the 3-D reconstructed image of the real skull phantom mandible. Based on this central arch curve, the stand was produced with a width of 3.0 cm. The slits for holding the phantom were made on the central arch curve at 4 sites, each of which represented the incisor, right premolar, left molar, or right TMJ region, so that contrast values could be measured at each region separately (Fig. 3A).4
Image acquisition and processing
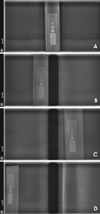
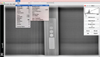
The panoramic images for the phantom were obtained with exposure conditions of 13.5 s, 70 kVp, and 8.0 mA, using a Pax-i3D Green apparatus (Vatech, Hwaseong, Korea) (Fig. 3B). The contrast phantom was placed at each site of the phantom stand and 4 raw images were obtained (Fig. 4). Each obtained image was modified into 18 different images with proportionally different contrast using Aperture (Apple Inc., San Francisco, CA, USA) (Fig. 5). They were then converted into an image file without loss. In each group, the incisor, premolar, molar, and TMJ images were assigned an image number (IN) from 1 to 18. A total of 72 post-processed phantom images were acquired.
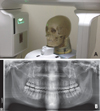
The raw data of the clinical image were obtained from a real skull phantom using the same panoramic radiographic machine and the same exposure conditions as the phantom (Fig. 6). The image was also modified into 18 different images (IN 1 to 18) using the same post-processing parameters as the phantom image.
Image evaluation
Two oral and maxillofacial radiologic specialists evaluated the images. On the phantom image, contrast sensitivity was evaluated as the counted numbers of visible pits on the bottom part of the aluminum plate. The CNR was evaluated as follows. The average signal intensity of 5 objective materials in the top part of the phantom was measured using ImageJ (National Institutes of Health, Bethesda, MD, USA). The region of interest was a 60×60-pixel circular area on each tissue-equivalent material. Standard deviation values were also obtained for each material. The CNR was calculated according to Equation 1.8
Equation for contrast to noise ratio (CNR). µ, average; σ, standard deviation; target, tissue-equivalent materials; bg, background (water-equivalent material).
Analysis
The clinical image quality used to determine the cutoff contrast reference value (CRV) of the phantom was the quality corresponding to being adequate for diagnosis. The CNR and the number of visible pits were used for the CRV calculations.
Correlations between the CNR of each tissue-equivalent material and the number of visible aluminum pits were obtained according to the region of the dental arch using the Pearson correlation coefficient. One-way analysis of variance was applied to compare the CNR of the tissue-equivalent materials, and the Scheffe post hoc test was performed to assess differences in contrast between the tissue-equivalent materials. All statistical analyses were performed using IBM SPSS Statistics version 21 (IBM Corp., Armonk, NY, USA).
Results
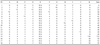
Zero to 7 visible pits were found in the phantom image in the incisor and molar region, and 0 to 6 in the premolar and TMJ region (Table 3). The CNR of all 4 materials of the dental arch region showed a positive correlation with the number of visible pits, except POM in the TMJ region (Table 4). The CNR of aluminum in the incisor region showed the strongest relationship, while PTFE in the TMJ region showed the weakest relationship with the visible number of pits. The TMJ region showed a relatively weak relationship between the CNR of substances and the number of visible pits.
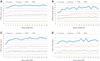
The clinical image evaluation score ranged from 0 to 52 (Table 5), with images 15 through 18 receiving scores of 52. The clinical evaluation showed a varied number of visible pits and CNR values in different regions of the dental arch (Fig. 7). Images 6 through 14 had an overall image quality grade that was adequate for diagnosis (score 8) in the clinical image evaluation chart. The minimum number of visible pits in images 6 through 14 was as 4, 4, 5, and 2, respectively, for the incisor, premolar, molar, and TMJ regions. The maximum number was 6 for all regions. The CNR value of all tissue-equivalent materials showed a tendency to decrease from the anterior (incisor and premolar) to the posterior (molar and TMJ) region. For images that achieved a higher score than 8 on item K, the minimum CNR values were 13.95, 9.68, 6.71, and 1.79, respectively, for porcelain, aluminum, PTFE, and POM in the incisor region. In the premolar region, the minimum CNR values were 14.22, 8.82, 5.95, and 2.30, respectively, for porcelain, aluminum, PTFE, and POM. In the molar region, the minimum CNR values were 7.40, 3.68, 1.27, and - 0.18 for porcelain, aluminum, PTFE, and POM, respectively. In the TMJ region, the minimum CNR values were 3.60, 2.04, 0.48, and - 0.43 for porcelain, aluminum, PTFE, and POM, respectively.
Discussion
The use of quality-controlled equipment with a standardized phantom is essential for proper image quality maintenance. Although phantoms for panoramic radiographic machines have been reported by regulatory institutions such as the IEC, DIN, and IPEM, they have limitations (e.g., only the anterior region can be evaluated).
This study evaluated contrast resolution in the anterior and the posterior area of the maxillofacial region. The phantom stand, which can hold a phantom at the incisor, molar, premolar, and TMJ regions when taking panoramic radiography, was fabricated according to the human skull. The contrast phantom was designed to comprise 2 parts: a contrast sensitivity region and a region allowing the evaluation of the CNR of 5 tissue-equivalent materials.
The objective evaluations of the contrast in each region with this phantom were correlated with subjective clinical image evaluations. Different panoramic radiographic images were post-processed with various contrast factors, and the images determined to be bad but diagnosable (6 points on item K) showed a maximum of 3, 2, 5, and 3 visible pits in the incisor, premolar, molar, and TMJ regions, respectively. The number of observable pits showed a tendency to increase when the clinical image achieved a better score. The image that received a score of being adequate for diagnosis (8 points on item K) showed a minimum of 4, 4, 5, and 2 visible pits in the aluminum plate in the incisor, premolar, molar and TMJ regions, respectively. The image that was scored as optimal for obtaining diagnostic information (10 points on item K) showed a minimum of 6, 5, 6, and 5 visible pits in the incisor, premolar, molar and TMJ regions, respectively. Thus, the number of visible pits of this phantom was closely related to the clinical image quality, which is simultaneously a more standardized means of contrast evaluation.
If the CNR value is high, we can infer that the contrast is good, and if the difference between CNR values is large, we can also infer that the contrast with the corresponding substance is good. CNR values in the incisor and premolar regions show differences between tissue-equivalent blocks. The contrast of these blocks for the molar and temporomandibular joint regions was similar, because it is difficult to distinguish between certain tissue-equivalent blocks, such as soft tissue, and water.
In the present study, the relationship between the number of visible pits and the CNR was strong in the incisor region for porcelain, aluminum, and PTFE; in the premolar region for porcelain, aluminum, PTFE, and POM; and in the molar region for porcelain and aluminum. For substances in these regions, the CNR may possibly be used instead of counting the number of pits of the phantom. However, in the TMJ region, the CNR value and the number of observable pits, as well as the correlation between them, were lower than in other regions. Both parts of the phantom should be used in the TMJ region for precise contrast evaluation. Thus, to ensure a CRV with diagnosable image quality for the incisor region, standard CNR values of 13.95, 9.68, and 6.71 can be used for porcelain, aluminum, and PTFE, while for POM, both a CNR value of 1.79 and the presence of 5 visible pits should verified. In the premolar region, CNR values of 14.22, 8.82, 5.95, and 2.30 for porcelain, aluminum, PTFE, and POM, respectively, should be used to as cut-off values for CRV. In the molar region, CNR values of 7.40 and 3.68 are satisfactory for porcelain and aluminum, while 5 visible pits and CNR values of 1.27 and - 0.18, respectively, should be present for PTFE and POM. In the TMJ region, a phantom image with at least 2 visible pits and CNR values of 3.60, 2.04, 0.48, and - 0.43 for porcelain, aluminum, PTFE, and POM, respectively, are satisfactory to ensure an image that is adequate for diagnosis.
Regarding the post-processed contrast, the number of visible pits increased as the contrast level increased in the image. However, the score of the clinical image quality was correlated with the contrast level to a limited extent; high contrast does not necessarily imply a good-quality image. The current study suggested a method of contrast resolution assessment in dentomaxillofacial regions that are often imaged in panoramic radiography. The presence of a correlation between the clinical image quality evaluation and the contrast phantom evaluation led to the suggestion of standard numbers of visible pits and CNR values for this phantom in order to ensure an adequately diagnosable image.


 XML Download