

 PDF
PDF ePub
ePub Citation
 Print
Print


Introduction
Many treatment plans for patients with Class I or Class II skeletal patterns involve moving the anterior teeth distally, for which mini-implant placement can be used as a skeletal anchorage. Since the interradicular distance and buccal cortical bone thickness are crucial for the success of mini-implant placement for orthodontic anchorage,12 awareness of the distance between and thickness of each anatomical area of interest provides useful guidance to clinicians choosing where to place mini-implants.
Chaimanee et al.3 examined the influence of different dentoskeletal patterns on the availability of interradicular space and determined the safe zones for miniscrew implant placement using periapical radiographs of 60 subjects with Class I, II, or III skeletal patterns. For all skeletal patterns, in the maxilla, the greatest interradicular space was found between the second premolar and the first molar. In the mandible, the greatest interradicular space was between the first and second molars, followed by between the first and second premolars. It was concluded that teeth with a greater inclination had less interradicular space, whereas more upright teeth offered more interradicular space.
Recently, maxillofacial imaging in dentistry was revolutionized by the introduction of cone-beam computed tomography (CBCT) in 2001.4 CBCT has facilitated a transition from two-dimensional to three-dimensional images in dental diagnosis and expanded the role of imaging from diagnosis to image guidance for operative and surgical procedures by way of software applications.56
In 2006, Poggio et al.7 determined safe zones for miniscrew implant placement from volumetric tomographic images of 25 maxillae and 25 mandibles. They reported that in the maxillary palatal region, the greatest mesiodistal distance was between the second premolar and the first molar, 5.0 mm from the alveolar crest. Similar studies by Park and Cho8 in 2009 and Fayed et al.9 in 2010 reported the same result regarding the maxillary mesiodistal distance. In the mandible, the greatest mesiodistal distance was between the first and second premolar, as reported by Poggio et al.7 and Fayed et al.9 However, the greatest mandibular mesiodistal distances were between the first and second molar according to Park and Cho.8 Many studies have found the greatest buccolingual dimension of both jaws to be between the first and second molars.8910
The greatest buccal cortical thickness in the maxilla was found either between the first and second molars811 or between the first and second premolars.912 Baumgaertel and Hans11 studied 30 dry skulls using CBCT, and found that the buccal cortical bone thickness was greater in the mandible than in the maxilla. Fayed et al.9 studied CBCT images of 100 patients (46 males, 54 females). In the maxilla, the greatest buccal cortical thickness was found between the first and second premolars.9 In the mandible, the greatest buccal cortical thickness was found between the first and second molars.891011
As discrepancies are present in the results of previous studies related to interradicular distances, and no studies have used CBCT to evaluate these dimensions in Thai patients, knowledge of these measurements in Thai patients would be useful in planning the placement of miniscrew anchorage in orthodontic treatment. Therefore, the aim of this study was use CBCT to evaluate and compare interradicular distances and cortical bone thickness in Thai patients with Class I and Class II skeletal patterns.
Materials and Methods
This study was approved by the Human Experimentation Committee, Faculty of Dentistry, Chiang Mai University, Thailand. Before CBCT images were obtained, the patients were informed of the study procedure, and informed consent was then obtained from all patients.
Pretreatment CBCT images of 24 Thai orthodontic patients, comprising 12 patients with a Class I skeletal pattern and 12 with a Class II skeletal pattern, were included in the study. All CBCT images were obtained using a ProMax 3D (Planmeca OY, Helsinki, Finland) CBCT machine, at 84 kVp, 10 mA, an 8 cm×8 cm field of view, and a voxel size of 0.16 mm, in the Division of Oral and Maxillofacial Radiology, Department of Oral Biology and Diagnostic Sciences, Faculty of Dentistry, Chiang Mai University. Each patient was positioned with the occlusal plane parallel to the floor.
The patients included in this study met the following criteria: (1) age of 13-29 years, (2) full eruption of permanent dentition (except for the third molars), (3) no history of previous orthodontic treatment, (4) no missing teeth (excluding the third molars), (5) no severe craniofacial disorders, (6) no severe periodontitis or periapical lesions, (7) no large metal restorations, (8) no severe crowding or spacing in posterior teeth, and (9) a Class I skeletal pattern (A point-nasion-B point [ANB] angle=2°±2°) or a Class II skeletal pattern (ANB angle>4°).
Measurements
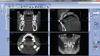
Planmeca Romexis Viewer 2.3.1.R (Planmeca OY, Helsinki, Finland) was used for orthogonal tomographic image construction and measurements (Fig. 1).
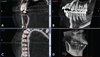
All images were oriented using a standardized protocol. When examining axial images, the CBCT image was oriented so that the green line provided by the software was perpendicular to the buccal bone surface and bisected the interradicular area to be measured. For the sagittal images, the CBCT image was oriented so that the occlusal plane was parallel to the blue line. The cursor was adjusted until the red line in the axial image was centered on each contact area, at approximately the midroot level (Fig. 2).
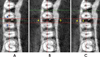
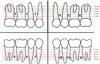
For each interradicular area in the maxilla and the mandible, from the distal aspect of the first premolar to the mesial aspect of the second molar, the following measurements were recorded (Fig. 3): the mesiodistal distance, the width of the buccolingual alveolar process, and the buccal cortical bone thickness. These measurements were repeated at five different heights from the cementoenamel junction (CEJ) to the apex: 2, 4, 6, 8, and 10 mm (Fig. 4).
The measurements were made as follows. Mesiodistal distance (x-y) was defined as the distance between parallel lines tangent to the adjacent proximal root surfaces in axial images (Fig. 3A). The width of the buccolingual alveolar process (a-b) was measured at the center of the interradicular width between the tangent lines to the proximal root surfaces, from the outermost point on the buccal side to the outermost point on the palatal/lingual side (Fig. 3B). Buccal cortical bone thickness (a-c) was defined as the distance between the external and internal aspects of the buccal cortex midway between the lines tangent to the proximal root surfaces (Fig. 3C).
For each patient, 180 measurements were recorded by one investigator. The CBCT images of five patients were randomly selected and re-measured by the same examiner after a four-week interval to test intraobserver reliability.
The data were analyzed using SPSS version 16.0 for Windows (SPSS Inc., Chicago, IL, USA). The significance level for all tests was set at p<0.05. The paired t-test was used to determine intraobserver reliability, and no significant differences were found between the repeated measurements. The unpaired t-test was used to analyze differences between measurements on the right and the left sides. No significant differences were found, so the measurements were pooled to facilitate the determination of central trend measurements. The independent t-test was used to compare the differences between the measurements from patients with Class I and Class II skeletal patterns. Descriptive analysis was used to obtain the means and standard deviations of all measurements.
Results
The measurements of and the differences in the mesiodistal distance at different heights from the CEJ in the maxilla and mandible in patients with Class I and Class II skeletal patterns are presented in Table 1. The greatest mean value for the maxillary mesiodistal distance in Class I skeletal pattern patients was between the second premolar and the first molar at the height of 10 mm (4.0±1.3 mm). For Class II patients, the greatest mean value of the maxillary mesiodistal distance was between the second premolar and the first molar at the height of 10 mm (3.8±1.5 mm). In the mandible, the greatest mean value for the mesiodistal distance in Class I patients was between the first and second molars at the height of 10 mm (5.0±1.5 mm). In Class II patients, the greatest mean value for the mesiodistal distance was between the first and second premolars at the height of 10 mm (5.0±1.2 mm). The maxillary mesiodistal distances between the first and second premolars at the height of 10 mm and between the first and second molars at the heights of 6 mm and 8 mm in Class II patients were significantly greater than in patients with Class I skeletal patterns. No significant differences were found in the mandibular mesiodistal distance between patients with Class I and Class II skeletal patterns.
The measurements of and the differences in the width of the buccolingual alveolar process at different heights from the CEJ in the maxilla and mandible of patients with Class I and Class II skeletal patterns are presented in Table 2. The greatest mean value for the maxillary buccolingual alveolar process width in patients with a Class I skeletal pattern was between the first and second molars at the height of 10 mm (15.6±1.1 mm). For Class II patients, the greatest mean value for the maxillary buccolingual alveolar process width was between the first and second molars at the height of 10 mm (16.7±1.9 mm). The widths of the maxillary buccolingual alveolar process between the first and second premolars at the heights of 2 mm and 4 mm and between the second premolar and the first molar at the height of 2 mm in Class I patients were significantly greater than in patients with Class II skeletal patterns. However, at the height of 10 mm between the first and second molars, the maxillary buccolingual alveolar process width in Class II patients was significantly greater than in Class I patients.
The greatest mean value for the width of the mandibular buccolingual alveolar process in patients with a Class I skeletal pattern was between the first and second molars at the height of 10 mm (15.6±2.4 mm). In Class II patients, the greatest mean value for the width of the mandibular buccolingual alveolar process was found between the first and second molars at the height of 10 mm (14.9±1.7 mm). The widths of the mandibular buccolingual alveolar process between the first and second molars at the heights of 4 mm, 6 mm, and 8 mm in Class I patients were significantly greater than in patients with Class II skeletal patterns.
Table 3 shows the absolute and comparative measurements of buccal cortical bone thickness at different heights from the CEJ in the maxilla and mandible of patients with Class I and Class II skeletal patterns. The greatest mean value for the maxillary buccal cortical bone thickness in Class I patients was between the first and second molar at the height of 10 mm (1.4±0.5 mm). In Class II patients, the greatest mean value for buccal cortical bone thickness was found between the first and second premolars at the height of 10 mm (1.4±0.3 mm). The maxillary buccal cortical bone thicknesses between the first and second premolars and between the second premolar and the first molar at the height of 2 mm in Class I patients were significantly greater than in patients with Class II skeletal patterns. However, the maxillary buccal cortical bone thickness was significantly greater in Class II patients than in Class I patients at the height of 8 mm between the second premolar and the first molar. The greatest mean value for the mandibular buccal cortical bone thickness in patients with a Class I skeletal pattern was found between the first and second molars at the height of 8 mm (3.2±0.7 mm). The greatest mean value for the mandibular buccal cortical bone thickness in Class II patients was between the first and second molar at the height of 10 mm height (3.1± 0.4 mm). However, no statistically significant differences were found in the thickness of the mandibular buccal cortical bone.
Discussion
Previous studies7891011121314 have not taken different dentoskeletal patterns into account when assessing measurements, except for Chaimanee et al.,3 who assessed the interradicular space in patients with different dentoskeletal patterns using periapical radiographs (Table 4). We found that the greatest mesiodistal distances in the maxilla were between the second premolar and the first molar in both Class I and Class II skeletal patterns. Similar results have been reported by Schnelle et al.,13 Chaimanee et al.,3 Hu et al.,14 Park and Cho,8 Fayed et al.,9 and Sawada et al.12 However, different results were reported by Poggio et al.,7 who found that the greatest mesiodistal distances in the maxilla were between the first and second premolars on the buccal side and between the second premolar and the first molar on the palatal side. These discrepancies are most likely due to differences in the methods of measurement in those studies.
This study found that the greatest mandibular mesiodistal distances were between the first and second molars in patients with a Class I skeletal pattern and between the first and second premolars in patients with a Class II skeletal pattern. As shown in Table 4, these results confirm those of Schnelle et al.,13 Hu et al.,14 Monnerat et al.,10 Park and Cho,8 and Chaimanee et al.,3 for Class I patients, and those of Poggio et al.7 and Fayed et al.9 (lingual measurements) for Class II patients
In both the maxilla and mandible, the mesiodistal distances tended to increase from the CEJ to the apex in both Class I and Class II skeletal patterns. These results were in agreement with those obtained by Chaimanee et al.,3 Hu et al.,14 Monnerat et al.,10 Park and Cho,8 and Sawada et al.12 To prevent damage to the dental root, Poggio et al.7 recommended a minimum clearance of 1.0 mm of alveolar bone around the miniscrew implant in order to preserve periodontal health. Therefore, they recommended mesiodistal distances greater than 3.1 mm as safe for miniscrew implants with a maximum diameter of 1.2-1.3 mm. Miniscrew implants with a 1.5-mm diameter required at least 3.5 mm of space. We found that the mean values of the mesiodistal distances were more than 3.5 mm in the maxilla in both Class I and Class II skeletal patterns at 10 mm above the CEJ between the second premolar and the first molar. Based on our results, we recommend that 10 mm or more above the CEJ between the second premolar and first molar should be a safe zone for miniscrew placement in both Class I and II patients. However, in the mandible, the mean values of the mesiodistal distances in every interradicular area at 10 mm below the CEJ were greater than 3.5 mm. Therefore, the safe zone for miniscrew placement in the mandible is 10 mm below the CEJ for any interradicular space of the posterior teeth. No significant differences were found in the mean values of the mesiodistal distances between patients with Class I and Class II skeletal patterns in either jaw.
The present study showed that the widest buccolingual alveolar processes in the maxilla and mandible were between the first and second molars in both Class I and Class II skeletal patterns. This finding is consistent with those of previous studies,789101214 as shown in Table 5. The mean value of the maxillary buccolingual alveolar process width between the first and second molar at 10 mm above the CEJ in Class II patients was found to be significantly greater than in Class I patients. The width of the buccolingual alveolar process can provide useful guidance to clinicians in choosing the appropriate miniscrew implant length and placement angulation.1014
Our study found that the width of the buccolingual alveolar process in the maxilla and mandible tended to increase from the anterior to posterior regions and from the CEJ to the apex in both Class I and Class II skeletal patterns. These results confirm those of previous studies.89101214 The increase in the buccolingual width can be anatomically explained by the greater width of the buccolingual alveolar process of the roots of the teeth from the anterior to the posterior regions in both arches.2
This study showed that the greatest buccal cortical bone thicknesses in the maxilla were between the first and second molars in patients with a Class I skeletal pattern and between the first and second premolars in Class II patients. These results for patients with a Class I skeletal pattern confirm the findings of the previous studies by Park and Cho,8 Baumgaertel and Hans,11 and Hu et al.14 For patients with a Class II skeletal pattern, our results were consistent with those of Fayed et al.9 and Sawada et al.,12 as shown in Table 6. However, the values of buccal cortical bone thickness in the maxilla between the second premolar and the first molar at 8 mm above the CEJ in Class II patients were significantly greater than in Class I patients.
In the mandible, the greatest values of buccal cortical bone thickness were between the first and second molars in both Class I and Class II skeletal patterns. Similar results have previously been reported.89101114 No significant differences were found in buccal cortical bone thickness between Class I and II skeletal patterns at any level below the CEJ in the mandible.
The stability of miniscrew implants is related to the thickness of the buccal cortical bone. In order to achieve successful implantation, Motoyoshi15 suggested that the prepared site should be established in an area with a cortical bone thickness of more than 1.0 mm. Our study found that in the maxilla, the mean values of the buccal cortical thickness at 6.0 mm above the CEJ and beyond were greater than 1.0 mm in both Class I and Class II skeletal patterns. For the mandible, the mean values of the buccal cortical thickness were more than 1.0 mm at levels from 4 mm to 10 mm below the CEJ. Therefore, from our study, values of cortical bone thickness suitable for the stability of miniscrew implant placement were found at 6-10 mm above the CEJ in the maxilla and 4-10 mm below the CEJ in the mandible.
This study used three-dimensional CBCT images. This was the first study of this kind involving Thai patients. Our results will be beneficial to clinicians when considering mini-implants as anchorage. In particular, our findings regarding the area in the mandible with the greatest interradicular space will be useful, because it differed between patients with Class I and Class II skeletal patterns. This finding is distinct from that of a previous study in Thai patients using periapical radiographs.3 We found that the greatest buccal cortical thickness in the maxilla was also different between patients with Class I and Class II skeletal patterns. Although some of our findings were inconsistent with those of some previous studies, not all of those studies subcategorized their samples according to their skeletal classification of each patient.
The advantages of CBCT are greater accuracy and reliability than can be achieved with conventional two-dimensional radiographs, such as periapical radiographs and lateral cephalograms. However, the effective dose of radiation of CBCT is several times higher than that of two-dimensional conventional radiographs. Nevertheless, it is recommended if two-dimensional conventional radiographs cannot supply satisfactory diagnostic information, and its use has been confirmed to enhance diagnosis and treatment planning to an extent that its benefits can exceed the risks incurred by the radiation dose.34516 Many CBCT machines offer the ability of adjusting the field of view to fit the task at hand and to limit the dose of radiation administered to the patients. It is advisable to collimate the field of view of CBCT to cover only the area of interest. A limitation of this study was its small sample size, and it may be preferable to increase the sample size in a future study.
In summary, we found that the mesiodistal distances, the width of the buccolingual alveolar process, and buccal cortical bone thickness in both the maxilla and mandible tended to increase from the CEJ to the apex in both Class I and Class II skeletal patterns. The buccal cortical bone thickness in the mandible tended to increase from the anterior to posterior regions in both Class I and Class II skeletal patterns, and was greater than in the maxilla in every interradicular area at all levels.


 XML Download