

 PDF
PDF ePub
ePub Citation
 Print
Print


Introduction
Panoramic radiography has been widely used in a variety of cases including the screening of roots of teeth, cysts, foreign bodies, and neoplasms.1,2,3 It is also helpful to find bone resorption and osteopenia of the jaws.4,5,6 Furthermore, it is indispensible in installing implants.7 The use of panoramic radiography has been increasing in Korea, but a methodical monitoring system for quality control of the radiographs has not been established as yet.8 While obtaining the panoramic radiograph, the object should be positioned in the focal trough without any movement. In addition, the narrow image layer in the anterior area can induce errors on the resulting image.9,10 Therefore, accurate and stable patient positioning is essential for favorable image quality.
Along with image quality, the reproducibility control of a panoramic radiograph is important. Acceptable reproducibility of the radiograph provides adequate evaluation of a disease and post-operative follow-ups. Without proper reproducibility, there would be lack of information and precision, and the accuracy of the panoramic radiograph could not be guaranteed.
Anterior edentulous patients have conventionally taken panoramic radiographs by using a chin-support device. The panoramic radiographs of the anterior edentulous patients might show worse reproducibility and image quality than those of the dentulous patients using a conventional standard bite block since the chin-support device might provide less stability in positioning patients. To evaluate the panoramic radiographs of the anterior edentulous patients and compare them with the panoramic radiographs of dentulous patients, reproducibility can be assessed with measurements on the radiographs.
The distortion and the measurement stability on panoramic radiographs were evaluated by Tjonje et al11 Further, the vertical measurement might be used for clinical purposes,12 and the angular measurements on panoramic radiographs were satisfactorily accurate for most clinical purposes.13 Ćatić et al also proposed that a linear measurement on the panoramic radiographs was possible.14 Therefore, linear and angular measurements can be performed on the panoramic radiographs, and these measurements can be used for the reproducibility evaluation.
The reproducibility of panoramic radiographs can be evaluated more conveniently and accurately by measuring horizontal linear dimension changes on the reproduced panoramic radiographs. In a study by Larheim et al, the vertical length variation in the repeated measurement ranged from 2.4% to 3.1% on the panoramic radiographs,15 and the measurement of the vertical length was more reliable than that of the horizontal length.16 In addition, the magnification factors of the vertical directions were less varied than those of the horizontal directions,17 and the variability of the horizontal magnification factors was high.16,18 These originated from the changes in the position16 and a motion factor,16,19,20 which was related to the horizontal rotational movement of a panoramic radiograph machine. In other words, when changing the antero-posterior position of the patients, the magnification or reduction in the size of the horizontal component would be more prominent than that of the vertical component on panoramic radiographs because of the motion factor of panoramic machines.16,19,20 Thus, measuring horizontal length changes would be appropriate to evaluate the reproducibility of panoramic radiographs.
The aim of this study was determine whether bite positioning or chin-support positioning is more effective for taking panoramic radiographs. To this end, the reproducibility of panoramic radiographs using the conventional standard bite block and the chin-support device was evaluated and compared.
Materials and Methods
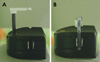
In order to evaluate the reproducibility of panoramic radiographs, images of 30 anterior dentulous patients (dentulous group) and 30 edentulous patients (edentulous group) were selected. All of them had 3 or more panoramic radiographs; the dentulous patients underwent the radiographs using a conventional standard bite block (Fig. 1A), and the edentulous patients by using a conventional chin-support device (Fig. 1B) in Seoul National University Dental Hospital. Thereafter, 3 panoramic radiographs were collected from each of the selected 60 patients. In total, 180 panoramic radiographs were collected, and each group consisted of 90 panoramic radiographs.
All the panoramic radiographs had been taken by well-trained radiographers using Orthopantomograph® OP100 (Imaging Instrumentarium, Tuusula, Finland), which encompasses the overall dental arches and provides proper spatial resolution.21 Therefore, all the observed areas of the collected panoramic radiographs were assumed to be in the focal trough. Approval for gathering panoramic radiographs was granted by the Institutional Review Board (IRB) of the Seoul National University Dental Hospital, Korea.
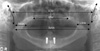
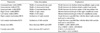
In order to evaluate the reproducibility, landmarks were defined, and the widths and angles of the landmarks were measured on a separate occasion by one observer, who was an oral and maxillofacial radiologist, by using a function of the PACS (PiViewStar, ver5.0.9.81, Infinitt Healthcare, Seoul, Korea) software. The measurement was repeated after 1 month. The widths and angles measured in this study are shown in Figure 2 and Table 1. All the measured linear dimensions were horizontal lines.
The widths and inclinations from the 180 radiographs were measured. Each patient had the 3 sets of measured values from his/her 3 radiographic images. The differences between the values for each patient were used to evaluate the reproducibility. The 3 datasets of the 30 patients in each group were used to calculate the intraclass correlation coefficient (ICC) that measures reliability, and the 3 datasets of each patient were used to calculate the coefficient of variation (cv) that can be used for estimating the precision.
The coefficient of variation, which is a normalized measure of dispersion of a probability distribution or frequency distribution, should be used for comparison between datasets with different units or widely different means, and could be used to estimate the precision. The dispersion of the measured datasets examined by the coefficient of variation could be explained by random errors that were closely related to the precision. A lower coefficient of variation indicates narrower dispersion and better precision, while higher ICC indicates better reliability.
The mean of the coefficient of variation, which was calculated in a manner similar to the calculation of the interassay coefficient of variation and the intra-assay coefficient of variation, was the average value of the coefficients of variation in each width and inclination of the 30 patients in each group. Also, a test of significance was performed with the coefficient of variation sets between the measured widths and between the groups.
First, for an intra-group assessment, the ICCs were used to evaluate the reliability of each area of the panoramic radiograph image in each of the groups, and the mean coefficients of variation were used to determine which area of the panoramic radiograph image had a narrower dispersion and better precision in each of the groups. Second, for the inter-group assessment, the ICCs and the mean coefficients of variation were used to compare the reliability and the precision between the groups. Reproducibility was evaluated with the reliability and the precision.
ICCs for measuring the reliability of panoramic radiographs and the intra-observer reliability were calculated with a two-way mixed model, absolute agreement type, corresponding 95% confidence interval, and single measure values.22 In accordance with Landis and Koch,23 the following ICC interpretation scale was used: poor to fair (below 0.4), moderate (0.41-0.60), substantial (0.61-0.80), and excellent (0.81-1). Also, the statistically significant differences in the mean coefficients of variation of the measured widths between the anatomic areas were measured using the Kruskal-Wallis test, and the post-hoc test for multiple comparisons of the areas was performed using the Games-Howell test. Because of unequal variances between the compared areas, the Kruskal-Wallis test and the Games-Howell test were selected. A Student's t-test was carried out to determine whether there were statistically significant differences in the mean coefficients of variation of each anatomic area between two groups. A p value of <0.05 was considered to be statistically significant. All the statistical analyses were performed using SPSS (IBM SPSS Statistics, version 21, IBM, Armonk, NY, USA).
Results
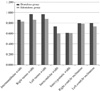
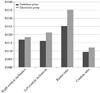
In the dentulous group, the ramus showed the highest ICCs. Intermandibular width (IMW) (Table 1) showed the second highest values, followed by the Left condyle inclination (LCI) (Table 1). Among all the measured values, Right ramus width (RRW) (Table 1), Left ramus width (LRW) (Table 1), IMW, and LCI were in the range of the excellent score of ICC (>0.8). The ICC of Interzygomatic width (IZW) (Table 1) was the lowest, while Intercondylar width (ICW) (Table 1) and then Right condyle inclination (RCI) (Table 1) were the next lower values. RCI, ICW, and IZW showed the ICCs in the substantial range (>0.6, <0.8) (Fig. 3).
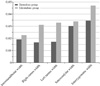
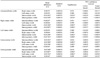
With the data of the 30 dentulous patients, the mean coefficients of variation were calculated for each item listed in Table 1 (Fig. 4). In the dentulous group, RRW and LRW showed the lowest and the second lowest mean coefficients of variation, followed by IMW. In contrast, the mean coefficient of variation of IZW was the highest and that of ICW followed. None of the inclination measurements were analyzed for this intra-group comparison. The coefficient of variation sets of each horizontal width in the dentulous group showed statistically different variances from one another as determined by the Levene Statistic (p=0.002). There was at least one statistically significant difference between the mean coefficients of variation of the horizontal widths in the dentulous group as determined by the Kruskal-Wallis test (p=0.000). A Games-Howell post-hoc test revealed that the mean coefficients of variation of IMW, RRW, and LRW were statistically significantly lower than the mean coefficients of variation of ICW and IZW (Table 2) in the dentulous group.
In the edentulous group, the ramus showed the highest ICCs. IMW showed the second highest value. Among all the measured values, RRW, LRW, and IMW were in the range of the excellent score of ICC (>0.8). The ICC of IZW was the lowest, while ICW then LCI and RCI had the next lower values. LCI, RCI, ICW, and IZW showed the ICCs in the substantial range (>0.6, <0.8) (Fig. 3).
With the data of the 30 edentulous patients, the mean coefficients of variation were also calculated in the same way as for the dentulous group (Fig. 4). In the edentulous group, IMW showed the lowest mean coefficient of variation followed by RRW and LRW. In contrast, the mean coefficient of variation of IZW was the highest and that of ICW followed. None of the inclination measurements were analyzed for this intra-group comparison, either. The coefficient of variation sets of each horizontal width in the edentulous group showed statistically different variances from one another as determined by the Levene Statistic (p=0.002). There was at least one statistically significant difference between the mean coefficients of variation of the horizontal widths in the edentulous group (Kruskal-Wallis test p=0.022). A Games-Howell post-hoc test revealed that the mean coefficient of variation of IMW was statistically significantly lower than the mean coefficient of variation of IZW (Table 3) in the edentulous group.
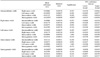
In a comparison of the dentulous and edentulous groups, the edentulous group showed lower ICCs than the dentulous group in each item (Fig. 3). The mean coefficients of variation of each item in the edentulous group were higher than those of each item in the dentulous group (Figs. 4 and 5). There were statistically significant differences in the mean coefficients of variation between the dentulous and the edentulous groups in the RRW, LRW, IZW, LCI, and Ramus Ratio (RR) (Table 1) (<0.05) (Table 4).
Discussion
In the panoramic radiographs of the dentulous patients taken with the conventional standard bite block, the mandibular ramus showed the best reliability, followed by the mandibular angle area. On the other hand, the zygomatic arch area showed the worst reliability, and the condylar head area showed the second worst reliability. These results showed good agreement with the precision values measured using the mean coefficients of variation. The mandibular ramus area, which was the closest area to the conventional standard bite block in the position of exposure among the horizontal widths showed the narrowest dispersion, and the mandibular angle area showed the second narrowest dispersion. The condylar head revealed the second widest dispersion, and the zygomatic arch area had the widest dispersion. In this dentulous group, the closer an anatomic area was to the conventional standard bite block, the better was the precision showed by the area. Also, mandibular areas except the condylar head showed a significantly better precision than the maxillary areas represented by IZW and the condylar head area according to a statistical analysis of the coefficient of variation.
The reliability and precision of the edentulous patients using the chin-support device showed a similar order to that of the dentulous patients. In the panoramic radiographs of the edentulous patients, the mandibular ramus demonstrated the best reliability, followed by the mandibular angle area. The condylar head showed the second worst reliability, and the zygomatic arch area revealed the worst. These results agreed relatively well with the results of the precision evaluation based on the mean coefficients of variation. The mandibular angle area, which was the closest to the chin-support device in the position of exposure among the horizontal widths showed the narrowest dispersion, and the mandibular ramus area showed the second narrowest dispersion. The condylar head area revealed the second widest dispersion, and the zygomatic arch area had the widest dispersion. In the edentulous group, the closer an anatomic area was to the chin-support device, the better was the precision exhibited by the area. The mandibular angle area also showed a statistically significantly better precision than the zygomatic areas. This result could originate from the fairly poor coefficient of variation values of the ramus area in the edentulous group, as compared to the dentulous group (Table 4).
The reliability and precision varied from area to area on the panoramic radiographs in the dentulous and the edentulous groups. The reliability and precision could be related to the positioning instability16 and motion factor9,17 of the moment of taking the panoramic radiographs. Mandibular areas except the condylar head area showed better reliability and precision than the maxillary and condylar head area. These results might originate from the instability of the maxillary area in positioning when taking panoramic radiographs. With respect to the positioning of the patients, their chin was positioned on the chin rest, which provided relatively fine stability, and almost fixed positions were guaranteed near the conventional standard bite block, particularly in the dentulous group. However, the head area was allowed to show some movement because of the instability of the head rest on the panoramic radiograph machine. The importance of the ideal head position has been emphasized in a study conducted by Pfeiffer et al, which showed the relationship between the head positions and the horizontal measurements in the panoramic radiographs.24 Also, Hardy et al showed the effect of the head position on the inclinations in the panoramic radiographs.25 Moreover, in the case of anatomic areas located farther from the most stable reference point, which was the biting point of the conventional standard bite block or the center point of the chin-support device, the precision of the areas on the reproducing panoramic radiographs worsened since farther distances from the reference point would make the areas more unstable and consequently, allow more random errors than the closer areas. Thus, if the reference point was located in the middle of a panoramic radiograph image, overall distances from the point to each of the areas could be minimized, and the random errors could be minimized accordingly.
The present study also revealed that the panoramic radiographs of the dentulous group showed better reliability (higher ICC) and precision (lower coefficient of variation) in each area on the images than those of the edentulous group. In particular, the ramus areas of the dentulous group showed statistically better precision than those of the edentulous group (p<0.01). The ramus areas were in almost the same horizontal level as the dental arch, which was one of the most important areas on the panoramic radiograph. Also, the zygomatic area of the dentulous group showed statistically significantly better precision than that of the edentulous group (p<0.05). Moreover, the reliability and the precision of the ramus area in the dentulous group were better than those of the chin area in the edentulous group, which implied that the conventional standard bite block could provide a more stable reference point than the chin-support device.
The reliability of the condylar inclination of the dentulous group was better than that of the edentulous group. The dispersion of the condylar inclination datasets in the dentulous panoramic radiographs was narrower than that in the edentulous panoramic radiographs, and the left condylar inclination in the dentulous group showed statistically better precision than that in the edentulous group (p<0.05). These results might originate from the differences in the inter-maxillary stability and in the distance from the fixed reference point between the dentulous and the edentulous groups.
The ramus width ratios between the right and the left side and the condylar inclination ratios between the right and the left side were calculated to measure the patients' variability of rotation in the vertical axis or the variability of the ratio between the right and the left side (Table 1). The dispersion of the ratios was also narrower in the dentulous panoramic radiographs than in the edentulous, and the ratio between the right and the left ramus in the dentulous group showed statistically better precision than that in the edentulous group (p<0.05) (Fig. 5, Table 4).
The conventional standard bite block of dentulous patients provided better positioning reproducibility for the panoramic radiographs than the chin-support device of the anterior edentulous patients due to the positioning stability and the adequate stable reference point, which was close to the middle of a panoramic radiograph image. Therefore, biting positioning can be considered better than chinsupport positioning.

 XML Download