

 PDF
PDF ePub
ePub Citation
 Print
Print


Introduction
Osteoporosis is a skeletal disease characterized by a low bone mass, deterioration of the bone structure, and an increased risk of bone fracture, and is a major health problem.1 Most of the cases are in women (90%), with Caucasian and Asian women at the highest risk. African-American and Latina women are at a lower but still significant risk.2,3 One-third of the women diagnosed with osteoporosis develop a fracture within 5 years.4 Hence, early diagnosis can improve the prognosis and the quality of life of patients; however, the silent nature of this disease may delay the diagnosis until fractures occur.5
Dentists are commonly consulted by a large segment of the population. Dental radiographs are usually taken to diagnose conditions affecting the teeth and jaws. Therefore, these radiographs may offer an opportunity as a screening tool for osteoporosis.6,7 Moreover, it was observed that the mandibular and femoral cortical width were decreased in a similar manner.8
Cone-beam computed tomography (CBCT) has been widely accepted in dentistry since its introduction in 1998.9,10 A few studies have used this imaging technique to evaluate osteoporosis of the jaw.11 However, additional programs, special phantoms, or both were used in most of these studies to analyze CBCT images. These complicated procedures hinder the use of such a method as a screening tool for osteoporosis. There is also the additional cost of the software or the use of a phantom. However, manufacturers of CBCT devices provide viewer software to study the images produced by their device. This software includes the necessary tools for basic and simple analyses such as multi-planar reconstruction, and measurements of the dimensions and radiographic density (RD) of the bone.
Therefore, the aim of this study was to evaluate the use of CBCT images in the prediction of osteoporosis in menopausal and postmenopausal women by using only the viewer program.
Materials and Methods
Subjects
Thirty-eight menopausal and postmenopausal women between the ages of 46 and 75 years (mean: 57.9±7.2 years) were enrolled in this study. All of them were free of diabetes, thyroid disorders, and bone diseases other than osteopenia or osteoporosis. Conventionally, they were classified into three groups, according to the T-score defined by the World Health Organization (WHO),12 once with respect to the lumbar T-score and the other time, with respect to the femoral neck T-score. Group 1 consisted of those classified as normal with respect to bone mineral density (BMD) (T-score≥-1); group 2, osteopenic women (-2.5<T-score<-1); and group 3, osteoporotic women (T-score≤-2.5). The numbers of subjects in each group were 10, 15, and 13, respectively, with respect to the lumbar vertebrae T-score, and 17, 11, and 10 respectively, with respect to the femoral neck T-score. Taking into account ethical considerations, the Faculty of Dentistry-Damascus University Board approved this study. In addition, informed consent was obtained from each participating woman.
Dual-energy X-ray absorptiometry (DXA) examination
A DXA examination of the participants had been ordered by the physicians. The patients were invited to participate in this study only after this examination. The examination was performed using the Hologic Discovery QDR® (Hologic Inc., Bedford, MA, USA), calibrated daily in accordance with the manufacturer's recommendations. The lumbar spine (L1-L4) and the femoral neck were analyzed. T-scores were calculated from the young adult normal white reference databases as reported by the equipment manufacturer.
CBCT imaging
A WhiteFox® unit (Acteon Group Ltd., Milan, Italy) was used in this study. The field of view (FOV) and the voxel size were set at 13 cm×15 cm and 250 µm, respectively. WhiteFox Imaging® Version 3 (Acteon Group Ltd., Milan, Italy) is the viewer software that was used to analyze the CBCT images. Like most viewers, it contains basic tools such as those for RD calculations, dimension measurements, and multi-planar reconstruction.
Angulation adjustment of CBCT images
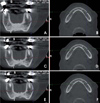
In order to reduce the differences in head position between participants and for reproducibility purposes, the angulation of the slices was adjusted manually first by adjusting the coronal cursor in the axial window, so that the right and left mental foramina had a symmetrical appearance. This was checked by navigating throughout the coronal slices and observing this symmetry of the right and left mental foramina (Figs. 1A-D). Second, the axial cursor (in the coronal window) was adjusted to pass through the lower borders of both mental foramina (Figs. 1E and F).
Slice selection and analysis
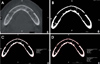
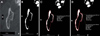
An axial slice that passes through the inferior border of both the right and the left mental foramina, described above, was selected (Fig. 2A). In addition, two axial slices from each ramus were selected (i.e., four axial slices for each participant). The number of axial slices from the sigmoid notch to the convergence of the ramus with the body of the mandible was counted. The inferior slice and the slice in the middle of this range were both selected (Fig. 3A). In total, five slices were selected for each woman. For each slice, the window level and width were adjusted to gray values of 960 and 0, respectively, so that the slice became a binary image (white and black) (Figs. 2B and 3B). This would standardize the slice appearance among all the cases studied. Changing the window width to zero would make the bone borders clearer (Figs. 2B and 3B). In addition, the bone would appear divided into two areas, an outer white cortex surrounding an inner black (or speckled black) area, which was considered in this study, and the cortical and the trabecular bone. There has been no previous study that has reported thresholds of the cortical and trabecular bone on the CBCT device used in this study. Therefore, this study depended on the manufacturer's claim that they have calibrated the device's gray values with the Hounsfield Unit (HU) of conventional CT,13 and on cortical bone thresholds determined previously in CT images.14
Using the "measure polygon" tool with a magnification factor of 250%, we calculated the RD and area in square millimeters of the whole bony region (Figs. 2C and 3C) and of the trabecular bone alone (Figs. 2D and 3D) for each selected slice. Then, the ratio between the trabecular area and the whole bony area was calculated. In total, the values of two variables-RD in gray values for the whole bony area and for the trabecular area alone, and the cortical bone percentage-were calculated for each slice (i.e., 15 values were obtained for each participant).
Statistical analysis
One-way analysis of variance (ANOVA) and a subsequent Bonferroni test were performed to investigate the significance of the differences between groups in the mean values of the CBCT-derived variables. In addition, Pearson's correlation was used to find the relationship between the femoral neck and lumbar vertebrae T-scores and CBCT-derived variables. The correlation strength was considered weak, medium, or strong when the correlation coefficient values were 0.2<r≤0.4, 0.4<r<0.7, and r≥0.7, respectively.14 Correlation coefficient values of 0<r≤0.2 were regarded as showing no correlation. Next, a logistic regression analysis was carried out, after regrouping subjects into "osteoporotic" and "not osteoporotic" women according to the DXA results, to identify the strongest predictor of osteoporosis. These prediction models were assessed on the basis of their statistical significance and the sensitivity, specificity, and accuracy of predicting the presence or absence of osteoporosis. For all statistical tests, the significance level was set at 0.05. A kappa test was performed to assess the intra-examiner agreement for 10% (4 CBCT images) of the sample.15
Results
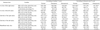
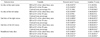
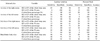
Table 1 summarizes the age and body mass index (BMI) for each group. None of the participants were alcoholic or had a previous bone fracture in either the lumbar vertebrae or the femoral neck. Descriptive data of the CBCT-derived variables for each group are presented in Table 2. Significances of differences between groups were tested by oneway ANOVA and subsequent Bonferroni tests (Table 2).
Table 3 shows the Pearson's correlation test between CBCT-derived variables and lumbar vertebrae and femoral neck T-scores. Correlations with femoral neck T-scores ranged from weak (0.2≥r>0.4) to medium (0.4≥r>0.7). One variable revealed a weak correlation with lumbar T-scores, whereas for the rest of the variables, the correlations were moderate. However, not all correlations were significant (Table 3).
Sensitivity, specificity, and accuracy values based on the logistic regression analysis for each variable are presented in Table 4. A low sensitivity value is a predominant characterization. Simple logistic regression test results, for variables that revealed significant differences in their mean values between groups as well as the highest values of Pearson's correlation and sensitivity, are presented in Table 5. The kappa test value was 0.87, indicating good intraexaminer agreement.
Discussion
Osteoporotic fractures may affect any area of the skeleton other than the face, and the most common sites are the hip, vertebrae, proximal humerus, and the forearm.16,17,18 The morbidity and mortality of fractures of the hip are the worst among fracture locations since 10%-20% of women die within the first year of fracture. Those who survive typically suffer from disability that deteriorates the quality of their lives.19 Mortality was found to increase by 15% when pain was associated with a vertebral fracture.20 The silent nature of this disease increases the difficulty of its diagnosis.5 Therefore, all medical professionals should participate in identifying patients suffering from this disease and refer suspicious cases to specialists.
The CBCT technique for dental use, which was introduced about one and a half decades ago, offers 2-dimensional and 3-dimensional images for the radiographed area with a relatively low cost as compared to conventional CT. The radiation dose is comparable to that of panoramic imaging in the case of small FOVs. This may explain the widespread use of this technique in dentistry.9,21 It is expected that this imaging technique may substitute for periapical devices in dental clinics in the near future.
Manufacturers of CBCT scanners provide viewer software allowing the users to open the CBCT dataset and to study the case. Conventionally, this software has the tools necessary for basic analyses such as multi-planar reconstruction, dimension measurement, RD calculation, and the calculation of the mean value of voxel gray values. Despite its advantages, the CBCT technology has a flaw with respect to RD measurement.21 CBCT gray values are considered approximate values14,22 and thus, cannot be expressed as HU as in the case of conventional CT scans.11 Inaccuracy of gray values by CBCT was attributed to the absence of water path calibration in contrast to conventional CT.23 Most studies have reported that the gray values obtained by CBCT are higher than the HU values obtained by conventional CT of the same region.24,25 What complicates this comparison further is the differences between CBCT scanners in terms of their gray values. Some studies conducted in the last 5 years have found high correlations between gray values of different CBCT scanners both in vitro23,26 and in vivo,27 and between gray values of CBCT and HU values of conventional CT;24,28,29 further, some authors have also suggested equations or formulas for converting gray values to HU values. However, more research effort should be directed to this subject, particularly at the clinical level.
"RD for the whole bony area" of the mandibular body slice was the variable with the strongest power to predict osteoporosis in both the femoral neck and the lumbar vertebrae. According to the logistic regression models and one-way ANOVA, if the RD of the whole bony area of the mandible is equal to or lower than gray values of 867-900 or 829-838, the woman is expected to have lumbar vertebrae or femoral neck osteoporosis, respectively. Apart from these absolute values, the current study showed differences in the RD of the mandibular slice by CBCT between the studied groups. Therefore, the above-mentioned thresholds can be converted to values that correspond with other scanners' gray values, or this study methodology might be applied to other CBCT scanners.
A limitation of the current study was the dependence on the above-mentioned claim of the CBCT manufacturers with respect to the discrimination between cortical and trabecular bone. Further studies are highly recommended to determine the thresholds that best correspond with the real anatomy of bone for each CBCT device. However, in the current study, the results of the thresholds used showed quite a good degree of prediction (Tables 4 and 5).
Unlike most other studies, we utilized the simplicity of the viewer software without any additional programs or calibration phantoms that usually are neither available nor easy to use by most dentists. Moreover, no standard head position was used during scanning, and the resulting differences between participants were overcome by adjusting the angulation in the final sections. On the other hand, the angulation adjustment made the reproducibility of the measurements achievable, which was proven by the kappa test. The two-stage procedure - modification of the angulation and RD calculation - was quite fast and easy. The developers of such software may add a new tool that performs these procedures automatically and sends a message to the dentist to advice women for further investigation when low bone density is predicted in the femoral neck or the lumbar vertebrae.
In an opposite direction to the findings of Buyukkaplan et al,30 this study found that the RD value of the mandibular body of the whole bony area gave a general impression of the status of the femoral neck bone density. This might help to infer the status of one of these two locations when the status of the other site is known.
The correlation between trabecular bone RD and T-scores was less than that observed for the whole bony area. At first glance, this appeared to be opposite the expected result because previous studies found that trabecular bone was more susceptible to the changes in bone metabolism than the cortex, thus providing better data for early diagnosis and treatment efficacy.31,32 However, our findings may be attributed to the fact that bone microarchitecture is mainly what deteriorates33,34 and not the mineral content. This was consistent with an old study35 conducted years before the introduction of DXA and quantitative computed tomography (QCT); this old study reported changes in the trabecular bone during osteoporosis. Although our result regarding the relationship between the RD of the mandibular trabecular bone and lumbar T-scores (r=0.51, p=0.001) was slightly higher than the findings of Naito et al14 (r=0.35; p=0.059) and was statistically significant, the prediction models of this variable were useless (Table 4).
Hua et al11 compared DXA-BMD and the CBCT-derived density for the mandible and found no correlation. This did not contradict the findings of the current study, as we correlated the output values of both techniques in two different locations of the skeleton. On the other hand, they attributed the absence of correlation to the intensity inhomogeneity of CBCT images. However, it should be noted that DXA measures only the mineral content (then divides it according to area), whereas CBCT-derived density is measured by calculating the mean of all pixels values (including those corresponding to the bone marrow) in the involved area. Therefore, a comparison of the same object with these two techniques may lead to an absence of a correlation as found by Hua et al.11
Koh and Kim36 found that some CBCT measurements could differentiate between normal and osteoporotic women, but their sample did not include osteopenic women. Accordingly, it is worth asking whether detecting osteoporotic women from a group of osteopenic women is possible using the same technique, taking into account the possibility that the difference between these two groups is less than the detection ability of the diagnostic tool.
With respect to the variations of the correlation between panoramic-derived measurements and DXA-BMD, weak,37 medium,38 and high39 correlations were obtained. This was true for the CBCT and CT-derived measurements as well, where different correlation strengths were obtained.11,40,41,42 Intraoral radiographs were used to determine the jaw bone density, and the results differed according to the analysis technique.43 These disparities seemed to be affected by the analysis procedure rather than the imaging techniques.
DXA is widely available and is the most common clinical technique used to diagnose bone fragility;44 however, one of the main drawbacks of DXA is that it measures the bone mineral contents rather than the bone microarchitecture. The latter is measured clinically by high-resolution CT(hr-CT) and Q-CT45 and is much more important in the detection of the etiology of osteoporosis.32 Although it was found that the correlation of mechanical competence (measured by DXA) between different sites in the skeleton is weak,46 the use of bone microarchitecture-based techniques, such as CBCT, may lead to different conclusions.
In conclusion, femoral neck and lumbar spine osteoporosis can be predicted with high accuracy from the RD of the mandibular slice that passes through the lower borders of the mental foramina by using CBCT along with its viewer program.


 XML Download