

 PDF
PDF ePub
ePub Citation
 Print
Print


Introduction
The success of dental implants can be assessed clinically and radiologically. In terms of the radiological assessment, the features of successful implantation include a mean crestal bone loss of no greater than 1.6 mm during the first postoperative year and no greater than 0.13 mm through the maintenance period, and lack of peri-implant radiolucency.1,2 However, we have little knowledge of the effects produced by functional endosseous implants on the quality and architecture of the surrounding trabecular bone.
Imaging is an essential part of endosseous implant therapy in preoperative, intraoperative, and follow-up assessments. An ideal imaging technique should reveal many significant characteristics at specific stages of the implant therapy. Therefore, a combination of radiograph techniques is used with certain indications.3
Digital radiography is known to be one of the most sensitive methods for assessing subtle changes in trabecular bone density. It has high image photometric accuracy, wide dynamic range, and high resolution capacity for dental assignments.3 Furthermore, it allows for image enhancement and processing on a computer monitor, such as magnification, skeletonization, and contrast optimization.3,4,5
The objective of this study was to assess the trabecular bone changes that occurred around functional endosseous dental implants by means of radiographic image analysis techniques. A specific image analysis technique was performed in order to quantify the structural elements of the trabecular bone. Accordingly, the null hypothesis was as follows: There would be no significant quantifiable differences in the trabecular bone structure on radiographs subjected to repeated analyses.
Materials and Methods
Selection of patients
The computer database of anonymized implant patients at the University Dental Hospital of Manchester was retrieved and screened for the following inclusion criteria: 1) endosseous implants of the Frialit-2 implant system (Friadent GmbH, Mannheim, Germany), which was the most commonly used implant type in the institution, 2) availability of (immediate) preoperative and (12-24 months) postoperative periapical radiographs, 3) adequate technical quality of radiographs, 4) clinical and radiographic evidence of the absence of local pathology, and 5) patients with unremarkable past medical history.
Image digitization
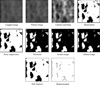
The periapical radiographs were digitized by an Epson Expression 1680 Pro Scanner (Epson UK Ltd., Hemel Hempstead, UK) using an 8-bit gray scale and with a resolution of 1200 dots per inch (dpi) so that they could be subjected to several software processing techniques, through a number of stages. In the first stage, Adobe Photoshop Elements version 3 (Adobe Systems, San Jose, CA, USA) was used to select three boxed regions of interest (ROIs) in each periapical image, first by using the marquee tool and then by cropping. For meeting the inclusion criteria of the ROI, one region was of 150×150 pixels in the tagged image file (TIF) format just below the root apex for single-rooted teeth and at a mid-point below and between the apices for multi-rooted teeth. The other two regions of 150 (height)×75 (width) pixels in the TIF format were selected parallel to the apical third of the root on both mesial and distal aspects (Fig. 1). In general, the three boxes were confined to the periapical areas without lamina dura containing the trabecular bone seen as white lace-like structures on the gray background of the marrow. As the final step in this stage, the three cropped images were converted into an Adobe Photoshop grayscale image and then filtered (radius 31, amount 50, and threshold 0) (Fig. 2). Image filtration could be defined as a procedure in which a computer adjusts an image by convolving it with a filter function, in terms of smoothening and sharpening in order to improve the image quality.3
Image optimization
In the second stage, the 30 filtered images were processed using EMAGO Software (Oral Diagnostic Systems, Amsterdam, the Netherlands) in order to obtain contrast stretching followed by optimization of the contrast of gray levels from which the histograms for each image were acquired. The peak of each histogram was identified manually to determine the threshold numbers for subsequent binarization (i.e., segmenting the image into trabeculae and marrow).5 On some occasions, there were two peaks for one histogram, and in these situations, a subjective estimate was made to identify the midpoint between the peaks for the threshold number determination. Then, the images were binarized, and subsequently, the noise was suppressed (Fig. 2).
Trabecular analysis system
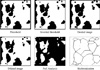
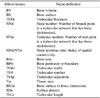
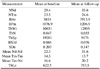
In the last stage, the Win TAS (S. Paxton, University of Leeds, UK) automated trabecular analysis system was used. The first step in this stage was to apply thresholding (i.e., separating the trabecular network from the background marrow) in order to further suppress the image noise so that they are recognized by the software.6 As a result, at this level, the marrow was seen as white and the trabeculae as black. Then, the images were eroded (i.e., pixels from the edges of objects in binary images were removed by separating objects that touched each other and removing isolated pixels) once and dilated (i.e., pixels at the edges of the objects were added by joining discontinuous objects and filling in the holes) once.3 Finally, the resulting images were analyzed and skeletonized (i.e., repeated elimination of pixels from the borders of objects in a binary image until they are diminished to single pixel-wide skeletons) to their final form of algorithmic "parallel plate" parameters (Table 1). The gray scale of the images was inverted to make the trabecular component white, and thus, its measurements were obtained. The last stage was repeated for the whole set of images (Fig. 3). As a result, two sets of skeletonized images led to two sets of quantitative tables (marrow and trabecular).
Statistical analysis
Data were analyzed in SPSS version 11.5 (SPSS Inc., Chicago, IL, USA). The mean value, standard deviation range, and 95% confidence interval were calculated for each parameter obtained by Win TAS (marrow and trabecular) for the first and the second sets of images. The paired data were then analyzed to calculate the repeatability of parameters. Two-tailed paired t-tests were used to assess the significance of differences between the first and the second image analyses. The p values of less than 0.05 were accepted as statistically significant.
Results
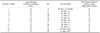
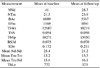
A total of 12 implants from 11 patients were selected for the study; however, only 26 ROIs (instead of 36) were finally included because the space available for ROI placement was insufficient in the rest of the cases (Table 2). There was a significant increase in bone area in terms of the mean distance between nodes (p=0.006) and a significant decrease in marrow area in terms of the bone area (p=0.006) and the length of marrow spaces (p=0.032). Tables 3 and 4 show the mean bone and marrow parameters from the baseline (first) and follow-up (second) sets of radiographs for ease of comparison.
Discussion
The development of a non-invasive technique for measuring bone architectural changes has been a challenge for many research groups.7 Texture analysis of peripheral microtomographs has been suggested as an alternative approach.7 However, in a dental context, these techniques are difficult for many clinical research groups because of the limited availability of equipment or practical problems in their use. However, although two-dimensional radiographic measurements fail to spot some information regarding the out-of-plane curvature of trabeculae, they have significant correlation with data provided by three-dimensional computed microtomography. Furthermore, it has been shown that trabecular bone microarchitecture can be measured by the texture analysis of radiographs of the dried bone.8
There were some technical limitations in this clinical study that should be addressed. The first was that the images had to be modified in Adobe Photoshop, processed in EMAGO and then analyzed in Win TAS. This long course of action was rather time consuming and tedious in terms of filing and saving the images, and confusing in terms of transferring them from one system to another. This difficulty could have been overcome if a special software system had been designed specifically for dental radiology practice.
The second limitation was the size and inflexibility of the rectangular marquee tool used in the Adobe Photoshop elements, which was larger than the implant and as a result, could not follow the implant contour. This led, in some cases, to the elimination of one or two out of the three ROIs (a, b, and c). However, the elimination was consistent through the first and the second sets of the image analysis. A solution for this problem might be achieved by designing the marquee tool to be freely variable in size and shape, perhaps by using a cursor-generated freehand ROI.
Third, although images were acquired by a paralleling technique with the same X-ray machine and fixed exposure parameters, there was still some variation in the X-ray angulation that resulted in a minor difficulty of retaining the same proportions of ROI on the paired images. In some cases, there was a shortage of space around the implant on one radiograph, such that it was difficult to obtain the same ROI, leading to the exclusion of that ROI from the analysis or a change in the position of the marquee tool in others. The importance of standardization was highlighted by Jonasson et al, particularly, as mentioned above, in relation to the angulation of the X-ray beam.9 Grondahl et al have mentioned that even minor deviations in the vertical angulations of the X-ray beam could cause discrepancies in bone measurements that could be easily observed between serial radiographs.10 Consequently, some researchers could have reported measurement discrepancies as bone loss or gain.11 However, our preliminary study provides a foundation for future work and gives technical guidance for a prospective study on the scope of assessment of the trabecular bone in the periapical region of dental implants. A majority of similar studies have focused on the marginal bone height and the osseointegration phase.12,13,14
Our results showed a significant difference between some parameters in the baseline and follow-up sets of radiographs in terms of the increase in the value of the quantifiable changes in the trabecular bone structure around the Frialit-2 implant after being put into clinical function. This can be masked by few data throughout the individual cases, meaning that although some cases showed an increase in the follow-up values while others did not, there was an increase in the overall results. However, it can be argued that this difference could be related to the lack of perfect standardization measures in the procedure for taking radiographs.
When the data from all of the patients were considered, there was no significant difference between the baseline and the follow-up radiographs for almost all the bone parameters except the bone area (BAr) and the mean distance between nodes (mean Nd-Nd). Thus, the null hypothesis was rejected for these two parameters and accepted for the others, indicating that there were no significant quantifiable changes in the trabecular bone structure around the endosseous implants after being put into clinical function for almost all of the parameters. Regarding the marrow spaces, the null hypothesis was accepted for all the parameters except for bone area (BAr) and trabecular length (TbLe). What do these results mean? Seemingly, the most convincing result was the increase in bone area in the ROIs and the concordant fall in the marrow area. Thus, it appeared that the bone around the implant underwent remodeling that resulted in a net increase in the bone after implant placement. Therefore, the effect of successful implants on the bone did not appear to be limited to the immediate implant/bone contact area. If this result was correct, then the likely explanation was the effect of stresses and strains of implant function on the bone. However, this could be related to the scientific fact that the bone is a complex organ with cells specifically devoted to a continuous process of remodeling. According to Wolff's law,15 bone has the ability to alter its strength through the production of collagen fibers and increased deposition of minerals as a protective measure. Therefore, disuse of bone leads to atrophy, whereas increased stresses lead to bone deposition. Another probable effect of mechanical stress is the increased production of the calcitonin hormone that inhibits bone resorption. This information could be of great significance in explaining the increase in trabecular bone area (BAr) around Frialit-2 implants and relating the success of the implant to the equal distribution of stress around it.
Our cases involved implant placements into the edentulous areas of varying durations. Therefore, it was likely that a degree of bone loss in the implant site space occurred during the intervening period. Thus, we postulated that implant placement and subsequent functional stresses caused the bone deposition detected by our analysis. It would be interesting to see whether this observation would be identifiable in cases of immediate implant therapy, where there would be no intervening time allowing for bone atrophy.
In conclusion, several methods should be used in parallel to measure the trabecular architecture, as a single technique may focus on a given aspect and neglect the others. In the context of our study, identification of alternative techniques was more difficult. The small scale and fine details on dental intraoral images implied that other suggested alternative techniques (such as peripheral microtomographs) are probably not applicable. Rather, it would be possible to perform a subjective image analysis of the architectural or densitometric measurement.

 XML Download