

 PDF
PDF ePub
ePub Citation
 Print
Print


Introduction
Ethnicity is an ambiguous term, and widely used interchangeably with race.1 An ethnic group is "a highly biologically self-perpetuating group sharing an interest in a homeland connected with a specific geographical area, a common language and traditions, including food preferences, and a common religious faith".2,3 Quantifying human growth and maturation is important in several fields, including pediatrics, pediatric dentistry, orthodontics and orthopedics, anthropology, criminal justice, archeology, and forensic sciences. Among the various methods proposed for assessing maturation, some of the most common measures rely on dental and skeletal maturation.4 According to Willems, due to the low variability of dental indicators, dental maturity has been widely used to estimate the chronological age of children and adults.4 Several approaches (such as atlas and morphological/radiological techniques) have been developed for quantifying dental maturation; however, scoring systems are the most reliable.5 Demirjian et al,6 using the first seven teeth of the left lower quadrant, developed a simplified scoring system for dental maturation assessment by giving the teeth a score of A through H. A digit maturity score was assigned for each of these teeth and was differentiated for boys and girls. Adding these scores results in an overall maturation score that can be converted to an estimated age using tables and curves developed separately for boys and girls. The differences between chronological and estimated age reported in the subsequent studies that duplicated Demirjian et al have been justified mainly based on ethnicity and related factors (e.g., nutrition). Demirjian et al used French-Canadian children in developing their scoring system, and therefore, the maturation scores must be adjusted in accordance with the ethnicity of the sample under examination. As a result, several ethnicity-specific Demirjian curves have been suggested for estimating age in a specific population.7-12 Although most authors who recommended the use of revised Demirjian tables and curves have proposed that the difference between the Demirijian estimated age and true age was due to ethnicity, this was not clearly the case because there were often contradictory results among the same ancestry/ethnicity group and nationality. Dental age assessment using Demirjian's method on Indians, for example, elucidated this problem. While Hegde and Sood13 found the method of Demirjian to be accurate with an overestimation of 0.14 years for males and 0.04 for females, Koshy and Tandon14 reported the most extreme overestimation in the literature (3.04 years for males and 2.82 years for females). Prabhakar et al15 found intermediate results: an overestimation of 1.2 years in males and 0.9 years in females.
The purpose of the current study was, therefore, to assess the dental maturity of a sample of Saudi children using several ethnicity-specific Demirjian curves. The hypothesis was that the curves developed using Arab (Saudi and Kuwaiti)9,11,16 and Asian (Pakistani)12 populations would result in lower errors in the prediction of age compared with the curves developed for European (Belgian, Dutch, and Polish)7,8,10 and Caucasian+Amerindian (French-Canadian) 6 populations.
Materials and Methods
A sample of 452 panoramic digital radiographs of healthy Saudi children aged 4 to 14 years (240 males and 212 females) met the inclusion criteria: clear radiographs without blurring or artifacts in the region of the lower left quadrant and all permanent teeth (with the exception of third molars) were present and free of pathology that might affect tooth maturation (e.g., pulp involvement). The radiographs were collected from the Riyadh Colleges of Dentistry and Pharmacy, a private academic institution in Riyadh, the capital of Saudi Arabia, and the protocol was registered by the Riyadh Colleges of Dentistry and Pharmacy Research Center (FRP/2013/14). After masking the age and gender of the subjects, the radiographs were assessed by one rater following Demirjian's method,6 with a pre-determined intra-observer reliability calculated by re-assessing 25 radiographs in at least a two-week interval between the first and second ratings.
The maturation score for each individual was converted to the estimated age using curves/tables for French-Canadian,6 Saudi,9,16 Kuwaiti,11 Pakistani,12 Polish,10 Dutch,8 and Belgian7 populations. Two tables from two different studies on the Saudi population were used because one of them did not estimate age for children younger than 8.5 years,9 whereas the other study developed the equations of age estimation starting from 4 years (referred to here as SaudiExtend).16 The 5th percentile and 50th percentile converted scores from the Belgian tables were also used because an earlier study on Saudi children17 found that the 50th percentile from Belgian tables resulted in high errors in age prediction. Here, a percentile is a statistical measure indicating the value below which a given percentage of observations (for example, age) in a group of observations fall. The 5th percentile is the value below which 5% of the observations may be found. Similarly, the 50th percentile is the value below which 50% of the observations may be found and the 50th percentile curves are usually used to transform the dental score to dental age. The differences between the chronological age and estimated age were tabulated according to the sex, age group, and curve used. The interclass correlation coefficient (ICC) was used to test the intra-observer repeatability. One-way ANOVA and a post hoc Scheffé's test compared the differences between the true and estimated age, and were tabulated in homogeneous subsets, showing curves with similar differences. Plots using mean differences and mean absolute differences between the true and predicted age were used to quantify the performance of different curves. All analyses were performed for males and females separately using SPSS version 19.0 (IBM Corp., Armonk, NY, USA) at a 0.05 level of significance.
Results
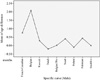
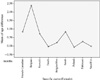
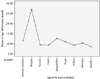
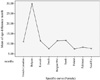
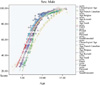
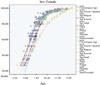
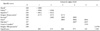
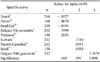
The ICC was 0.994, indicating a high level of reproducibility. ANOVA revealed an overall significant difference between the curves for both males (F=114.8, P=0.000) and females (F=157.8, P=0.000). Tables 1 and 2 provide homogeneous subset results in order of ascending means. The means that are listed under each subset comprise a set of means that are not significantly different from each other. For males, there were 6 subsets; for females, there were 3 subsets. For both genders, however, the Belgian (50th percentile) group was significantly different from all of the other groups, as it does not appear in a subset together with any of the groups. Figure 1 demonstrates the plots of mean differences between the true and estimated age for the different curves. It is evident that the curves designed for Dutch, Polish, Saudi (extended), and Belgian (5th percentile) populations had a significantly lower error in estimating age than the other curves. The curve designed for the Belgian population (50th percentile) had the largest error in age prediction. A comparison between the curves for females showed similar results to those of males with the addition of the Pakistani curve successfully estimating age (Fig. 2). However, the analysis and plotting of the mean absolute difference between the true and estimated age showed that the optimal curve for males was the Saudi (extended) curve with a mean absolute difference of 8.6 months and the least optimal was the Belgian (50th percentile) curve with a mean of 27.1 months (Fig. 3). For females, the optimal curve was that of the Polish with a mean absolute difference of 7.4 months and the least optimal was the Belgian (50th percentile) one with a mean of 29.9 months (Fig. 4). Figures 5 and 6 show the maturation growth curves of the sample population, as demonstrated by different methods used in the study. Maturity curves were calculated as the average score per year determined by different methods for dentally immature Saudi Arabian boys (Fig. 5) and girls (Fig. 6). It seems that the curves differ in score to the 50th percentile for chronological age for children younger than 8 years of age. The Belgian curves differed for all children regardless of their age or gender.
Discussion
Amongst several recognized factors that play a role in human growth, maturation, and body composition, ethnicity or race is considered to be a major influence altering growth and accounting for differences between groups.3 In this study, an attempt was made to test the role of ethnicity in determining the age of subadults by estimating the age of a group of Saudi children using several ethnic-specific dental maturation curves. Although Saudi-specific curves were successful in estimating age, other non-Saudi curves proved to be as accurate as the Saudi ones or even more so. The most surprising result of this study was that the curves designed for Europeans (Polish and Dutch, in particular) showed lower errors in age prediction than the Kuwaiti and Pakistani curves. The Belgian curves showed contradictory results: the 5th percentile was much more accurate than the 50th percentile. Notably, 50th percentile curves are advocated for human growth appraisal.6 However, Figures 5 and 6 reveal that the 5th percentile Belgian curves were not accurate when used with the youngest age groups (four and five year olds). However, in the older age groups, these curves were accurate, unlike the 50th percentile Belgian curves, which showed the largest deviation. Another point worth mentioning is that all of the curves, with the exception of the 50th percentile Belgian curves, revealed fewer errors in age prediction in older age groups. The results of the current study support the notion held by many scholars that population-specific maturation curves are more accurate than the original Demirjian standards based on French-Canadian populations, but fail to support the other firm belief that ethnicity is the major root cause, or at least a major one, of the developmental differences seen among populations. The Dutch sample would be ethnically similar to the Belgian sample and different from the Saudi sample. However, the Dutch curves 'succeeded' in age prediction whereas the Belgian curves 'failed.' Such contradictions have been previously reported in the literature.18 Liversidge and Speechly's study failed to demonstrate an ethnic difference in tooth formation in a group of British children of Bangladeshi or white Caucasian origin.18 More interestingly, the age of the population as a whole was being underestimated. As noted earlier, the ages of Indian children were significantly overestimated.13-15 Ancestrally, Bangladeshi and Indian populations are more similar than the British population, but the error in the Bangladeshi development estimation was opposite that of the Indians. In addition to ethnicity, secular changes and environment have been suggested as possible justifications for the differences in dental maturation found in many populations.3 However, our results did not support such suggestions. The results lead us to reject the study hypothesis and conclude that factors such as ethnicity, secular changes, and environment cannot be used alone to justify the differences in dental maturation seen among different populations. In addition, population-specific dental maturity curves from different reports are similar in shape, suggesting that populations are similar in dental maturity with differences in timing of individual tooth stages, particularly for the youngest age categories.
 XML Download