

 PDF
PDF ePub
ePub Citation
 Print
Print


Introduction
Treating patients with cleft lip and palate is commonly done in a team setting and usually spans from birth until adolescence. The alveolar cleft sometimes highlights the problem of the penetration of food into the nasal cavity. As a result of this, the lateral incisor and canine cannot erupt into normal position since there is no bone support in the cleft area. These patients are always treated by alveolar bone grafting, which corresponds to a chronological age of a 9- to 12-year-old before the mid-facial growth has been completed. The alveolar bone grafting provides periodontal support for the teeth with bone augmentation to support the lip and an alar base that also closes the oronasal fistulae.
Dental radiographs are always used to evaluate the success rate of alveolar bone grafting using a marginal bone level in variety of scales. However, these scales always evaluate the cleft side by visual inspection and cannot compare it to the normal bone.1-9 Although computed tomography (CT) can evaluate the bone volume of the bone graft, it is expensive and exposes patients to too much radiation.10 Therefore, a simple and cost-effective method would be useful for patients in clinical environment.
Heretofore, no study has been carried out on trabecular bone analysis using a computer-aided diagnosis (CAD) system for evaluation of the graft site of the cleft palate. The purpose of this study was to use a CAD system on digital images as a tool to quantitatively measure the pixel area of trabecular bone changes after alveolar bone grafting in unilateral cleft lip and palate (UCLP) patients.
Materials and Methods
The occlusal radiographs taken from 70 UCLP patients at the Radiologic Clinic, Faculty of Dentistry, Khon Kaen University from 1999 to 2010 were surveyed retrospectively. The exclusion criteria for the radiographs were images that had poor diagnostic quality including scratches on the radiograph or too much distortion, and patients who did not undergo follow-up. Therefore, 20 patients' data were excluded and 50 UCLP patients' images were included in this study. The images were classified as follows: group 0: before bone grafting, 50 images, group 1: one month after bone grafting, 33 images, group 2: 2-4 months after bone grafting, 24 images, group 3: 5-7 months after bone grafting, 15 images, and group 4: 8 or more months after bone grafting, 21 images. The 50 patients included 20 males and 30 females. Patient age at the time of the alveolar bone grafting ranged from 8 to 29 years (mean; 12.3±4.6). There were 16 sites of right UCLP and 34 sites of left UCLP. All of the images were digitized on a flatbed image scanner with a resolution of 600 dots per inch (dpi) spatial resolution and 8-bit depth contrast resolution (256 gray levels) (Epson expression 10000XL, Long Beach, CA, USA).
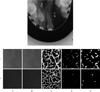
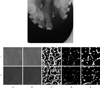
The CAD system11 was used to select two regions of interest (ROIs), the 'non-cleft side' and 'cleft side'. The CAD algorithm was implemented by a technical computing language (MATLAB R2010a, MathWorks Inc., Natick, MA, USA). The ROI, a square portion of 64×64 pixels, was extracted by dragging the mouse from a randomly selected single point to 64 pixels left and 64 pixels downward. The tooth structure, periodontal ligament, and lamina dura were excluded from each ROI. Next, the noise was removed by median filtering. Morphological skeletonization was then used to extract the medial axis of the trabecular bone, which was regarded as the prominent region that was brighter than the surrounding structures, and subsequently, the images were enlarged 64-fold. The 'strel' function was selected from the computing language to create a flat, rectangle-shaped structuring element (strel ('rectangle',[2 3])) where [2 3] is the size. In the matrix [2 3], the first element was the number of rows in the structuring element neighbourhood; the second element was the number of columns. Then, the most basic morphological operations, which were 'erosion' and 'dilation,' were performed. The 'erosion' function removed pixels on the object boundaries, while dilation added pixels to the boundaries of objects in an image. The number of pixels added or removed from the objects in an image depends on the size and the shape of the structuring element used to process the image. Finally, the pixel area calculation was used to estimate the area of the trabecular bone in the binary image, that is, the digital image that had only two possible values for each pixel, namely 0 and 1 (Figs. 1 and 2). The pixel area of the "non-cleft side" and "cleft side" from group 0 to group 4 were calculated and compared. The measurements were made five times, once a week, on each side by an oral radiologist. Five positions were randomly selected at the "non-cleft side" and "cleft side" on the same image. All of the pixel areas of the image were then calculated. Statistical tests were performed using SPSS 10.1 (SPSS Inc., Chicago, IL, USA). Descriptive statistics were applied. The Shapiro-Wilk test was used to evaluate a normally distributed pixel area. Wilcoxon signed ranks test was used when the data did not show normal distribution and the paired samples t test was used when the data showed normal distribution. The study design was approved by the Khon Kaen University Ethics Committee for Human Research.
Results
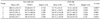
The pixel area was significantly different between the "non-cleft side" and "cleft side" in group 0 (404.27±103.72/117.73±92.25; p=0.000), group 1 (434.29±86.70/388.31±109.51; p=0.012), and group 4 (430.98±98.11/366.71±154.59; p=0.020), whereas there were no significant differences found in group 2 (423.57±98.12/383.47±135.88; p=0.060) or group 3 (433.02±116.07/384.16±146.55; p=0.192) (Table 1).
Discussion
Alveolar bone grafting in patients with cleft lip and palate is now a common practice owing to several advantages. It can help to prevent the collapse and constriction of the dental arch, to close the oronasal fistula, and to allow eruption of teeth into the cleft. The bone grafting is fully revascularized between 14 and 21 days, and new bone is formed in approximately six weeks and has matured after six months.12 It is generally thought that osseous healing of transplants is completed six months after the operation. Nightingale et al compared three methods of radiographic assessment, the Bergland, Kindelan, and Chelsea scales, which produced great reproducibility rather than validity.9 Over- and under-estimation of the success rate of the alveolar bone grafting has also been reported in some cases.13 The CAD system, therefore, has been developed to determine the bone quantity in the alveolar cleft after bone grafting. This CAD system uses mathematical morphology and calculates the area on the binary images that can be produced by MathWorks. Our results showed that the pixel areas from the binary images in the "cleft side" were significantly smaller than those on the "non-cleft side" in group 0 (before bone grafting) and group 1 (one month after bone grafting). This means that the trabecular bone increased but was still less than the normal side. In addition, there was no significant difference found in group 2 (2-4 months after bone grafting) and group 3 (5-7 months after bone grafting), which means the trabecular bone gradually increased in the 2-4 months and was similar to the normal bone within 5-7 months. It should be noted that the new bone formation with osteoid deposition indicated remodeling of 25-55% at 3 months postoperatively and the grafted bone had a denser structure than the control specimen from the iliac crest.14 The histomophometric analysis has shown that major bone remodeling can already be seen after 4-5 months.15 However, the pixel area presented a significant difference again in group 4 (8 or more months after bone grafting), which means the quantity of bone had decreased after eight months. Honma et al also reported that the grafted bone volumes one year after alveolar bone grafting were significantly reduced compared with 3 months after grafting using CT.16 Therefore, long-term follow-up is suggested to evaluate the trabecular bone at the bone grafting area in comparison to the side with normal bone. Dental radiographs may be used with the CAD system to evaluate the bone grafting area more easily than CT images and show cost-effectiveness.
The CAD system was developed based on mathematical morphology using MathWorks. The ROI can be controlled by using the same size and can be changed into binary images for calculating the pixel area that corresponds to the total number of pixels in the image. The CAD system could be useful for evaluating grafting failure, which would permit re-grafting before the eruption of the teeth and improve the prognosis of cleft lip and palate patients. Trindade et al8 and Jia et al17 showed 86% and 88% success rates, respectively, for the long term outcome of alveolar bone grafting in a UCLP group using the Bergland scale. However, their studies did not evaluate the success rate. A further prospective study would be required using this CAD system to support surgeons to determine the appropriate period for re-grafting or to explain the success of bone grafting compared with normal bone on the same image. The quantity of the pixel area might be useful for further and better treatment planning for artificial eruption in the cleft area.
In conclusion, based on the design of this study, alveolar bone grafting was similar to normal bone within 2-7 months postoperatively and our results suggest that the CAD system might be used to calculate the bone grafting quantity in UCLP patients.
 XML Download