Journal List > Imaging Sci Dent > v.42(3) > 1088911

Kim, Yi, Hwang, Choi, Lee, Heo, Huh, Kim, Hong, and Yoo: Development of 3D statistical mandible models for cephalometric measurements

Abstract

Purpose

The aim of this study was to provide sex-matched three-dimensional (3D) statistical shape models of the mandible, which would provide cephalometric parameters for 3D treatment planning and cephalometric measurements in orthognathic surgery.

Materials and Methods

The subjects used to create the 3D shape models of the mandible included 23 males and 23 females. The mandibles were segmented semi-automatically from 3D facial CT images. Each individual mandible shape was reconstructed as a 3D surface model, which was parameterized to establish correspondence between different individual surfaces. The principal component analysis (PCA) applied to all mandible shapes produced a mean model and characteristic models of variation. The cephalometric parameters were measured directly from the mean models to evaluate the 3D shape models. The means of the measured parameters were compared with those from other conventional studies. The male and female 3D statistical mean models were developed from 23 individual mandibles, respectively.

Results

The male and female characteristic shapes of variation produced by PCA showed a large variability included in the individual mandibles. The cephalometric measurements from the developed models were very close to those from some conventional studies.

Conclusion

We described the construction of 3D mandibular shape models and presented the application of the 3D mandibular template in cephalometric measurements. Optimal reference models determined from variations produced by PCA could be used for craniofacial patients with various types of skeletal shape.

Introduction

In modern surgical treatments, three-dimensional (3D) computed tomography (CT) plays a fundamental role in estimating the final treatment outcome and selecting the appropriate surgical intervention.1,2 Three-dimensional CT can provide precise and detailed information for the diagnosis of craniofacial structural problems and for the preoperative simulation of operations such as treatment of craniofacial anomalies and bone defects, and trauma surgery.3-6
Patients with distinct craniofacial deformities or missing bony structures require surgical reconstruction. In planning craniofacial surgical interventions, the symmetrical appearance in the frontal view and balanced facial profile in the lateral view as well as the functional aspects of the patient are important considerations. When those cannot be achieved by a mirror image of the unaffected contralateral side, a three-dimensional reference model of craniofacial bone is necessary to compare the pathologic conditions with a normal anatomy and finally to construct a harmonized facial appearance. Zachow et al7 developed a statistical 3D mandibular model from 11 different persons and used this model as a template for the planning of surgical reconstruction in cases of mandible deformities. Gateno et al8 reported that the computerized composite skull models were created and used for computer-aided surgical simulation in treatment of complex craniofacial deformities. There-dimensional medical modeling methods based on CT data have been widely used in planning orthognathic surgeries.9,10
3D cephalometric analysis is essential for the computerassisted planning of craniofacial surgical procedures, particularly in orthognathic surgery. The three-dimensional cephalometric parameters measured from 3D reconstructed images have been used in the diagnosis of facial asymmetry,11,12 in the simulation workbench for orthognathic surgery,13 and in the evaluation of postoperative changes of mandibular anatomy and position after orthognathic surgery.14 In those studies, the cephalometric parameters were averaged measurements from the individual reformatted 3D images, which only provided the specified parameters. Recent orthognathic surgical techniques and treatments require more advanced and complex information from diagnostic images.15 Three-dimensional cephalometric analysis providing optimal references for patients of various skeletal types would be useful for clinical application of computer-aided techniques in craniofacial surgery. The aim of this study was to provide sex-matched statistical shape models of the mandible, which would provide cephalometric parameters for 3D treatment planning and cephalometric measurements in orthognathic surgery. Three-dimensional statistical shape models of the mandible were developed using principal component analysis (PCA). The 3D cephalometric parameters were directly measured from the mean models and compared with those from other conventional cephalometric analyses.

Materials and Methods

The subjects consisted of 23 males (mean age, 24.7 years) and 23 females (mean age, 26.0 years) from our dental hospital. All subjects had Angle class I molar relationship without mandibular asymmetry recognizable to the naked eye. The CT images were obtained using a Somatom Sensation 10 (Siemens, Erlangen, Germany) with the same imaging condition (slice thickness: 0.75 mm, slice interval: 0.5 mm, 120 kVp, 100 mAs).
The development of the 3D statistical shape models of the mandible consisted of four steps: segmentation of the mandibles, construction of correspondence maps, alignment, and principal component analysis. In the segmentation step, the mandible was semi-automatically segmented from the 3D facial CT images by a dentist with clinical experience in the Department of Oral and Maxillofacial Radiology. The segmentation procedure included 3D thresholding, 2D region growing, 3D region growing, morphological operations, and contour tracking. After segmentation, the 3D individual mandible shape was reconstructed as a surface model with triangulated meshes. Smoothing and simplification of the meshes were applied to the shape model.
For construction of correspondence maps, each 3D mandible surface was decomposed into 8 corresponding patches in a symmetric manner (Fig. 1). Then, the mandible was split in half and subdivided through the lower central incisors. The condylar head, ramus, and mandibular body were separated on each side. The tooth region was excluded to separate variation in individual dentition. Then, each corresponding patch was mapped to a common disk using homeomorphic mapping under minimal geometric distortion. That is, it was parameterized to establish correspondence between different individual surfaces, which yielded the correspondence maps. The subdivided surfaces preserved all the topological properties of a disk while establishing correspondence maps.
In an alignment step, first, the shape with the highest number of mesh points was selected as the reference of the mandible shapes. Registration of a shape as a reference for all of the other shapes based on a rigid-body transformation was achieved by minimizing the sum of the squared distances between the corresponding points. After these processes, principal component analysis (PCA) was simultaneously applied to all the patches of the mandible by achieving continuity across patches using the common boundaries used for decomposition. All mandible shapes were represented as vectors in the 3N dimension (N, the number of reference mesh points). First, the mean shape was computed by averaging the vectors of all of the different shapes. Then, the characteristic models of variation were generated by a linear combination of the eigenmodes produced by PCA.7,16
The principal component analysis transformed a number of possibly correlated variables into a smaller number of uncorrelated variables called principal components. The PCA produced the eigenvalues (λ1≥λ2≥...≥λn≥0) and the corresponding eigenvectors (pi, i=1, 2, ..., n). Only the few first modes carried the most important information; therefore, each original shape was reconstructed using only some principal components. As a result, it was possible to represent as much variance contained in the training set as possible by as few parameters as possible.
First, the fundamental cephalometric parameters were measured from the mean models to evaluate the 3D shape models that had been developed. Eighteen landmarks according to the different viewing positions are explained in Table 1 and illustrated in detail in Figure 2. To compare the measurements with those from various viewing positions by other studies, multiple landmarks were selected for a single anatomical region. Using 3D measurement functions, two dentists directly measured 23 cephalometric parameters from male and female models, respectively. In comparable studies, the measurements were performed from the individual reformatted 3D images of the CT scan data. Therefore, the cephalometric parameters from these reports were averaged values of individual measurements. The nineteen parameters were compared with the results of Ahn et al,17 which were measured from the mandibles of 60 normal occlusion individuals (30 males and 30 females) for the diagnosis of facial asymmetry. The three parameters were compared with the results of Park et al,18 which were measured for the analysis of craniofacial morphology (16 males and 14 females). The nineteen parameters used for comparing with the results of Ahn et al17 are as follows:
  1. Ramus length: Cdsup_sup-Goinf_lat, Cdsup-sup-Goinf_inf, Cdsup-sup-Gopost_lat, Cdsup_sup-Gopost_post, Cdsup_sup-Aglat, Cdsup_sup-Aginf,

  2. Mandibular body length: Goinf_lat-Me_ant, Goinf_lat-Me_inf, Goinf_inf-Me_ant, Goinf_inf-Me_inf, Gopost_lat-Me_ant, Gopost_lat-Me_inf, Gopost_post-Me_ant, Gopost_post-Me_inf,

  3. Condylar neck length: Cdsup_sup-S,

  4. Gonial angle: ∠Cdpost_lat-Gopost_lat-Me_ant, ∠Cdpost_lat-Gopost_lat-Me_inf, ∠Cdpost_post-Gopost_post-Me_ant, ∠Cdpost_post-Gopost_post-Me_inf.

The three parameters compared with the results of Park et al18 are as follows:
  1. Ramus length: Cp-Go1+Go1-Go2

  2. Mandibular body length: Me-Go3+Go3-Go2

  3. Gonial angle: Cp-Go2-Me.

The one parameter compared with the results of Kim et al19 is as follows:
  1. Mandibular body length: Cd-Gn.

In the comparison with other studies, the statistical information we were able to obtain from the other studies only included the means of the measurements. Therefore, the most reasonable analysis was a simple comparison using the differences between the means. The means of the measurements by two observers differed from those of other studies.

Results

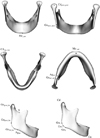
Male and female statistical mean models were created from each of the 23 individual mandibles. The male and female 3D statistical mean models are shown in Figure 3. The male and female characteristic shapes of variation produced by PCA are also shown in Figures 4 and 5, respectively. Figure 4 shows the reconstructed shapes by varying the first three modes of variation for the male mandibles. In the first row, the mode corresponding to the largest variance (λ1) is varied from -3√λ1 to 3√λ1, and in the second and the third row, the modes correspond to the second and the third mode, respectively. Figure 5 shows the reconstructed shapes by varying the first three modes of variation for female mandibles. The statistical shape models show the large variability included in the individual mandibles.
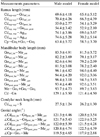
The cephalometric parameters were calculated as the average of measurements determined by two dentists using the mean models. The results from the male and female mean models are shown in Table 2. All the cephalometric parameters measured in the male were greater than those in the female except ∠Cdpost_lat-Gopost_lat-Me_inf and ∠Cdpost_post-Gopost_post-Me_inf of the gonial angles. The differences between measurements from the male mean model and the results of Ahn et al17 were 0.7-4.3 mm at the ramus length, 0.3-4.1 mm at the mandibular body length, and 0° -1.7° at the gonial angle. In the female model, the differences were 1.7-2.7 mm at the ramus length, 0.2-2.4 mm at the mandibular body length, 0.2 mm at the condylar neck length, and 1.9° -3.4° at the gonial angle (Figs. 6-8). The differences between measurements from the male model and the results of Park et al18 were 3.1 mm at the ramus length, 2.0 mm at the mandibular body length, and 0.7° at the gonial angle. In the female model, the difference values were 7.5 mm at the ramus length, 0.5 mm at the mandibular body length, and 6.4° at the gonial angle (Figs. 6-8). The difference between measurements from the male model and the results of Kim et al19 was 0.7 mm at the mandibular length. In the female model, the difference was 0.2 mm (Fig. 7). The results from the developed models were very close to those from other conventional studies.

Discussion

In cases of craniofacial malformations and acquired defects, the defected and malformed structures are reconstructed based on normal anatomic structures. When the affected structures are not complex, the affected half of the structure can be replaced by a mirror image from the unaffected side.12 However, in complex cases, the reconstruction cannot be guided by mirror images of the unaffected side. A surgeon must compare the pathologic situation with a mental image of normal anatomy.20 In those cases, a 3D optimal shape model can be used as a reference template for the anatomical region. The shape models of variation that we developed would be able to serve as 3D templates for the reconstruction of missing or malformed mandible structures.
The 3D cephalometric analysis is essential for computer-assisted planning and interventions in orthognathic surgery. Three-dimensional CT measurements have been applied in treatment of craniofacial malformations and acquired defects, as a planning tool for the skull base reconstructive surgery,21 for surgical planning of head and neck cancer,22 and for 3D landmark measurement in craniofacial surgery planning.23 The collected CT data has been sorted and classified according to sex and age to serve as sex- and age-dependent norm data, which can be used as a basis for virtual patient-specific operation planning and simulation.20 While the cephalometric parameters are averaged measurements from individual reformatted 3D images in those studies, the 3D cephalometric parameters can be measured from the mean models directly in this study.
The cephalometric parameters measured from the mean models were compared with those of other previous studies to evaluate the 3D mandible models that we developed. The differences in the male model were 0.3-4.3 mm in length and 0° -1.7° in angle, and the differences in the female model were 0.2-2.7 mm in length and 1.9° -3.4° in angle. The data measured from the models were very close to those from other conventional studies. The differences in the sample composition and measurement methods might explain the differences. In order to compare with other studies that only provided a specified number of parameters, 23 parameters were measured from the mean models that we developed. Since the developed shape models can be observed and cephalometric parameters can be conveniently measured from any direction, it is possible to provide more diversity in the 3D cephalometric measurements. Therefore, other cephalometric measurements can be performed to apply diverse 3D cephalometric parameters in maxillofacial surgery planning and orthodontic treatments. In this study, the cephalometric parameters were only measured on the right side of the mandible. The measurements on both sides of the mandible models can be performed to evaluate the mandibular asymmetry in further studies. The mean models developed in this study are not sufficient to be called the standard model for the time being. By including more normal mandible CT data in developing the mean models, the models will more accurately approximate the Korean normal 3D mandible. The measured parameters will also approach the standard value of the Korean norm.
Optimal reference models for patients can be determined from the variation models that best match the measurements from the healthy part of the mandible. New cephalometric parameters can be measured based on the evaluation of skeletal landmarks on the models of variation produced by PCA. These parameters will be useful in the diagnosis, surgical planning, and follow-up after surgery of craniofacial patients with various types of skeletal shape.
When a surgeon plans computer-aided craniofacial surgery, it is generally necessary to segment and reconstruct the individual mandible of patients from 3D CT images. The streak artifact caused by the metal restorations in teeth is a frequently encountered problem with 3D CT maxillofacial imaging. The editing process to delete the metal artifacts from each axial slice of the image is very timeconsuming and labor-intensive. This statistical shape model can be used for automatically segmenting the 3D anatomical structures.16 The model-based segmentation using a 3D mean shape model can provide more efficient segmentation of the mandible in dental clinics. For developing the 3D shape model, we used the method of patch decomposition and parameterization to establish correspondence between the different individual surfaces and principal component analysis to yield mean and variation shapes. The same method and analysis could also be applied to develop other statistical 3D mean models such as for the maxilla, zygomatic bone, and teeth.
We described the construction of 3D mandibular models and presented the application of the 3D mandibular template in 3D cephalometric measurements. Optimal reference models determined by the variations produced by PCA can be used for craniofacial patients with various types of skeletal shape. Due to the recent widespread increase in the use of cone beam CT, the acquisition of 3D craniofacial data is no longer difficult. As a result, the demand for standardized 3D models will also increase in dental clinics.

Figures and Tables

Fig. 1
Decomposition of 3D mandible shape for the construction of correspondence maps.
isd-42-175-g001
Fig. 2
Established landmarks for 3D cephalometric measurements in different viewing positions.
isd-42-175-g002
Fig. 3
Male and female 3D statistical mean models (left: male, right: female).
isd-42-175-g003
Fig. 4
Characteristic models of variation produced by PCA for male mandibles. The mode corresponding to the largest variance (λ1) is varied from to -3√λ1 to 3√λ1 (the first row), and the modes corresponding to the second mode (the second row) and the third mode (the third row).
isd-42-175-g004
Fig. 5
Characteristic models of variation produced by PCA for female mandibles. The mode corresponding to the largest variance (λ1) is varied from to -3√λ1 to 3√λ1 (the first row), and the modes corresponding to the second mode (the second row) and the third mode (the third row)
isd-42-175-g005
Fig. 6
Comparison of ramus lengths from the developed models with Ahn et al17 and Park et al.18
isd-42-175-g006
Fig. 7
Comparison of mandibular body lengths from the developed models with Ahn et al,17 Park et al,18 and Kim et al.19
isd-42-175-g007
Fig. 8
Comparison of gonial angles from the developed models with Ahn et al17 and Park et al.18
isd-42-175-g008
Table 1
Landmarks used for 3D cephalometric measurements in different viewing positions
isd-42-175-i001
Table 2
Cephalometric measurement results from the male and female mean models
isd-42-175-i002

Notes

This work was supported by the Industrial Strategic Technology Development Program (10038695) funded by the Ministry of Knowledge Economy (MKE, Korea).

References

1. Franca C, Levin-Plotnik D, Sehgal V, Chen GT, Ramsey RG. Use of three-dimensional spiral computed tomography imaging for staging and surgical planning of head and neck cancer. J Digit Imaging. 2000; 13:24–32.
crossref
2. Elolf E, Tatagiba M, Samii M. Three-dimensional computed tomographic reconstruction: planning tool for surgery of skull base pathologies. Comput Aided Surg. 1998; 3:89–94.
3. Troulis MJ, Everett P, Seldin EB, Kikinis R, Kaban LB. Development of a three-dimensional treatment planning system based on computer tomographic data. Int J Oral Maxillofac Surg. 2002; 31:349–357.
4. Kragskov J, Sindet-Pedersen S, Gyldensted C, Jensen KL. A comparison of three-dimensional computed tomography scans and stereolithographic models for evaluation of craniofacial anomalies. J Oral Maxillofac Surg. 1996; 54:402–412.
crossref
5. Cheng AC, Wee AG. Reconstruction of cranial bone defects using alloplastic implants produced from a stereolithographically-generated cranial model. Ann Acad Med Singapore. 1999; 28:692–696.
crossref
6. Kermer C, Lindner A, Friede I, Wagner A, Millesi W. Preoperative stereolithographic model planning for primary reconstruction in craniomaxillofacial trauma surgery. J Craniomaxillofac Surg. 1998; 26:136–139.
crossref
7. Zachow S, Lamecker H, Elsholtz B, Stiller M. Reconstruction of mandibular dysplasia using a statistical 3D shape model. Int Congr Ser. 2005; 1281:1238–1243.
crossref
8. Gateno J, Xia JJ, Teichgraeber JF, Christensen AM, Lemoine JJ, Liebschner MA, et al. Clinical feasibility of computer-aided surgical simulation (CASS) in the treatment of complex craniomaxillofacial deformities. J Oral Maxillofac Surg. 2007; 65:728–734.
9. D'Urso PS, Barker TM, Earwaker WJ, Bruce LJ, Atkinson RL, Lanigan MW, et al. Stereolithographic biomodelling in craniomaxillofacial surgery: a prospective trial. J Craniomaxillofac Surg. 1999; 27:30–37.
10. Mavili ME, Canter HI, Saglam-Aydinatay B, Kamaci S, Kocadereli I. Use of three-dimensional medical modeling methods for precise planning of orthognathic surgery. J Craniofac Surg. 2007; 18:740–747.
11. Hwang HS, Hwang CH, Lee KH, Kang BC. Maxillofacial 3-dimensional image analysis for the diagnosis of facial asymmetry. Am J Orthod Dentofacial Orthop. 2006; 130:779–785.
12. Xia J, Ip HH, Samman N, Wang D, Kot CS, Yeung RW, et al. Computer-assisted three-dimensional surgical planning and simulation: 3D virtual osteotomy. Int J Oral Maxillofac Surg. 2000; 29:11–17.
crossref
13. Xia J, Samman N, Yeung RW, Shen SG, Wang D, Ip HH, et al. Three-dimensional virtual reality surgical planning and simulation workbench for orthognathic surgery. Int J Adult Orthodon Orthognath Surg. 2000; 15:265–282.
crossref
14. Cevidanes LH, Bailey LJ, Tucker GR Jr, Styner MA, Mol A, Phillips CL, et al. Superimposition of 3D cone-beam CT models of orthognathic surgery patients. Dentomaxillofac Radiol. 2005; 34:369–375.
15. Katsumata A, Fujishita M, Maeda M, Ariji Y, Ariji E, Langlais RP. 3D-CT evaluation of facial asymmetry. Oral Surg Oral Med Oral Pathol Oral Radiol Endod. 2005; 99:212–220.
16. Lamecker H, Zachow S, Wittmers A, Weber B, Hege HC, Elsholtz B, et al. Automatic segmentation of mandibles in lowdose CT data. Int J Comput Assist Radiol Surg. 2006; 1:suppl 1. 393–395.
crossref
17. Ahn JS, Lee KH, Hwang HS. A study on the 3-D standard value of mandible for the diagnosis of facial asymmetry. Korean J Orthod. 2005; 35:91–105.
crossref
18. Park SH, Yu HS, Kim KD, Baik HS. A proposal for a new analysis of craniofacial morphology by 3-dimensional computed tomography. Am J Orthod Dentofacial Orthop. 2006; 129:600.e23–600.e34.
crossref
19. Kim KH, Choy KC, Kim HG, Park KH. Cephalometric norms of the hard tissues of Korean for orthognatic surgery. J Korean Assoc Oral Maxillofac Surg. 2001; 27:221–230.
crossref
20. Brief J, Hassfeld S, Dauber S, Pernozzoli A, Munchenberg J, Redlich T, et al. 3D norm data: the first step towards semiautomatic virtual craniofacial surgery. Comput Aided Surg. 2000; 5:353–358.
21. Eufinger H, Wehmoller M, Machtens E, Heuser L, Harders A, Kruse D. Reconstruction of craniofacial bone defects with individual alloplastic implants based on CAD/CAM-manipulated CT-data. J Craniomaxillofac Surg. 1995; 23:175–181.
22. Brooks SL. Computed tomography. Dent Clin North Am. 1993; 37:575–590.
crossref
23. Cavalcanti MG, Haller JW, Vannier MW. Three-dimensional computed tomography landmark measurement in craniofacial surgical planning: experimental validation in vitro. J Oral Maxillofac Surg. 1999; 57:690–694.
crossref
TOOLS
ORCID iDs

Tae-Il Kim
https://orcid.org/http://orcid.org/0000-0003-4087-8021

Similar articles