

 PDF
PDF ePub
ePub Citation
 Print
Print


Introduction
Since Mandelbrot announced the concept of the fractal geometry,1 fractal analysis has been adapted to study the various natural structures and biosignals. It has been used to interpret and express such biological phenomena as arterial trees,2 nervous system,3 electric conductivity of heart,4 and EEG.5 In the field of dentistry, there have been many attempts to analyze and predict the structure of jaw trabecular bone using the fractal analysis for the evaluation of osteoporosis6-14 and for the detection of the periodontal disease.15,16 Fractal analysis of the bone trabecular structure has proven to be efficient in analyzing the bone quality in clinical applications.17,18
Tile-counting method has been commonly used for the fractal analysis of the jaw bone trabecular structure,6,10,19-21 which was not a true fractal object but natural structure. The fractal dimensions from the jaw bone show variations according to the interpretation of results from the tile counting method. One of the reasons might be that selecting the range of tile sizes greatly could influence on the final fractal dimension. Therefore, it is important to determine the optimal range of tile size in order to obtain a more truthful fractal dimension of the natural structure. A proper range of scales was suggested to analyze the trabecular structure in the histological section of cancellous bone.22-29 The purpose of this study was to determine the optimal range of tile size in using the tile-counting method for radiographs of the human jaw bone.
Materials and Methods
Acquisition of digital radiographs
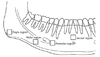
The digital radiographs were acquired using a Heliodent DS intraoral X-ray system (Sirona Dental System Gmbh, Bensheim, Germany) and a direct imaging sensor (Schick Technologies Inc, Long Island, NY, USA). They were taken from 29 human dry mandibles without any disease. Each mandible was fixed using a special positioning device. Buccal cortex was located perpendicular to the central ray and the distance between X-ray source and buccal cortex was fixed at 40 cm. The digital imaging sensor was placed under the mandible and parallel with the buccal cortex. The images were acquired from the angle, molar, and premolar regions on both sides and an incisor region of the mandible (Fig. 1). The images were taken using the system setup with cone operating at 70 kVp, 7 mA and with exposure time of 0.24 seconds for the angle regions, 0.36 for the molar, 0.24 for the premolar and 0.16 for the incisor. A total of 203 digital images (29 mandibles×3 regions×2 sides and 29 mandibles×1 region) with 862 by 574 pixels of 256 gray levels were analyzed. Each pixel size equated to 41.4 µm and 47.6 µm, respectively.
Preprocessing of images and calculation of morphometric parameters
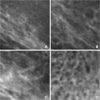
Four regions of interests (ROIs) as a rectangular window were established in the identical anatomic locations for all mandibles. The ROI was set adjacent to the inferior cortex of the mandibular angle for the angle region, to the inferior cortex under the first molar for the molar, to the medial side of mental foramen for the premolar, and above the mental ridge for the incisor region (Fig. 2).
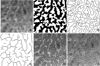
A macro codes for the image analysis was developed for this study using Scion Image, an application program for image processing (Scion Corp, Frederick, Maryland, USA). To extract the trabecular bone patterns, the ROI image was first made binary using the algorithm described by Geraets et al30,31 and White et al.32 The image was blurred using a Gaussian filter to remove large-scale variations on the image. The blurred image (low-pass filtered image) was then subtracted from the original image, and 128 gray levels were added to each pixel of the subtraction image. The binary image was obtained by thresholding on a gray level of 128, which segmented the image into the bone (gray level of 255) and marrow (gray level of 0). The outline and skeletonized image were extracted from the binary image by mathematical morphologic operators.
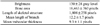
Four morphometric parameters were calculated to represent the structural characteristics of the trabecular bone, which were bone area, length of skeletal structure, mean length of branch, and mean trabecular thickness. The number of black pixels in the binary image was regarded as the bone area. The length of skeletal structure was defined as the number of black pixels in the skeletonized image. From the skeletonized image, the nodes and terminals were found using a kernel of 3 by 3 pixels. The pixel with more than 3 branches was regarded as a node and the pixel with one branch as a terminal. The mean length of branches was calculated from the branches having a nod and a terminal at their ends. Mean trabecular thickness was obtained as the bone area divided by the length of skeletal structure.
Fractal dimension by modified tile counting method
The fractal dimension (FD) by tile counting method can be obtained by the classical fractal geometry theory. In the modified tile counting method, the number N of tiles containing any part of the structure is related to the edge length of the tile (ε) or scale (Eq. 1).30 A straight line (Richardson plot) is obtained by taking the logarithm of N versus the logarithm of the inverse scale (1/ε). The slope (D) of the linear portion of the curve is determined to the FD (Eq. 2). This FD gives the fractal information reflecting the spatial characteristics of the trabecular bone. The thickness of the tile edges is set to zero so that none of the pixels forming the structure are obscured by the edge lines.


This study applied the tile counting method to the outline image using the edge length of the tile from 1 to 49 pixels. The results were analyzed by SPSS program (ver. 8.0, SPSS Inc, Chicago, IL, USA) using the following statistics. The ANOVA test was performed among the local slopes of the Richardson plot for four anatomical regions. The bivariate correlation test was also performed between local slopes in various ranges of tile sizes.
Results
Four ROIs as 180 by 180 pixels (7.92 by 7.92 mm) were extracted in the identical locations for all mandibles (Fig. 1). Fig. 2 represents the examples of the ROI image from the four regions. These images were blurred with a Gaussian filter with a sigma of 10 pixels and a kernel size of 31 by 31 pixels. The outline and skeletonized image for fractal analysis were obtained by the mathematical morphologic operators (Fig. 3).
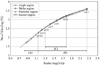
Fig. 4 shows the mean Richardson plots after applying the tile counting method to the outline images using the edge length of the tile from 1 to 49 pixels. This represents the mean number of the tiles containing any part of the outline against the edge length of the tile in 4 anatomical regions. All Richardson plots show lines with a little curvature. They present relations between the size of bone trabecular structure and the edge length of tiles. The selected tile sizes from 1 to 49 pixels were sufficient to provide the fractal dimension of the trabecular structure from the ROI of 180 by 180 pixels.
In large tile sizes, the Richardson plots show the line with a slope of 2 as all the tiles contain any part of the outline. The resultant data from this range do not contain any information about the bone trabecular structure. When the tile size was larger than 13 pixels (range (A) in Fig. 4), the number of tiles containing the outline coincided with the total number of tiles. Therefore, the slopes of Richardson plots for tile sizes not larger than 13 pixels were considered for analysis. We divided it into 6 ranges of scales 1-3, 3-5, 5-7, 7-9, 9-11, and 11-13 pixels (range (B) in Fig. 4) for the sake of convenience. When all the ranges are considered, the same result will be obtained as in Richardson plots in Fig. 4.
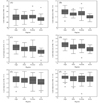
Fig. 5 shows the box plots of the local slopes for the ranges. The ANOVA test for 4 anatomical regions was performed among the local slopes in all the ranges considered. In 3 ranges of 3-5 to 7-9 pixels (range (C) in Fig. 4), the slopes of the angle and the incisor region respectively showed statistically significant differences with the molar and premolar region (p<0.05). In all ranges, the slopes between the molar and premolar regions did not show any statistically significant difference.
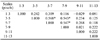
Theoretically, the Richardson plot exhibits a perfect straight line in all ranges of scales. In the ranges, the local slopes must show a positive correlation between ranges. The slopes from these ranges provide the fractal dimension which is significant in finding out the structures of the trabecular bone. We performed the bivariate correlation tests between local slopes in various ranges of scales. The Pearson correlation value between local slopes was over 0.5 in 3 ranges of 3-5 to 7-9 pixels in Table 2. From these results, the range of scales significant for the fractal dimension was determined as ranges from 3 pixels (0.132 mm) to 9 pixels (0.396 mm). The upper level of the scales was very similar to the mean trabecular thickness (9.25 pixels). The means of morphometric parameters from 203 ROIs are summarized in Table 1.
In the range of 3-9 pixels, the fractal dimensions for the 4 anatomical regions were calculated by a linear regression. The dimensions of the trabecular bone structure were 1.45±0.05 at the angle, 1.40±0.06 at the molar, 1.42±0.07 at the premolar, and 1.34±0.04 at the incisor region. The angle and the incisor region showed statistically significant difference with the molar and premolar region (p<0.05). However, the fractal dimensions between the molar and premolar region showed no statistically significant difference. The angle region showed significantly the largest fractal dimension and the incisor region showed the least. This is caused by the different bone trabecular structure at each region. It can be verified by the examples of the ROI image from the 4 regions in Fig. 2. The image of an angle region shows a thin and complex trabecular structure (Fig. 2A). On the other hand, the incisor region shows a thick and simple trabecular structure (Fig. 2D). The molar and the premolar region are in the middle of the two (Figs. 2B and C). This difference in the shape of trabecular structure is related with physical properties of the bone.
Discussion
Fractal dimension of the trabecular bone structure has been proven to have evident correlation with the physical property of the bone in many studies.6-23 However, the fractal dimensions from these studies showed large variations even in the same anatomical region as in the jaw bone of 1.26 to 2.682.12-14,17,20,30 These variations were mainly caused by the problems of the fractal analysis itself rather than by different materials used in each study. Cha et al19 and Geraets et al30 mentioned that 'different method', 'fitting a straight line', 'noise sensitivity' and 'standardization of filming method and exposure' were the problems in applying the fractal analysis to clinical applications. The problem of 'fitting a straight line' is caused by selecting the proper range of scales providing data for the least squares of the linear regression. True fractal objects have the property of self-similarity over all possible range of scales. On the other hand, natural fractal structures show the self-similarity in a limited range of scales. As a result, the Richardson plot represents a true slope or fractal dimension in the specified ranges of scales. Paumgartner et al,22 Caligiuri et al,23 and Parkinson et al24 stated that even though the natural structure had the fractal characteristics, it was not true mathematical fractal geometry but it well conformed with the fractal behavior in the specific range of scales. Eventually, the Richardson plot from the natural structure showed straight line only in one or some of specific range of scales. The range exhibiting true self-similarity was influenced by the structural and functional properties of the analyzed structure.
It is imperative to determine the range of scales showing the true fractal dimension in the Richardson plot. In our results, the Richardson plots showed the lines with a little curvature over the scales considered. In the lower ranges of scales, the true fractal dimension was subjected to restriction by the limitation of resolution and increased influence of high frequency noise. In the higher ranges, it was influenced by the rough structural features of the object. As all the tiles would contain any part of the outline in the higher ranges, the slopes of Richardson plot converge on 2 gradually. In this study, all the tiles with the scale of over 13 pixels contained any part of the outline. Therefore, the local slopes from the scales of 1 to 13 pixels were analyzed. In the range of scales from 3 to 9, the slopes of the angle and the incisor region showed statistically significant differences with the molar and premolar region. In the correlation test between the local slopes of various scales, only those from the scales of 3 to 9 pixels represented values over 0.5. Finally, we determined the significant upper level of the scale as 0.396mm(9 pixels), the lower level as 0.132 mm (3 pixels), and the range as 0.308 mm (7 pixels) to provide the fractal dimension in finding out the structures of the trabecular bone. The scales determined as significant are closely related to the morphometric parameters. The mean length of branch of 12.2±1.71 pixels almost coincides with the maximum scale at which the number of tiles containing any part of the outline differs from the total number of tiles. The mean trabecular thickness of 9.3±1.1 pixels almost coincides with the significant upper level of scales.
In a study of histological sections of the trabecular bone, Parkinson et al24 suggested three sectional fractal dimensions for the trabecular bone, which was multifractal as fractal one, two, and three. The fractal one was estimated from tile sizes ranging from 0.025 to 0.15-0.35 mm, the fractal two from 0.15-0.35 to 0.5-1 mm, and the fractal three from 0.5-1.0 to 4.25 mm. The range of the fractal one encompassed the size range of resorption pits. The dimension of the fractal one described the surface texture of individual trabeculae. The range of fractal two encompassed the size range of individual trabecular elements, and this fractal described the shape or form of trabeculae. The range of fractal three encompassed several structural units of the cancellous architecture, and this fractal described the overall spatial arrangement of cancellous bone. The significant range of scales by ours conforms partly to those of the fractal one and two respectively, although our object of study (from jaws) was different from that by Parkinson et al (from femoral head and iliac crest). The shape of the trabecular bone structure has been known to be different according to the anatomical regions. The fractal dimension from the significant range of scales can describe more exactly the shape of trabeculae in the jaw bone from digital intraoral radiographs.
In the image processing for fractal analysis, it is important to remove the low frequency noise from the radiographs. The mandible regions are surrounded by cortical bone and soft tissue with various thicknesses. They influence the mean gray level significantly and exhibit a low frequency noise. To remove the noise, we subtracted the blurred image obtained by Gaussian filtering, a kind of low pass filtering, from the original image. If the sigma value (standard deviation) of Gaussian filer increases, more of low frequency noise is removed from the image. The proper sigma value of Gaussian filter may differ according to the image resolution, size of object to be analyzed, or quality and quantity of the noise. After adding 128 gray levels to the subtraction image, a standardized image was obtained for the fractal analysis.
In dental clinics, the fractal analysis of trabecular bone structure of jaws using digital intraoral radiographs can be used in evaluating pathological bone change and pre-implant bone quality. It can be an inexpensive and convenient screening tool for the diagnosis of general diseases accompanying various bone changes. The important prerequisites for fractal analysis are to standardize the acquisition and processing of images and to determine the fundamental and significant range of scales in the Richardson plot. We determined the significant range of scales for the fractal dimension to describe more exactly the shape of trabeculae in the jaw bone from digital intraoral radiographs processed by the automated image processing.
 XML Download