

 PDF
PDF ePub
ePub Citation
 Print
Print


INTRODUCTION
Lower urinary tract symptoms and benign prostatic hyperplasia (LUTS/BPH) are common conditions, particularly in elderly men, that negatively impact patients' quality of life (QOL) [123]. Various factors including sensory bladder disorders, detrusor overactivity, and sphincteric weakness can provoke LUTS [45]. Many urologists and physicians believe that LUTS can also be affected by seasonal variation and, in particular, get worse in cold weather. This phenomenon has several explanations. The increased sympathetic activity caused by cold stress can stimulate the contraction of smooth muscle within the prostate [67]. In addition, cold stress detrusor overactivity and causes a decrease in the voiding interval and voiding volume [89].
However, there have been only a few clinical studies that have addressed the relationship between seasonal variation and LUTS/BPH symptoms, and their results are contradictory [101112]. A community-based study designed by Yoshimura et al [10] revealed that winter was an independent risk factor for urinary frequency and urgency and nocturia. However, Cartwright et al [12] reported no significant variation in urinary symptom scores and uroflowmetric parameters with changes in season. Meanwhile, Watanabe et al [11] demonstrated that maximum urine flow rate (Qmax) could be influenced by seasonal changes in temperature but reported no seasonal difference in urinary symptom scores. To further elucidate the impact of seasonal variation on urinary symptom scores and uroflowmetric parameters, we report the results of an analysis of seasonal effects in Korean men with LUTS/BPH who were selected from a large population database.
MATERIALS AND METHODS
1. Patients
A retrospective analysis was performed using a database of 1,392 consecutive patients with LUTS/BPH who visited the outpatient clinic at Severance Hospital from March 2010 to February 2014. The patients' records were reviewed and individual medical histories were obtained. We excluded patients who had the following conditions: (1) neurologic disease that could affect voiding symptoms, (2) current urinary tract infection, (3) previous history of radiotherapy of the pelvis, (4) clinically apparent bladder or prostate cancer, and (5) uncontrolled diabetes mellitus. A total of 1,185 patients were suitable for the final analysis. Gangnam Severance Hospital Institutional Review Board approved this study protocol.
2. Lower urinary tract symptoms and uroflowmetry
The urinary symptoms of the patients were assessed based on the International Prostate Symptom Score (IPSS) and QOL scores. The total IPSS score was subcategorized into voiding and storage symptom subscores [13]. Uroflowmetry (Urodyn+; Mediwatch UK, Ltd., Ruby, UK) was performed, and postvoid residual volume (PVR) was measured using a bladder scanner (BioSon-500; MCube Tech, Seoul, Korea). These measurements were repeated if the voided volume was <125 mL.
3. Transrectal ultrasonography
All the subjects underwent transrectal ultrasonography using a Prosound Alpha 5 SV (Hitachi Aloka, Tokyo, Japan) between April 2010 and November 2012 or a Pro Focus 2202 Ultrasound System (BK-Medical, Herlev, Denmark) between December 2012 and February 2014. The total prostate volume (TPV) and transitional zone volume (TZV) were calculated using the prostate ellipsoid formula (height×width×length×π/6). The transitional zone index (TZI) was calculated according to the formula TZI=TZV/TPV. Prostate-specific antigen (PSA) was measured using a chemiluminescent enzyme immune assay.
4. Climate data
Climate data from the study period in South Korea (38°N, 127° 30' E) were extracted from the Korea Meteorological Administration, and mean monthly temperatures for South Korea were calculated.
5. Statistical analysis
Statistical comparisons of the clinical features of the subjects were carried out using one-way analysis of variance (ANOVA) followed by two-sided Tukey's and Student's t-tests. All statistical analyses were performed using IBM SPSS ver. 20.0.0.2 (IBM Co., Armonk, NY, USA). A p value of <0.050 was considered statistically significant.
RESULTS
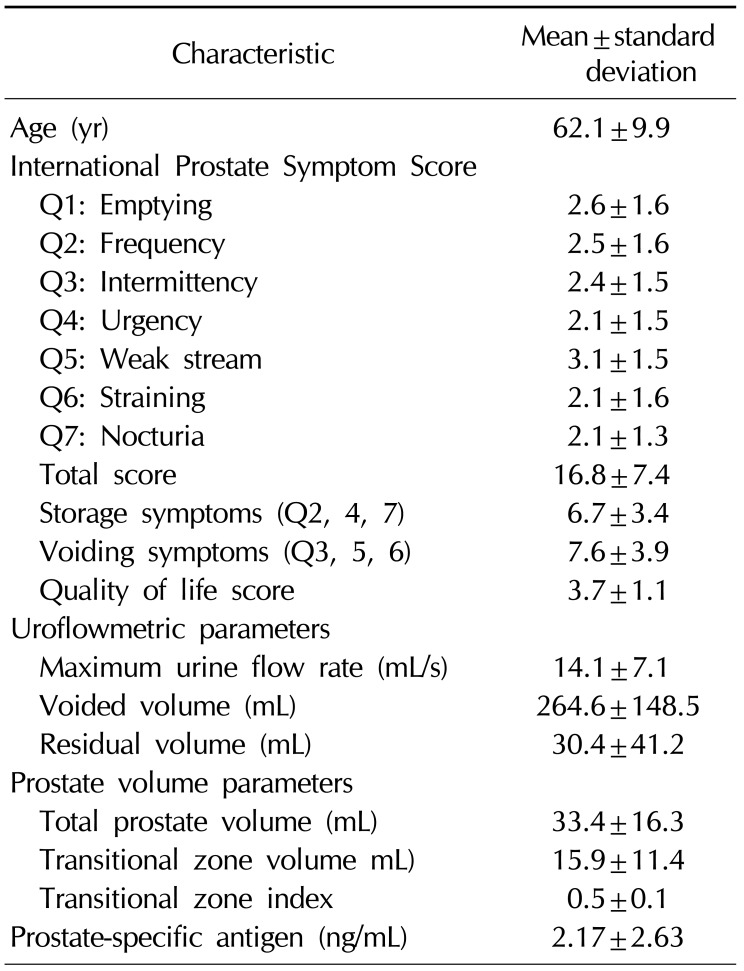
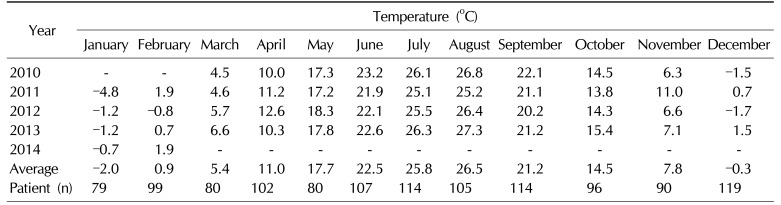
Mean values for patient age, Qmax, PVR, TPV, PSA, and total IPSS are shown in Table 1 along with details of the IPSS score and other patient characteristics. The mean monthly temperatures were obtained between March 2010 and February 2014 (Table 2). The four coldest months were January, February, March and December, the four hottest months were June, July, August, and September, and the intermediate months were April, May, October, and November. Patients were categorized into one of these three seasonal groups depending on the mean temperature of the month during which the patient first visited our outpatient clinic. There were 377, 440, and 369 patients in the cold, hot, and intermediate season groups, respectively. There was no statistically significant difference in patient age among the three groups.
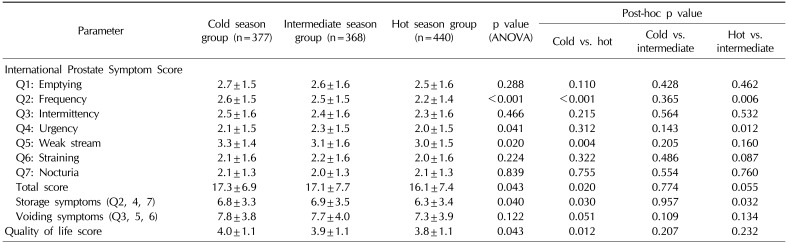
The comparisons of symptom scores are shown in Table 3. A significant difference in total IPSS score (p=0.020) was noted only between the cold (17.3±6.9) and hot season groups (16.1±7.4). Significant differences between the cold and hot season groups were noted in the IPSS subcategories of frequency (2.6±1.5 vs. 2.2±1.4, respectively; p<0.001) and weak stream (3.3±1.4 vs. 3.0±1.5, respectively; p=0.004), with the symptoms worse in the cold season group. Significant differences were also noted between the intermediate and the hot season groups in the IPSS subcategories of frequency (2.5±1.5 vs. 2.2±1.4, respectively; p=0.006) and urgency (2.3±1.5 vs. 2.0±1.5, respectively; p=0.012), with the symptoms worse in the intermediate season group. Storage symptom scores were significantly worse in the cold (6.8±3.3, p=0.030) and intermediate season groups (6.9±3.5, p=0.032) compared with those in the hot season group (6.3±3.4). There was no difference in voiding symptom scores between the three season groups. The QOL score showed a significant difference only between the cold and the hot season groups (4.0±1.1 vs. 3.8±1.1, respectively; p=0.012).
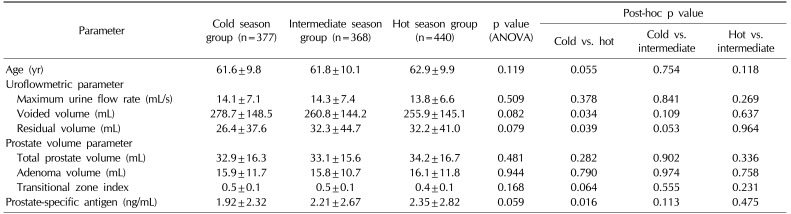
When comparing the uroflowmetric parameters (Table 4), there was no significant variation in Qmax between the three season groups. However, a significant difference (p=0.034) in voided volume between the cold season (278.7±148.5 mL) and the hot season group (255.9±145.1 mL) was noted. Similarly, there was a significant difference (p=0.039) in residual volume between the cold season group (26.4±37.6 mL) and the hot season group (32.2±41.0 mL). Prostate volume parameters showed no significant variation between the three season groups (Table 4).
DISCUSSION
Our study revealed that seasonal variation might be associated with the severity of symptoms in LUTS/BPH patients. Several explanations have been offered for similar results in previous studies. For example, due to the reduced diuresis resulting from insensible fluid loss from sweating in hot weather, urinary frequency could be increased in cold seasons compared to hot seasons [14]. Similarly, peripheral vasoconstriction provoked by body cooling inhibits the secretion of vasopressin and leads to diuresis [15]. Another reason could be that cold stress increases sympathetic nervous system activity, which could cause the contraction of smooth muscle in the prostate, which in turn could lead to an aggravation of LUTS [67]. Furthermore, cold exposure stimulates the secretion of plasma atrial natriuretic peptide, which might contribute to the diuresis frequently observed in the cold [16]. In support of this idea, cold stress is known to provoke detrusor overactivity and cause a decrease in the voiding interval and voiding volume in many animal models [8917].
Despite these possible, yet variable reasons, the etiology of seasonal variation of LUTS/BPH symptoms is not yet fully understood and there are only a few clinical studies that have reported results on the relationship between seasonal variation and symptoms in LUTS/BPH patients. A large cohort study performed in Japanese patients to uncover the relationship between climate and LUTS demonstrated that frequency, urgency, and nocturia were significantly different between summer and winter groups [10]. However, despite the large study population, this study was only questionnaire-based, and the authors focused mainly on storage symptoms instead of all LUTS. Another study, conducted in the UK, examined the effect of seasonal variation on IPSS scores and uroflowmetry parameters in 296 men with LUTS [12]. With the exception of an increase in the median actual nightly voids over the summer months, there was no significant association between IPSS and uroflowmetric parameters and seasonal or mean monthly temperatures. A similar smaller study, performed to examine seasonal changes in IPSS and uroflowmetric parameters in 31 LUTS patients in Japan, showed that there were no significant seasonal differences in IPSS. However, among uroflowmetric parameters, the Qmax was significantly higher in the winter than in the summer months [11].
In our study, we collected data from a large pool of LUTS/BPH patients and used both objective and subjective measurements of urinary symptoms, including IPSS and uroflowmetric parameters. As expected, the severity of symptoms as measured by the IPSS was worse in the cold season group compared with the hot season group. This result was mainly driven by the differences in the storage symptoms, especially the frequency and the weak stream categories, which showed significantly higher scores in the cold season group compared with the hot season group. There are some subcategory results that we cannot entirely explain. For example, the urgency was highest in the intermediate season group rather than in the cold season group, and was significantly different only between the hot and intermediate season groups. The QOL score was higher in the cold season group compared with the hot season group, which could lead to the assumption that cold weather creates a negative impact on the patient's lifestyle. Uroflowmetric parameters showed significant differences only between the cold and the hot season groups.
Before designing our study, we assumed that we would observe a lower voided volume in the cold season due to the aggravation of frequency. Interestingly, however, voided volume was significantly higher in the cold season group. A possible explanation for this result is that increased insensible fluid loss, including massive sweating, in the hot season group might have influenced the amount of urine formation and resulted in a decrease in voided volume. On the other hand, the residual volume was higher in the hot season group. This result might be explained by the assumption that during colder seasons, frequent voiding due to detrusor overactivity and increased diuresis plays a greater role in the voiding mechanism than does the contraction of smooth muscle tone within the prostate.
In our study, serum PSA levels showed seasonal variation and were higher in the hot season group. Previous reports suggest that seasonal variation can affect the serum PSA level, although the results are somewhat controversial. Simşek et al [18] showed that the mean serum PSA level in the spring showed a higher value when compared with winter, fall, and summer mean levels. However, some studies show that seasonal variation is not correlated with the serum PSA level [1920]. Because of these contradictory results and the unknown etiology of variations in PSA levels, a more careful approach and follow-up should be considered when treating LUTS/BPH patients.
Our study had several limitations. Each patient was assessed only once, at different times of the year, and the results were obtained from a heterogeneous cohort. It is possible that repeated assessments of the same patient during different seasons would have shown more reliable outocomes. In addition, we made our assessment using only the monthly average temperature instead of using the temperatures corresponding to the exact date of the patients' first visit and the actual location of their residence. Despite its limitations, our study was able to demonstrate that seasonal variation could be associated with the severity of symptoms in the LUTS/BPH patients and that the cold season could worsen subjective symptoms as measured by the IPSS.
CONCLUSIONS
Our study and a review of other studies show that seasonal variation has a meaningful association with the symptoms in LUTS/BPH patients, especially urine storage. In addition, serum PSA levels could be influenced by seasonal variation, despite contradictory results in previous studies. Seasonal variation should be considered as an important factor when treating LUTS/BPH patients, and a prospective and longitudinal follow-up study is needed to validate the results.
 XML Download