

 PDF
PDF ePub
ePub Citation
 Print
Print


Polycystic ovary syndrome (PCOS) is characterized by hyperandrogenism and chronic anovulation, and it is one of the most common endocrine disorders, affecting 5% to 10% of reproductive age women [1]. Although the etiology of the syndrome is complex, insulin resistance and hyperinsulinemia are thought to play a major role in the pathophysiology of PCOS. Insulin resistance is thought to be caused by obesity, although recent studies have found that underweight women with PCOS are more likely to show insulin resistance than a normal control group. These results suggest that PCOS is independent of body weight for underweight women, although it is widely accepted that obesity is a key factor in insulin resistance in the general population. Prevalence rates for insulin resistance, impaired glucose tolerance (IGT), and type 2 diabetes among women with PCOS are higher than expected for women of similar age, reaching 50% to 70%, 30% to 40%, and 10%, respectively [2,3]. Although glucose intolerant patients do not have symptoms, glucose intolerance accelerates the development of type 2 diabetes and cardiovascular diseases, so these patients should be screened to ensure early detection of these disorders. There is considerable disagreement on when and how screening should be conducted. The fasting glucose test has been widely used to detect abnormal glucose tolerance (AGT) because it is convenient and inexpensive. However, many women with PCOS who take the fasting glucose test have normal fasting glucose levels, and this test failed to detect 58% of those who were diagnosed with type 2 diabetes through the glucose test [4].
The purpose of this study was to determine the risk factors for AGT among women with PCOS and to assess the optimal screening tests to predict AGT within this population.
Materials and Methods
1. Subjects
This study was conducted from August 2009 to May 2010 in the Department of Obstetrics and Gynecology at Kangbuk Samsung Hospital. We enrolled 85 women with PCOS, as well as 53 healthy women who were a similar age and body mass index (BMI) as the women with PCOS. The control group had regular menstrual cycles and no symptoms of hyperandrogenism, diabetes, and high blood pressure. They also had no history of cardiovascular disease and no family history of diabetes.
The diagnosis of PCOS was made according to the Rotterdam criteria, and patients were diagnosed with PCOS when at least two of the three following criteria were met: 1) the presence of cycle abnormalities, namely oligomenorrhea (6 or fewer menses per year) or amenorrhea (more than three months between menses); 2) clinical and/or biochemical evidence of hyperandrogenism; 3) enlarged ovaries containing at least twelve small (2 to 9 mm) follicles per ovary [5,6]. Other conditions with similar clinical manifestations, such as 21-hydroxylase deficiency, Cushing syndrome, hypothyroidism, hyperprolactinemia, and androgen-secreting tumors, were ruled out.
We used Choo's [7] categorization system for Asians to classify subjects according to BMI: underweight, less than 18.4 kg/m2; normal, between 18.5 kg/m2 and 22.9 kg/m2; overweight, between 23.0 kg/m2 and 24.9 kg/m2; obese, between 25.0 kg/m2 and 29.9 kg/m2; extremely obese=over 30.0 kg/m2. Participants were excluded from the study if they had a history of glucose intolerance (including gestational diabetes) or non-insulin-dependent diabetes mellitus (NIDDM) hyperprolactinemia, thyroid dysfunction, late onset congenital adrenal hyperplasia, or Cushing's syndrome. We also excluded women who were taking medications that could alter their hormonal or biochemical profiles. No patients included in the study were pregnant. This study was approved by the Kangbuk Samsung Hospital Institutional Review Board, and all participants provided written informed consent.
2. Diagnostic method
Overnight fasting blood samples were taken between days 2 and 5 of the menstrual cycle, if present. Hormonal and biochemical analyses included the measurement of glucose, lipid, insulin, testosterone, sex hormone-binding globulin (SHBG), leutinizing hormone (LH), and follicle stimulating hormone (FSH). Blood samples for an oral glucose tolerance test (OGTT) were obtained at 30-minute intervals over two hours to measure glucose after ingestion of a standard 75 g of glucose.
The OGTT was performed in accordance with the criteria of the American Diabetes Association (ADA) [8]. Participants were considered to have AGT if they had either impaired fasting glucose (IFG), IGT, or overt diabetes mellitus (DM). IFG was defined as an elevated fasting plasma glucose (FPG) concentration between 100 mg/dL and 125 mg/dL, in accordance with the criteria of the ADA. IGT was defined as a plasma glucose level between 140 mg/dL and 200 mg/dL after a 75 g glucose load on the OGTT. Overt DM was defined as a plasma glucose level of 200 mg/dL or greater. Since the above definitions led to overlap between the two groups, we also determined which participants had combined glucose intolerance (CGI), which was defined as the presence of both IFG and IGT. Normal glucose tolerance (NGT) was defined as an FPG below 100 mg/dL and a 2-hour plasma glucose level below 140 mg/dL.
Insulin levels were measured with immunoradiometric assay (Dia Source, Nivelles, Belgium). Blood glucose was measured with the hexokinase method. Insulin resistance and β-cell function were calculated as: higher homeostasis model assessment (HOMA) of insulin resistance (fasting insulin [mU/L] × fasting glucose [mmol/L]/ 22.5). BMI was calculated as body weight (kg) divided by body height squared (m2). Serum total testosterone, free testosterone, dehydroepiandrosterone-sulphate (DHEA-S) SHBG, FSH, LH, and estradiol were measured with radioimmunoassay (RIA) methods (Siemens, Los Angeles, CA, USA). The free androgen index was calculated as: (total testosterone/SHBG) × 3.47%. An enzymatic colorimetric test was used to measure total cholesterol, fasting triglyceride (TG), high-density lipoprotein cholesterol (HDL-cholesterol), and low-density lipoprotein cholesterol (LDL-cholesterol). High sensitivity C-reactive protein levels were measured with immunonephelometry (Dade Behering Co., Marburg, Germany).
3. Statistical analysis
Statistical analyses were performed with SPSS ver. 12.0 (SPSS Inc., Chicago, IL, USA). Mean values are ± SEM unless otherwise indicated. Differences between groups were assessed with the independent t-test, analysis of variance, and Mann-Whitney U test. Differences in frequencies were tested with the chi-square test. Multivariate logistic regression analysis was used to determine which variables predicted glucose intolerance. P-values < 0.05 were considered statistically significant.
Results
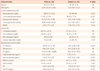
Table 1 depicts the clinical and biochemical characteristics of the two groups. Glucose metabolism profiles were significantly different between groups; the women with PCOS had higher values for fasting glucose, 2-hour post glucose, 2-hour post insulin, and HOMA than control women. Lipid profiles also differed between groups; the women with PCOS had lower HDL and higher triglyceride levels. Likewise, reproductive hormone profiles differed between groups; the women with PCOS had higher values for LH, total testosterone, free testosterone, high-sensitivity C-reactive protein (HS-CRP), and DHEA-S than control women.
Table 2 depicts the prevalence of AGT among women with PCOS and control women. AGT was present in 48.2% (41/85) of the women with PCOS. Among the women with PCOS who had AGT, 60.9% (25/41) had IFG, 14.6% (6/41) had IGT, and 24.4% (10/41) had both IFG and IGT (i.e., CGI). In addition, 16 women had IGT (isolated IGT+CGI). Of the women with PCOS who had IGT, 6 had isolated IGT with normal fasting glucose levels. The fasting glucose test identified 25 women with isolated IFG and 10 women with CGI, but it did not identify the remaining 6 women with AGT.
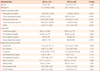
Table 3 depicts the clinical and biochemical characteristics of the 44 women with PCOS who had NGT and the 41 (48.2%) women with PCOS who had AGT. The glucose metabolism profiles were significantly different between groups. In addition, the women with AGT had significantly lower values for HDL and significantly higher values for TG than the women with NGT. With regards to reproductive hormones, women with AGT had significantly lower values for LH and significantly higher values for HS-CRP.
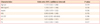
Multivariable logistic regression analysis identified several risk factors for AGT among women with PCOS (Table 4), including age (OR, 1.137; 95% CI, 1.022-1.266), BMI (OR, 1.358; 95% CI, 1.057-1.744), insulin (OR, 1.268; 95% CI, 1.070-1.502), and TG (OR,1.022; 95% CI, 1.002-1.042).
Discussion
In our study of 85 women with PCOS, the prevalence of IGT (isolated IGT + CGT) was 18.9% (16/85). This prevalence rate is similar to that of Chinese (20.5%), Thai (20.3%), and Mediterranean (15.7%) women with PCOS but lower than that of American women with PCOS (31%) [3,9-11].
In a previous study, 48.6% (17/35) of women with PCOS and NGT developed IGT at a rate of 16% per year, and 2% developed DM every year [12]. Another study followed up 67 PCOS patients for 6.2 years and found that 9% (5/54) of women who were normoglycemic at baseline developed IGT and 8% (4/54) developed DM. Of the women with IGT at baseline, 54% (7/13) had developed DM at the end of the follow-up period [13]. In another recent study of 83 women with PCOS, 24.1% developed AGT during a median follow-up of 3 years, including 3.6% who developed DM [14].
The prevalence of glucose intolerance and type 2 diabetes is high among both adults and adolescents with PCOS [15]. In a previous study of 141 adults and 62 adolescents with PCOS, the prevalence of AGT among adolescents was more than twice that of adults (19.1% and 9.7%, respectively; P =0.03). In addition, many of the adolescents with PCOS experienced deterioration of glucose tolerance before the age of forty, even though these individuals had NGT during adolescence [16]. These results highlight the importance of periodically screening women with PCOS for AGT.
The ADA has recommended that practitioners consider screening women with PCOS for abnormal glucose metabolism [15,17]. Our study indicates that such widespread screening is indeed warranted. Screening is especially important because recent data suggest that early intervention can prevent DM and can mitigate the effects of insulin resistance and attendant cardiovascular risk factors [17]. If prediabetes and diabetes could be diagnosed earlier, this could lead to better treatments and improved outcomes. In prediabetes, there is irrefutable evidence suggesting that lifestyle changes and pharmacological therapies can reduce or delay the development of type 2 DM by 30% to 50% [18,19]. However, for screening to be practical in a clinic setting, simple techniques are needed to screen the large population of individuals with PCOS for IGT and/or DM.
Both the ADA and WHO recommend using FPG for the primary screening process because FPG is more convenient to patients, less costly, more reproducible, and easier to administer than the 2-hour OGTT [17]. Our study compared the clinical and metabolic characteristics of women with PCOS who had NGT or AGT.
We found that the fasting glucose test failed to identify 6 (7%) women with IGT; these women would have been considered NGT if we had not performed the OGTT. Thus, our study highlights the importance of using another screening test in addition to the fasting glucose test to identify women with IFG, IGT and CGT. Similar results were obtained in another study showing that most women with PCOS have fasting glucose levels within the normal range [4]. In that study, the fasting glucose test failed to detect 58% of women diagnosed with type 2 diabetes with the glucose tolerance test. Likewise, the authors of another study argued that the FPG is insufficient as a screening test because the sensitivity of any screening test should be at least 80%, yet the FPG was unable to detect 52% of women with PCOS who had AGT [20].
Thus, the fasting glucose test appears to be too insensitive to determine which patients have IGT. Women with PCOS could instead be screened for abnormal glucose metabolism with an OGTT using the 2-hour glucose concentration after a 75 g glucose challenge. However, the OGTT is controversial because it is more time consuming and costly. One possible solution to this problem is to screen women with the OGTT only when they have particular risk factors for AGT because this would increase detection accuracy while decreasing expenses.
In large population studies, older age, BMI, an unfavorable body fat distribution, and parameters of insulin sensitivity and secretion during the OGTT predict the development of DM [12,21]. Compared with the general population, our study population was leaner and did not include many obese women. A previous study found that obesity, high blood pressure, high TG level, high waist-to-hip ratio, and a family history of diabetes are important risk factors for AGT [20,22].
In another study, women with PCOS and AGT had higher testosterone levels and lower SHBG levels than patients with NGT. The higher androgen and lower SHBG levels may result from their more pronounced insulin resistance, since there is good evidence that compensatory hyperinsulinemia amplifies androgen production in PCOS and inhibits SHBG synthesis by the liver [23]. However, our study indicates that age, BMI, insulin and TG are significant risk factors for AGT among women with PCOS. If women with PCOS are stratified by these risk factors, then the screening guidelines for diabetes could be refined to increase detection accuracy and reduce costs.
In conclusion, we found that age, insulin, BMI and TG were predictors of abnormal glucose metabolism in women with PCOS. We also found that an OGTT was a more reliable predictor of abnormal glucose metabolism than fasting plasma glucose. We recommend periodic screening for AGT using an OGTT for women with PCOS who have any of the above risk factors. Future studies are needed to clarify the optimal timing and best practices for AGT screening among women with PCOS.

 XML Download