

 PDF
PDF ePub
ePub Citation
 Print
Print


Placental vascularization is important for normal pregnancy. The circulatory function of the placenta appears at an early stage of embryo-placental development and is strongly related to fetal growth, placental volume, and uterine blood flow. Therefore, adequate placental angiogenesis is critical for the establishment of normal placental vascularization with subsequent normal development of the fetus [1,2].
Recent advances in technology allow the combination of 3-dimensional (3-D) ultrasound with power Doppler, making it possible to quantify Doppler signals in a volume obtained by 3D scanning and allowing investigation of the placental circulation. Each calculation of the vascularization index (VI), flow index (FI), and vascularization-flow index (VFI) is defined through technological quantification, and these indices are thought to reflect the number of vessels within the volume of interest, the intensity of flow at the time of the 3-D sweep, and both blood flow and vascularization [3].
However, it is not clear how accurately these indices reflect the degree of placental vascularization to date. Several investigators have been clarifying whether the observed 3D power Doppler truly assesses the alterations in placental vascularization and blood flow [4-7]. In this study, we investigated correlations among longitudinal 3D power Doppler measurements of the placenta taken in uncomplicated pregnancies, and related these results to birth weight.
Materials and Methods
This was a prospective study of 54 non-smoking women with uncomplicated singleton pregnancies. All women included in this study visited our clinic between 10 and 13 weeks of gestation for a nuchal translucency scan, and between 19 and 22 weeks of gestation for an anomaly scan between July 2009 and December 2009. All study participants gave birth in our hospital and there was no complicated pregnancy such as preterm labor, preeclampsia, fetal growth restriction, fetal aneuploidy, or fetal malformations. Written informed consent was obtained from each woman and extra-scan time for study was within 2 minutes.
Placental volume (PV) and vascular indices were assessed using a Voluson 730 Expert ultrasound machine (General Electric, Fairfield, CT, USA) equipped with a 5.0 to 7.0 MHz transducer and a combination of 3D/4D and power Doppler technology. The same pre-established instrument settings (angio mode, cent; smooth, 4/5; frequency, low; quality, 16; density, 6; enhance, 16; balance, GO150; filter, 2; actual power, 2 dB; and pulse repetition frequency, 0.9 kHz) were used in all cases and the angle of volume acquisition varied from 45° to 90°. The acquired 3D volumes were transferred to a personal computer using a Digital Imaging and Communications in Medicine connection for later analysis. Analysis of the acquired data was performed using the rotational technique in the virtual organ computer-aided analysis program included in the General Electric (GE) 3D/4D technology. The longitudinal view was used as a reference image and the rotation step was selected as 30°. Once a contour was manually defined on all image planes, the volume of the placenta was obtained. Thereafter, the 3D power Doppler histogram was used to determine vascular indices from computer algorithms. Acquisition and measurement of the 3D volume data were performed two times by two experienced operators. Each operator was blinded to other's 3D volume data and measurements.
The stored ultrasound volume obtained using 3D power Doppler was defined by voxels (smallest unit of volume). The total number of voxels is the sum of the number of gray-scale voxels (g0-g100) and color-scale voxels (c0-c100). The following vascular indices were analyzed as previously described [3,8]: 1) VI, which refers to the color voxel/total voxel ratio, i.e., the percentage of color voxels within the volume of interest (placenta), and indicates how many vessels can be detected within the placenta (vascularity); 2) FI, which refers to the weighted color voxel (on a scale of 0-100)/total color voxel ratio and provides an amplitude value for the color signal, thus providing information on how many blood cells are being transported at the time of the 3-D sweep (placental blood flow); and 3) VFI, which refers to the weighted color voxel/total voxel ratio and combines the information of vessel presence and amount of transported blood cells.
1. Statistical analysis
All statistical analyses were performed using SPSS ver. 17.0 (SPSS Inc., Chicago, IL, USA). Normal distribution of the data was examined with the Kolmogorov-Smirnov test. Correlation coefficient and P-values for PV, VI, FI, and VFI versus clinical and sonographic variables were calculated. Differences in PV, VI, FI, and VFI between the first- and second-trimester were analyzed by an independent sample t-test. The intraobserver and interobserver variability was expressed as an intraclass correlation coefficient (CC). A value of greater than 0.75 was thought to indicate good consensus for the intraclass CCs. Bland-Altman plots to assess the systemic bias between the two operators, and the relationship between the two measurements and the magnitude of the measurements was obtained [9]. The 95% limits of individual agreement between two measurements were calculated as the mean difference between two measurements±two standard deviations. P-values below 0.05 were accepted as significant.
Results
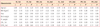
Median maternal age was 30.5 years (range, 23 to 39 years), and the median gestational age at first and second exam was 11.1 weeks and 20.1 weeks, respectively. Table 1 shows the general characteristics of the participants. Median birth weight was 3,170 g (range, 2,510 to 3,710 g) and median placental weight was 700 g (range, 420 to 1,000 g). For PVs and vascularization indices, the normality of distribution was confirmed by the Kolmogorov-Smirnov test; therefore log transformation was unnecessary for any of the data.
The mean values of PV and vascular indices are shown in Table 2. The mean PVs at the first- and second-trimester were 43.2 mL and 182.7 mL, respectively (P=0.000). All vascular indices of the second-trimester were significantly increased compared to the values of the first-trimester. Vascular indices of the first-trimester were not significantly different between the anterior or posterior positions (data not shown). However, FI of the second-trimester tended to be greater in anteriorly-placed placentas (47.6 vs. 43.6, P=0.002).
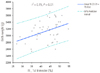
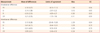
The correlations of the collected data with the PV and vascular indices can be seen in Table 3. Maternal age and parity had no influence on either the PV or vascular indices. Mode of delivery and weight gain during pregnancy also had no correlation with the PV and vascular indices (data not shown). Body mass index had no correlation with vascular indices except for a weak correlation with PV during the second trimester. A tendency for an increment in vascular indices with increased birth weight was observed, which was statistically significant only when FI of the first-trimester was considered (P=0.02). After controlling for the placental position, correlation between birth weight and FI of the first-trimester was also significant (r=0.338, P=0.03). Using a linear regression analysis (Fig. 1), the relationship between birth weight and FI of first-trimester can be defined as follows: birth weight (g) = 2323 + 19.03 × FI of first-trimester (%) (r2=0.15, P=0.01).
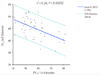
We also examined the possible influence of the volumetric data on vascular indices. PV of the first-and second-trimester had a negative influence on FI during the second-trimester. (r=-0.501, P=0.000; r=-0.443, P=0.001, respectively). After controlling placental position, this correlation was also statistically significant (-0.409, P=0.004; r=-0.344, P=0.015, respectively). As shown in Fig. 2, a linear regression defined this negative correlation: FI of the second-trimester (%) = 49.97-0.109 × PV of the first-trimester (cm3) (r2=0.26, P=0.00002). Positive correlations between birth weight and PV of the first-trimester were not found during the second-trimester.
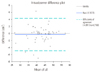
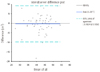
Additionally, we examined the reproducibility of the 3D power Doppler ultrasound (Table 4). No significant systematic bias was observed between each paired set of intraobserver measurements. The intraobserver CC was very good for all indices. With the exception of VFI measurements which showed an acceptable CC, the interobserver CCs for other indices were very good. There was no significant systematic bias in the measurements, and the 95% limits of agreement were generally excellent. The limit of agreement was wide only for PV measurements between the observers. Examples of the Bland-Altman plots for the intra-and interobserver measurements of FI are shown in Figs. 3, 4. With the exceptions of a few outliers, the differences between most measurements were within two standard deviations of the corresponding pairs. For PV, VI, and VFI, the Bland-Altman plots for intra-and interobserver measurements also showed similar results (data not shown).
Discussion
We have shown that vascularization of the placenta can be assessed with a relevant reproducibility during the first- and second-trimester using a longitudinal design. In uncomplicated pregnancy we found a significant increase with increasing gestation of all three of the vascular indices considered, suggesting an increase in placental vascularity during this period of gestation. These findings opposed a recent study showing that placental vascularization (number of vessels and blood flow) may increase proportionally to the organ volume, helping to maintain constant placental vascular constant throughout gestation [10]. In contrast, other investigators proposed that the fractional moving blood volume of the placenta is positively correlated with the increment of gestational age, thereby supporting our results [8]. The exact reasons for the differences in the vascular indices between these studies is unclear and could possibly be caused by the heterogeneity of the study design, differences of the targeted period of gestation, and variety of the 3D power Doppler techniques or settings. However, the present study evaluated 3-D power Doppler using a longitudinal design, which is more appropriate for assessing the longitudinal trends relative to gestational age.
We also demonstrated that birth weight and placental weight had a significant correlation with FI in the first-trimester; however, this correlation was obscured in the second-trimester, and PV and vascular indices of the second-trimester were influenced by placental position. Vascular indices of the first-trimester were not related to maternal age, parity, body mass index, or placental position. From these observations, we hypothesize that placental vascularization during the first-trimester could affect growth of the placenta and fetus until the end of pregnancy, which suggests 3D power Doppler can be used to predict fetal growth in the first-trimester. However, during the second-trimester, growth of the fetus and placenta is affected by other variables (e.g., parental constitutional factors, maternal medical conditions, maternal nutrition, and environmental factors) rather than placental vascularization. One interesting point is that FI of the second-trimester showed an inverse relation with PV during the first- and second-trimester. It could be assumed there is a trend for increased placental blood flow with smaller placenta during the second-trimester.
We are still uncertain whether 3D power Doppler measurements truly reflect the vascularization and blood flow of the targeted region. Recent in vitro studies using a flow phantom experiment have explored this issue [11-13]. These studies have shown how VI, FI, and VFI indices are not equally related to the number of vessels and volume flow. This implies that the most appropriate index to use might to be different depending on the clinical situation. For example, if volume flow is the target of an investigation (e.g., placental blood flow) FI would be the relevant index. This suggestion is supported by our finding that increased placental blood flow as determined by FI has positive influence on fetal growth under the pre-established 3D power Doppler settings. It was also known that variability of the vascular indices is significantly affected by the 3D power Doppler settings [12], therefore, Alcázar [14] recommended that the constant instrumental settings should be described in upcoming publications.
With regard to the reproducibility of 3D power Doppler measurements of the placenta, several investigators [4,15,16] have found that most PV and vascular indices showed good reproducibility through correlation and limits of agreement analyses. In the present study, we also obtained good intra- and inter-observer CCs and intra- and inter-observer limits of agreements of 3D power Doppler indices. High VFI variability was noted in our study as well as in previous results [4,16], which can be explained by an adequate reservoir for blood flow in the normal placenta [4].
FI of the placenta during the first-trimester significantly affects birth weight and placenta weight, and likely reflects the degree of placental vascularization. Additionally, 3D power Doppler ultrasound provides reproducible data for assessment of the placenta. However, the data and its interpretation in our study should be interpreted with some degree of caution due to the small number of patients.


 XML Download