

 PDF
PDF ePub
ePub Citation
 Print
Print


INTRODUCTION
The composition of kidney stones is an important window into the etiology of stone formation, indicating the environment in which the stone is formed. Identification of the crystalline composition of stones is essential not only for establishing the etiology but also for managing recurrent stone disease [1234]. About 95% of kidney stones are crystalline, with only 5% of the stone contributed by organic components (matrix or proteins) [5]. Stone composition can differ from a distinct single crystal to a compound mixture of many dissimilar crystals. The epidemiology of kidney stones is evolving. The gender gap has narrowed, and diet, obesity, and environmental factors have been implicated. Understanding of the epidemiology is required to comprehend the degree to which modifiable etiological factors are responsible for stone formation and to undertake measures for preventing recurrence.
Many methods for stone analysis are available, including dry and wet chemical spot tests, X-ray powder diffraction, Fourier transform infrared (FT-IR) spectroscopy, and Raman spectroscopy [678]. FT-IR spectroscopy was first introduced in 1955. Owing to its specificity and speed, it soon became the preferred reference method for stone analysis. However, dry and wet chemical spot tests are still widely used for stone analysis in clinical laboratories and provide crude clues to the presence of various constituents in the mixed type of stones. However, these tests fail to identify rare chemical components like purine or drug-induced stones [9]. The Guidelines on Urolithiasis of the European Association of Urology recommend infrared spectroscopy or X-ray diffraction for kidney stone analysis and consider wet chemical tests as outdated [10]. The current study aimed to compare the spot chemical method with FT-IR spectroscopy for kidney stone analysis and to determine the frequency of kidney stone types sent for analysis to our referral laboratory from various parts of the country.
MATERIALS AND METHODS
1. Study setting and ethics
A cross-sectional study was carried out at the section of Clinical Chemistry, Department of Pathology and Laboratory Medicine, Aga Khan University Hospital in Karachi, Pakistan, on kidney stones received from satellite laboratories and collection centers all over Pakistan between June and October 2015. Stones embedded in tissue, stones sent with collection devices, stones sent in fluid-filled containers, and stones sent with significant nonstone debris were excluded. Permission was received from the Ethical Review Committee (ERC) of Aga Khan University Hospital before the study was conducted (approval number: 3718-PAT-ERC-15). To maintain confidentiality, patient identification was deleted and a new code was assigned to each stone. Written informed consent was not taken and this was exempted from ERC.
2. Sample preparation
Stones received in sterile containers were cleaned, dried, and stored in an air-conditioned environment (between 20℃–22℃) until analyzed. Large stones (>12 mm) were fractured with a sharp needle to get to the nucleus or the core, and the core and surface samples taken were analyzed separately by FT-IR. Stones were then pulverized with a pestle and mortar to produce a fine homogeneous powder. To prevent contamination of the specimen by the last ground stone specimen, the knife was cleaned completely with a dry tissue and deionized water after each specimen. Stones were analyzed simultaneously by a chemical method using a stone analysis kit (LTA Stones Analysis Kit, Milano, Italy) and by FT-IR spectroscopy.
3. Stone analysis and reporting by the chemical method
Solutions of finely pulverized stone samples (15 mg) were analyzed by colorimetry by using LTA Stone Analysis Kit. Calcium was determined by titration with calconcarboxylic acid as an indicator. Reagents provided by the manufacturer and specified as R1 to R15 were added drop-wise according to the manufacturer's instructions, and the appearance of certain colors indicated positive results for calcium, oxalate, ammonia, phosphate, cystine, uric acid, and magnesium. The percentage of each component was determined by visual comparison with the kit color scale (semi-quantitative results).
4. Stone analysis and reporting by FT-IR spectroscopy
The background spectrum was measured initially with no sample in contact with the attenuated total reflectance (ATR) unit of the Nicolet iS5 FT-IR spectrometer (Thermo Fisher Scientific Inc., Waltham, MA, USA) with a zinc selenide crystal to deliver a comparative scale for the intensity of absorption and blank subtraction. After the sample holder was cleaned with an alcohol swab, around 2 mg of powdered kidney stone constituents was applied to the flat surface of the crystal of the spectrophotometer and spectra were collected with the help of Thermo Scientific OMNIC software (Thermo Electron Corporation, Madison, WI, USA) from 2,000 to 450 cm-1. The unknown spectra generated by FT-IR were compared with 756 synthetic kidney stone spectra in the NICODOM library. Visual examination of each spectra was done to select the best fitting spectra with their matching percentage. Reports were generated on the stone components that gave details of the chemical name, mineral name, and chemical formula. A matching percentage of 100% indicated a perfect concordance between the unidentified spectrum and the reference spectrum, and a match value near 100% simply indicated that the sample consisted of the same components in about the same ratio.
5. Statistical analysis
The statistical analysis was completed by means of IBM SPSS Statistics ver. 19.0 (IBM Co., Armonk, NY, USA). Means and standard deviations were derived for age and frequency for gender. Assessment was done by comparing the main component (≥60% of the total stone composition) reported by the two methods. A stone was considered pure if the crystal component constituted 80% to 100% of the stone composition [11]. The weighted kappa index was used for concordance analysis; the amount of concordance was indicated as a numerical value for κ, ranging from 0.0, demonstrating absolute discordance, to 1.0, signifying perfect concordance (any value from 0.4 to 0.6 indicated that the agreement was moderate).
RESULTS
A total of 449 kidney stones were submitted to the clinical laboratory for analysis during the study period. The mean size of the submitted stones was 8.8±5.0 mm, and the median stone weight was 0.22 g (range, 0–119.5 g). Most of the stones were from adult patients older than 16 years (mean age of adult patients, 38.3±12.1 years), with only 11.5% of stones (n=52) belonging to children between 3 and 16 years of age, and 1.5% (n=7) from children aged <2 years. The male to female ratio was 4.6 and the age distribution of the patients with stones ranged from 1 to 81 years.
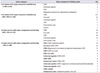
In adults, the most frequently occurring composition of stones was mixed stones formed predominantly of calcium oxalate monohydrate (COM). The COM stone type was the most common stone crystal reported (n=224), followed by uric acid crystals (n=88) and calcium oxalate dihydrate (COD, n=83). Six stones out of the total were composed of a 50:50 composition of COM and COD crystals. In children also (n=53), mixed stones were the most frequently occurring type and were predominantly formed of COD (n=21), followed by COM (n=11), ammonium urate (n=10), carbonate apatite (n=6), uric acid (n=4), and cystine (n=1). Table 1 shows the frequency of the various stone components and their combinations in the whole series of 449 kidney stones.
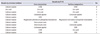
Core and surface composition were analyzed in 22 stones (mean diameter, 10.2±2.0 mm; median weight, 85.5 g). Only three stones were identified as being of uric acid crystals; the rest (n=19) were identified as calcium oxalate crystals by chemical analysis. The chemical composition of the core was completely different from that of the outer layers and consisted of ammonium urate (n=2), COM (n=2), and carbonate apatite (n=1) in these five stones as shown in Table 2.
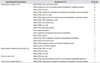
The chemical method did not recognize the occurrence of uric acid crystals in the stones (n=13) identified by FT-IR. Agreement between FT-IR and chemical analysis was moderate with a kappa value of 0.57 (95% confidence interval, 0.5 to 0.64). Disagreement in the analysis of 77 stones was noted (Table 3).
DISCUSSION
The purposes of kidney stone analysis include qualitative differentiation of stone components and semi-quantitative determination to assist in planning for the prevention of future stones. In the current study, 449 kidney stones were examined by means of the chemical spot test and the FT-IR technique and the results were compared for semiquantitative determination of the stone components. Lack of concordance between the two methodologies was documented in 17.4% of the stones analyzed. The main reason for this disagreement was that the chemical spot test could simply identify the occurrence of single ions and radicals and could not distinguish between the calcium oxalate stone types, that is, COM and COD and uric acid stones. The chemical spot test also misidentified various other crystal types (carbonate apatite, magnesium ammonium phosphate hexahydrate, uric acid, and cystine) as calcium and oxalate ions. In fact, significant differences were found in the identification of elements existing in trace amounts in mixed stones that the chemical analysis did not identify.
The chemical method is still used in clinical laboratories for stone analysis because of its simplicity and ease of analysis because it does not involve costly, specialized equipment. However, these chemical tests only give a rough clue to the occurrence of different elements in mixed types of stones. The disadvantage of the chemical methods is the subjectivity in interpretation of results, which can miss rare and unidentified material, and the requirement for at least 10 to 15 mg of material, which creates problems when processing small stones. For many stone types and mixtures, wet chemistry methods can only indicate the presence of individual ions and radicals rather than a specific compound. Additionally, with the use of these methods, differentiation between calcium oxalate crystals and uric acid subtypes is not possible. In numerous proficiency testing programs, error rates above 90% have been reported for chemical analysis in identifying certain components [9]. These chemical methods should be used as an alternative to the FT-IR methods for challenging or difficult stone spectra only.
Similar to documented findings in the literature, FT-IR in our study showed good sensitivity and allowed precise identification of the elements making up the stones [111213]. Furthermore, core composition differed from the stone's surface in 5 of 22 stones analyzed by FT-IR. Clinically, it is pertinent to know the composition of both the stone surface and the center or the core because this information can suggest the formative cause of the stone. FT-IR, using the ATR technique, was found to be a useful method. It was fast, used a small proportion of sample, and in general permitted positive identification of most of the components found in kidney stones. Differentiation of COM crystals from COD crystals was possible by the FT-IR technique but not by chemical analysis. In the former decade, FT-IR spectroscopy was enhanced by the introduction of an ATR component. Previously, analysis required sample processing in transparent potassium bromide (KBr) pellets whose absorbance was noted with the assistance of FT-IR. In current FT-IR instruments, an ATR crystal, which is pressed against the unprocessed stone specimen, enables uninterrupted interaction of the quantifying beam with the specimen and reflection of the attenuated radiation to the FT-IR spectrometer. This technical progress enhances the sensitivity of FT-IR-based measurements.
There were a few limitations to the current study. First, stone core or nidus analysis by chemical analysis was not done in all stones. Second, the precision of FT-IR and the chemical methods was not evaluated and sampling error bias may exist in our results.
This cross-sectional study also provided important information on the pattern of urolithiasis in a developing country. In the present study, the gender distribution was comparable with previous international and local data and showed a male preponderance of urolithiasis (male:female ratio, 4.6:1) [1415161718]. Most of the stones from this study were of the mixed variety with more COM and uric acid content (Table 3). Pakistan has a hot, arid climate that leads to a tendency for a low urine volume and acid urine pH, which promotes uric acid precipitation. This seems to result in a higher burden of such types of stones. A diet low in protein and calcium with an increased consumption of oxalaterich foods and a low intake of fluids in Pakistanis has been reported by Rizvi et al. [19]. Unfortunately, we still lack a complete and thorough epidemiological study about kidney stones in Pakistan. Further studies in this field are of critical importance for better identification of the risk factors and better prevention of recurrence.
CONCLUSIONS
The results of this study demonstrate that FT-IR analysis of kidney stones can overcome many of the limitations associated with chemical analysis. FT-IR provides critically useful analysis of stone crystal type and should replace chemical analysis in clinical laboratories. FT-IR-spectroscopy is applicable to smaller stone samples. It is important to understand that when using the FT-IR technique, analysis of all possible layers of the stone must be done separately if useful results are to be obtained. The main advantage of FT-IR in kidney stone analysis is the speed of analysis for identification of various stone crystals. However, knowledge of the FT-IR technique and the experience of specialized personnel devoted to such analysis is fundamental.
 XML Download