

 PDF
PDF ePub
ePub Citation
 Print
Print


INTRODUCTION
Kidney stone disease (KSD) is a common clinical problem worldwide. It is basically the formation of stone in the kidney (nephrolithiasis), ureter (ureterolithiasis), or urinary bladder (cystolithiasis) by the successive physicochemical events of supersaturation, nucleation, aggregation, and finally retention [1]. The stone forms as a result of crystal deposition in the kidneys, and the crystal is formed of components like calcium oxalate, calcium phosphate, calcium carbonate, magnesium-ammonium phosphate, uric acid, and cysteine [2].
The overall probability of forming stones differs in various parts of the world and is estimated as 1% to 5% in Asia, 5% to 9% in Europe, and 13% in North America [3]. Geographically, incidence is higher in the United States, the Middle East, Mediterranean countries, Scandinavian countries, the British Isles, and Central Europe, whereas a lower incidence is reported in Central and South America and Africa. In Asia, a stone-forming belt has been reported to stretch across Sudan, Saudi Arabia, the United Arab Emirates, Iran, Pakistan, India, Myanmar, Thailand, Indonesia, and the Philippines [4]. In India, the prevalence of kidney stones is 15%, and approximately 5 to 7 million patients have this painful disease [5]. The scenario in West Bengal also indicates that KSD poses a major health hazard in both rural and urban societies.
KSD has gained increasing significance owing to its rising incidence and prevalence throughout the world and also because of its tendency to recur within 5 to 10 years. It is a multifactorial disease that occurs as a result of the combined influence of epidemiological, biochemical, metabolic, and genetic risk factors [6]. Epidemiological studies indicate that factors like age, sex, race, ethnicity, geography, climate, occupation, socioeconomic status, daily water intake, and dietary habits of an individual influence kidney stone formation and recurrence.
KSD poses a major burden in public health care, and hence proper focus should be placed on its prevention. High water intake is a widely agreed upon recommendation to reduce the chances of stone formation and stone recurrence [7]. A patient diagnosed with KSD is generally instructed to maintain a high fluid intake in order to produce at least 2.5 L of urine in 24 hours [8]. Urinary stone formation is significantly increased when the urine volume excreted is below 1 L/d. Urinary volumes exceeding 2 to 2.5 L daily can prevent stone recurrence in previously affected patients [9]. However, there is controversy regarding the impact of water quality on the risk for stone formation. Limited studies are available that have examined the relationship between water quality and kidney stone formation. Hence, our current focus was to study the daily volume of water intake by patients with KSD and to identify whether people of any particular geographic area of West Bengal are much more prone to renal stones and whether drinking water quality is responsible for the prevalence.
MATERIALS AND METHODS
1. Selection of patients
Patients admitted in the Department of Urology, the Institute of Post Graduate Medical Education & Research (IPGME&R), Kolkata, West Bengal, India, during April 2013 to April 2017 were recruited as study subjects. Free and informed consent of the study participants was obtained, and the study protocol was approved by the institutional ethics committee of the IPGME&R (approval number: INST/IEC/2016/374). The diagnosis of stones was confirmed by plain X-ray film and renal ultrasound. Information about age, gender, residence, daily volume of water intake, and source of drinking water were collected from the study participants through a questionnaire. We also checked the participants' clinical profiles and studied parameters like calcium, oxalate, citrate, potassium, phosphate, and urate from urine samples. Patients with histories of known metabolic, gastrointestinal, renal, or endocrinologic disorders; with excess urinary calcium, oxalate, citrate, or urate; or taking any drugs like steroids or diuretics were excluded from this study. The patient population was stratified according to daily volume of water intake and the district in which they lived, more specifically according to their residential address.
2. Collection of water samples
Water that was being used for drinking purpose, for at least 10 years, was collected in 500-mL high-density, clean and sterile polyethylene bottles from those particular places where we got a maximum number of patients (case areas). We also collected water from the areas where kidney stone occurrence was 0% to 1% (control areas). Water was collected thrice yearly, in the three main seasons of summer, monsoon, and winter, i.e., in the months of May–June, August–September, and January, respectively. Before a sample was collected, the water was initially released for some time to ensure fresh water. Then the bottle was filled with water having no acid or air bubbles and was capped immediately to prevent atmospheric contamination [10]. The samples were properly labeled and stored in ice cooler and were analyzed in our laboratory within 24 hours.
3. Analysis of water samples
The drinking water samples were analyzed for pH, alkalinity, hardness, total dissolved solutes (TDS), electrical conductivity (EC), and salinity. pH was studied because it denotes the acidic load of water and indicates the pollution level. The EC gives an idea about the mineral content and salinity of water, another indicator of the inorganic pollution load of water. TDS represent the total amount of inorganic (e.g., potassium, calcium, sodium, bicarbonates, chlorides, magnesium, sulfates) and organic minerals present in water. The total alkalinity and hardness were determined by the titration method using sulfuric acid and ethylene diamine tetraacetic acid, respectively. pH, TDS, EC, and salinity were measured by using a pocket tester (35 series, Eutech Instruments multiparameter tester; Eutech Instruments Pte Ltd., Singapore). For each parameter, the tester was initially calibrated with respective buffer solutions.
4. Statistical analysis
To test for statistically significant differences in the different parameters, like pH, alkalinity, hardness, TDS, EC, and salinity, we used Student's t-test. All data were expressed as means±standard deviations. The p-values were checked to analyze whether the parameters differed significantly between the case and control areas by using Graphpad Instat software (GraphPad Software Inc., San Diego, CA, USA). A p-value<0.05 was considered to be statistically significant.
RESULTS
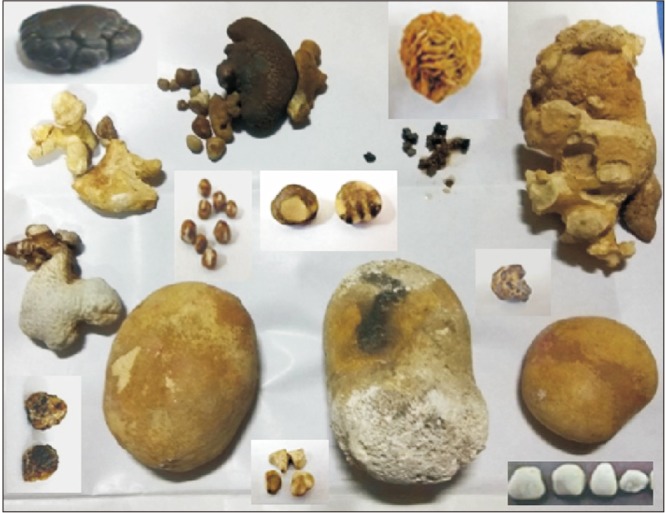
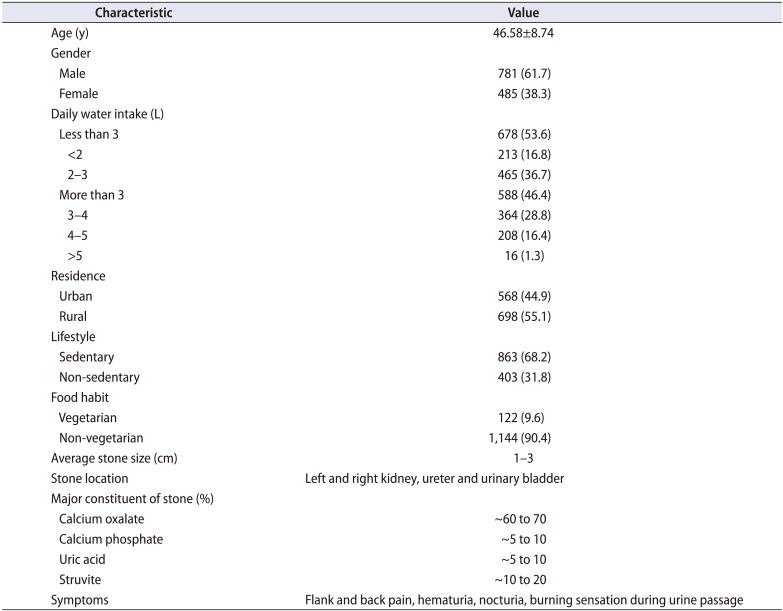
In our study, a total of 1,266 patients with kidney stones, aged 18 to 75 years and admitted in the Department of Urology, the IPGME&R, Kolkata, from April 2013 to April 2017 were recruited. The basal characteristics of the patients are presented in Table 1. Of the patients, 781 were men (61.7%) and 485 were women (38.3%), indicating an approximate 2:1 sex ratio of men to women. The tendency for stone formation was higher (68.2%) in individuals who had a sedentary lifestyle. In the West Bengal population, the average stone size was from 1 to 3 cm (Fig. 1), and stone formation was common in the kidneys, ureter, and urinary bladder. Calcium oxalate, calcium phosphate, and struvite stones were most common in our population.
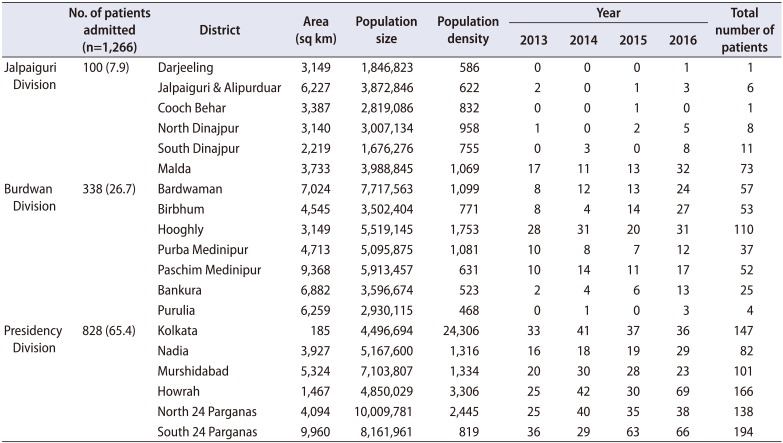
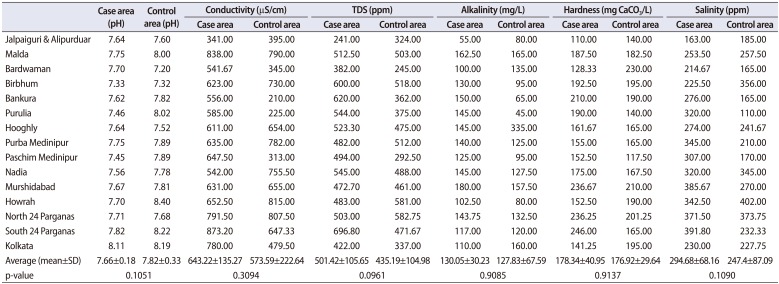
The daily volume of water intake was more than 3 L for 588 patients (46.4%), whereas 53.6% of the patients consumed less than 3 L of water daily. A district-wise (Supplementary Fig. 1) stratification of the patients revealed that the majority of them (65.4%) came from the Presidency Division (Districts North and South 24 Parganas, Howrah, Nadia, Murshidabad, and Kolkata) followed by Burdwan Division (26.7%) and Jalpaiguri Division (7.9%) during the time period studied. This regional distribution of patients is presented in Table 2. The 4-year epidemiologic data also indicated that, in particular areas, the prevalence of kidney stones was high, with a significant number of patients from those areas. Hence, we analyzed certain properties (pH, alkalinity, hardness, TDS, EC, and salinity) of drinking water samples from those specific areas and compared the results with drinking water from the control areas of that district (Table 3, Supplementary Table 1). None of the studied parameters differed significantly between the case and control areas.
DISCUSSION
KSD is a major health issue, the incidence of which is increasing day by day. A low intake of fluids, especially water, aggravates the chance of kidney stone formation [11]. Individual differences like race, ethnicity, food habits, and genetics [12] also contribute to KSD. In the present study, however, we focused only on whether there was any association of water quality with kidney stone formation. Keeping in mind the working status, outdoor activities, and daily food habits of the patients and also the climate (subtropical to tropical) of West Bengal, we set a water consumption of 3 L/d as the cutoff value as recommended by the clinician involved in the study. Accordingly, we found that 53.6% of the patients in the present study consumed less than 3 L of water. This observation was similar to our previous finding, in which we did a case-control study and found that the tendency for low water consumption was significantly higher (p=0.0002) in patients than in controls [12]. Because KSD varies by climate and geographic habitat, our first target was to identify those particular places in West Bengal from which the maximum number of KSD patients came. We had 4 years of recorded data from kidney stone patients (2013–2016) from the IPGME&R in Kolkata. Because the IPGME&R is a premier tertiary care hospital of West Bengal, the 4 years of data gave us an overview of the areas with maximum stone prevalence. The places from which we got more than 10 patients were identified as case areas and the control areas were selected from the places with no patients. Our 4-year data sample revealed that stone prevalence was very high in some specific areas, where we received more than 30 patients.
To the best of our knowledge, few studies have examined the relationship between water quality and kidney stone formation. Thus, the focus of our study was to identify whether people of any particular geographic area are much more prone to renal stones and whether drinking water quality is responsible for the prevalence of KSD. Accordingly, we collected drinking water samples from case and control areas and analyzed different parameters in the water. Ground water is used in West Bengal as the main source of drinking water, as it is comparatively inexpensive in abstraction and mostly safe except in a few pockets. As most of our patients live in villages, where access to filtered water is a fantasy, tap water and water from hand pumps or bore wells is the most easily accessible source for consumption. Thus, we collected that water from the source as our sample. To nullify the problem of seasonal variation in water properties, we collected water in the three main seasons of summer, monsoon, winter and recorded the average value.
We found that the studied parameters in both control and case areas were within permissible limits as prescribed by the World Health Organization (WHO) [1314], the Indian Council of Medical Research (ICMR) [15], and the Bureau of Indian Standards [1617]. The pH value of our samples ranged between 7.03 and 8.8. Although pH has no direct effect on human health [18], it shows a close relation with some other constituents of water. The EC is a measure of the saltiness of the water and an EC value within 0 to 800 µS/cm is suitable for drinking. The average EC value of water samples from Baruipur and Lake Town were relatively high, 1,310 and 1,045 µS/cm, respectively, which indicates the presence of high amounts of dissolved salts in the water. High EC values also indicate an inorganic pollution load, attributed to a high salinity and a high mineral content in the sampling site. Literature survey revealed that prolonged consumption of high-salt-containing water may cause kidney stone formation [18]. Hence, along with the EC, we also measured TDS, which represent the total amount of inorganic and organic minerals present in water [19]. We found that all our samples had TDS values less than the WHO standard limit of 1,000 ppm. TDS values also indicate the salinity behavior of the water sample [18]. In our study, the highest average salinity value was 654 ppm, found in Baruipur of South 24 Parganas, well below the maximum permissible limit prescribed by the WHO. The alkalinity values of the water samples were also under the permissible limit of the WHO standards (acceptable limit, 200 mg/L; maximum permissible limit, 600 mg/L).
Controversy remains as to whether water hardness impacts kidney stone formation. No significant correlation was found in several studies between water hardness and the regional incidence of urinary calculus [20212223]. However, another study reported that intake of hard water increases the chance of stone formation by promoting a 50% increase in urinary calcium concentration [24]. Accordingly, those authors recommended that soft water intake is preferable to hard water owing to its association with a lower risk for calcium-containing kidney stones. Coen et al. [25] also reported that an increase in drinking hard water resulted in an increase in urinary stone incidence. Hard water is basically water with high mineral contents and it is defined as the molar sum of calcium and magnesium found in water [20]. Our samples of both the control and the case area were moderately hard to hard, but well below the reference value of 500 mg/L recommended by the WHO and the ICMR. So, it is not harmful for local inhabitants. Moreover, when we compared the average values of the studied parameters in the case and control areas, we did not find any significant differences (p-value not less than 0.05). All the water samples were found to be suitable for drinking. Access to safe drinking water is a basic requirement for healthy life and our study revealed that all the surface water samples examined were within the maximum permissible limit of the WHO and the ICMR standards for drinking water quality.
The limitation of our study was that it was based on 4 years of reports of kidney stone patients of the IPGME&R in Kolkata. Data collection from hospitals in all districts could provide a more vivid picture of stone prevalence in West Bengal.

 XML Download