

 PDF
PDF ePub
ePub Citation
 Print
Print


INTRODUCTION
The prevalence of urolithiasis in Korea was reported as an incidence rate of approximately 1.9% [1]. About 10% of Korean people may suffer from urolithiasis at some point in their lifetime [12]. After the initial stone passage, the rate of stone recurrence in patients with previous urolithiasis was reported to be 40% at 5 years and 75% at 20 years, respectively [3]. Thus, it is very important to both prevent the recurrence of urolithiasis as well as treat it. It was reported that dietary habits could play an important role in the increased incidence and prevalence of urinary stones in developed countries [4]. Previous studies showed that numerous dietary factors such as carbohydrate, sodium, protein, fiber, lipid, folate, vitamin C, beans, cereals, leaves, and vegetables could alter the chemical composition of the urinary tract and lead to supersaturation [456]. Previous Korean research showed that patients with hypernatriuresis had a greater risk of recurrence of urolithiasis than did those with normal natriuresis [7]. As we mentioned, dietary factors are very important in the formation of urinary stones. However, data evaluating the relationship between various nutrient factors and risk for urolithiasis in Korea are lacking. Therefore, we investigated whether specific dietary factors could affect urinary stone formation in Korean people.
MATERIALS AND METHODS
We conducted a prospective case-control study of groups matched by gender, age, and body mass index (BMI) at SMG-SNU Boramae Medical Center between December 2012 and May 2013. Our study was approved by the Institutional Review Board of SMG-SNU Boramae Medical Center (approval number: 06-2012-204). We prospectively enrolled 47 subjects. A total of 27 patients newly diagnosed with urolithiasis and 20 applicants without urolithiasis were designated as the patients and the control group, respectively. The control group consisted of healthy volunteers without a history of urolithiasis. We excluded people who had a history of diet restriction, gout, hyperparathyroidism, nephrocalcinosis, gastrointestinal disease, renal tubular acidosis, urologic anatomical abnormalities, or chronic renal failure.
A face-to-face survey was conducted with a foodfrequency questionnaire (FFQ) and self-made questionnaires that covered basic demographic characteristics, water intake volume, physical activity level, and family history. The FFQ with 109 items suitable for the Korean National Health and Nutrition Examination Survey was developed by the Korean Centers for Disease Control and Prevention. This FFQ has high reproducibility and validity [8910]. Food intake volume was referenced by food photos for estimation of quantities from the Korean Genome and Epidemiology Study [11]. Nutrient intake was computed from the reported frequency of consumption and volume of each specified unit of food and from data in the Computer Aided Nutritional Analysis Program for Professionals developed by the Korean Nutrition Society of relevant nutrients in the specified portion [12].
Because previous studies have shown that these dietary factors can affect urinary stone formation [4513], we evaluated total energy, carbohydrate, lipid, protein, vitamin C, vitamin D, fiber, folate, calcium, sodium, magnesium, and chloride intakes and water intake volume as dietary risk factors. Nutrient values were adjusted for total caloric intake (continuous) to determine the nutrient composition of the diet independent of the total amount of food eaten [1415]. Because physical activity can affect urinary stone formation [16], we also evaluated the physical activity level by dividing it into the following four categories: sedentary, light, moderate, and vigorous.
Clinical variables were presented as means±standard deviations. None of the nutrient variables had a normal distribution. Thus, we analyzed for statistically significant differences by using the Mann-Whitney U test. To evaluate dietary risk factors for stone formation, we used logistic regression analysis. A p-value <0.05 was considered statistically significant, and commercially available statistical software (IBM SPSS Statistics ver. 22.0; IBM Co., Armonk, NY, USA) was used to analyze the data.
RESULTS
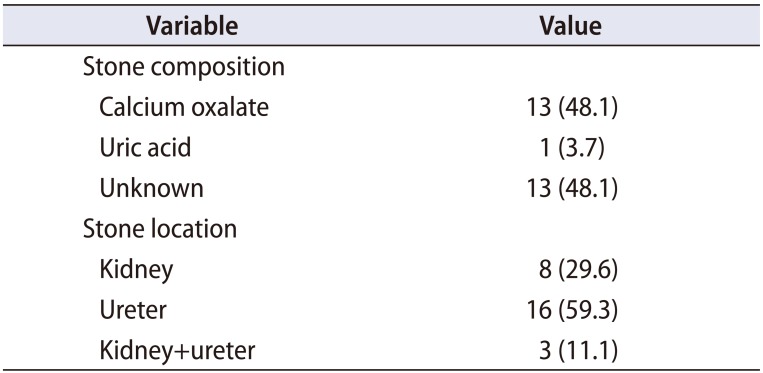
We analyzed data for 47 subjects: 27 in the patient group and 20 in the control group. There were no significant differences in gender (p=0.362), age (45.9±11.9 vs. 39.8±10.1 years, p=0.063), BMI (24.7±3.6 vs. 23.0±2.5 kg/m2, p=0.065), or positive family history (p=0.377) between the patient group and the control group. However, the level of physical activity was significantly higher in the control group (p=0.012, Table 1) [17]. The stone composition of the patient group is listed in Table 2. Thirteen patients (48.1%) had calcium oxalate stones, 1 patient (3.7%) had a uric acid stone, and the other 13 patients (48.1%) did not know their stone composition. Eight patients (29.6%) had kidney stones, 16 patients (59.3%) had ureter stones, and 3 patients (11.1%) had kidney and ureter stones.
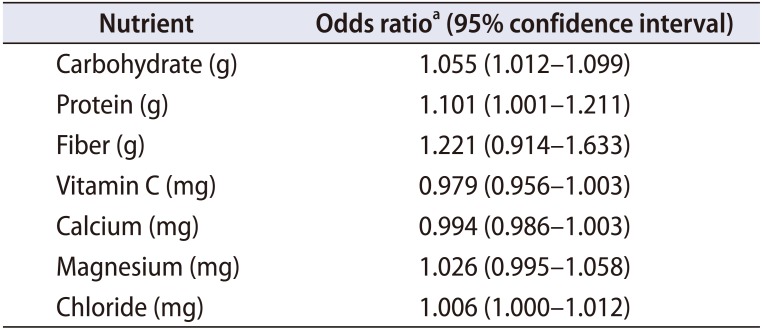
The differences in daily nutrient intake volume between the groups are shown in Table 3. Water intake was 1,061.9±710.7 mL and 1,082.0±626.3 mL per day in the patient and control groups, respectively (p=0.918). There were no significant differences between the two groups in intakes of carbohydrate, protein, vitamin C, vitamin D, fiber, folate, calcium, sodium, magnesium, chloride, lipid, or total energy per day (p>0.05). Table 4 shows the effect of nutritional factors (carbohydrate, protein, fiber, vitamin C, calcium, magnesium, and chloride) on urinary stone formation. After adjustment for physical activity level and total energy intake per day, the results of the logistic regression analysis revealed that a greater intake of carbohydrate (odds ratio [OR], 1.055; 95% confidence interval [CI], 1.012–1.099) and protein (OR, 1.101; 95% CI, 1.001–1.211) could increase the risk of urinary stone formation.
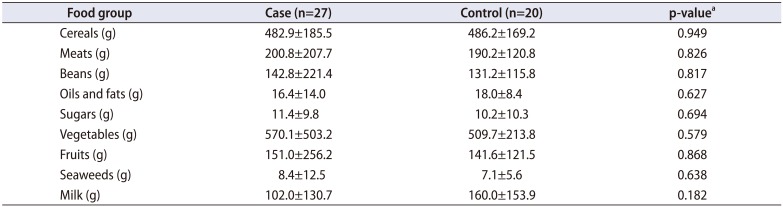
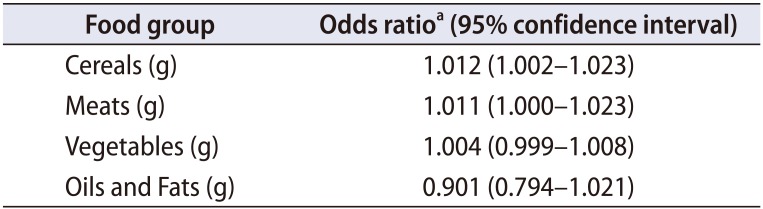
Table 5 shows the differences in mean daily food group intake volume between the two groups. There were no significant differences between the two groups in terms of intake of various foods, including meats, beans, sugars, vegetables, fruits, seaweeds, cereals, oils and fats, and milk. Table 6 shows the effect of food group intake (meats, beans, sugars, vegetables, fruits, seaweeds, cereals, oils and fats, and milk) on urinary stone formation. The results of the logistic regression analysis showed that after adjustment for physical activity level and total energy intake per day, a higher cereal intake increased the risk of stone formation (OR, 1.012; 95% CI, 1.002–1.023; Table 6).
DISCUSSION
Management of daily diet can be a major strategy for preventing the recurrence of urolithiasis [18]. Therefore, we analyzed the relationship between dietary risk factors and urinary stone formation. Our study demonstrated that an increased intake of dietary carbohydrate, protein, and cereals can increase urolithiasis.
Although over 200 components have been reported in urinary stones, most stones are composed of calcium oxalate (40%–60%) [19]. In our study, the most frequent component found in the stone analysis was also calcium oxalate (48.1%). The most important pathophysiological factor for calcium nephrolithiasis is hypercalciuria. Calcium can increase the ionic activity and saturation of crystallizing calcium salts (oxalate and phosphate) and binds stone inhibitors [20]. Hyperoxaluria is also important to raise the level of saturation of calcium oxalate in the urine [21]. The high intake of carbohydrate, protein, and cereals, the significant risk factors for urolithiasis in this study, might be associated with hypercalciuria and hyperoxaluria.
Meschi et al. [22] reported that a high intake of carbohydrate was the main dietary risk factor associated with calcium nephrolithiasis. High carbohydrate intake could have a hypercalciuric effect, possibly caused by impaired tubular reabsorption secondary to the insulin surge after the ingestion of a high-carbohydrate diet [23]. High protein intake was associated with increased risk of urinary stone formation. Trinchieri et al. [24] reported that a significantly increased consumption of animal and vegetable protein was identified as a nutritional risk factor that distinguished stone formers. Various other studies also reported that dietary protein intake was a well-recognized determinant of urinary calcium excretion [25]. A high-protein diet could increase urinary calcium by altering renal function or increasing the intestinal absorption of calcium [26]. Most previous studies reported that animal protein was associated with stone formation. Basiri et al. [27] reported that a high proportion of meat consumption, in conjunction with protein intake, had a significant correlation with the incidence of urolithiasis.
In terms of food groups, we observed an association between cereal intake and risk of urinary stone formation. A greater intake of cereals increased the risk of stone formation in our study. Siener et al. [28] reported that cereal foods could play an important role in urinary oxalate excretion. Cereals and cereal products could contribute to the daily oxalate intake to a considerable extent. Dietary oxalate contributes up to 50% of urinary oxalate excretion. The amount of oxalate excreted in urine makes a marked contribution to calcium oxalate supersaturation and, as a result, is an essential factor in the development of these calculi [29].
This study had several limitations. First, we could not fully analyze the stone composition owing to the loss and lack of stones. Second, recall bias could have existed in our study. In the questionnaire about dietary habits, respondents were asked to write down how many times on average during the past year or how much of certain foods they consumed. Given that the questionnaire was conducted during the winter, they may have had a hard time remembering food items or fruit that they mostly consumed during the summer months, which could have led to a seasonal bias.
Third, other constraints include risk factors that were not measured. In fact, owing to the lack of a program that can analyze the amount of oxalate contained in the food and the lack of preceding studies on the topic, no analysis on the dietary oxalate intake volume that causes urolithiasis was conducted.
Fourth, in explaining the risk factors that cause urolithiasis, the urine parameter plays an important role but no analysis was conducted on that either. A follow-up study through a 24-hour urinalysis test will be needed to further identify the relation with dietary habits.
Last, concerning the demographics of our cohort, most of the participants of the study were patients in a hospital and therefore regional characteristics were not reflected. This was because we designed this as a pilot study and wanted to get quick results about dietary risk factors for urolithiasis in Korea.
CONCLUSIONS
This study investigated the risk factors that lead to urolithiasis and their relation to dietary habits among Korean people. Higher intakes of carbohydrate, protein, and cereal could increase the risk for urinary stone formation. A large-scale, multicenter, prospective study is needed to firmly establish the dietary risk factors for urolithiasis.


 XML Download