

 PDF
PDF ePub
ePub Citation
 Print
Print


INTRODUCTION
In 2012, the US Preventive Services Task Force (USPSTF) issued a recommendation against prostate-specific antigen (PSA) screening. These recommendations were based on 2 large randomized studies studying the impact of PSA screening [12]. The U.S. Prostate, Lung, Colorectal, and Ovarian Cancer screening trial (PLCO) randomly assigned >75,000 men to annual PSA screening or usual care. The study failed to show a difference in cancer specific mortality at 10 years. However because of widespread PSA screening in the United States, 74% of the control arm had at least 1 PSA test leading many to suggest that this was not a valid comparison between screening and no screening [3]. The European Study of Randomized Screening (ERSCP) which had less contamination of the control group evaluated >160,000 men showed a 20% reduction in prostate cancer mortality at 9 years. This was considered a relatively small benefit, was largely restricted to men aged 55–69 years, and was associated with a high-risk of overdiagnosis. Results of these studies led the USPSTF to conclude that ‘there is a moderate or high certainty that this service has no benefit or that the harms outweigh the benefits’ [4].
Critics of this conclusion note that the ERSCP report used by the USPSTF had not reported at its prespecified main follow-up time and that the ERSCP trial with an additional 2 years of follow-up showed that PSA screening significantly reduced prostate cancer mortality [5]. The 13-year follow-up ERSCP report noted a significant 21% relative prostate cancer mortality reduction in favor of screening [2]. In addition, the Goteborg trial which was not considered by the USPSTF demonstrated that mortality was reduced by almost half over 14 years in a screened population. This prospective randomized population based trial analyzed the impact of PSA screening every 2 years and found a much higher mortality reduction than the PLCO or ERSCP studies [6]. Nevertheless, once the USPSTF guidelines were issued-dramatic changes in primary care and urologic practices led to decreased PSA screening and biopsies [78910].
After 2012, national declines in PSA and digital rectal exam (DRE) screenings were reported. Significant decreased PSA testing by primary care physicians was reported for all men following the USPSTF recommendations [11]. An analysis of the National health Interview Survey demonstrated that while screening decreased in all age groups, the largest drop occurred in men 50–59 years of age in whom absolute and relative screening rates declined by 8% and 25% [12]. The National Ambulatory Medical Care survey performed annually at the Centers for Disease Control and Prevention demonstrated a relative 64% decrease in DRE and a 39% decrease in PSA testing after the USPSTF recommendations were published [13].
By design, decreased prostate cancer screening leads to decreased prostate biopsies. McGinley et al. [14] reported that their large urology group practice completed 16.4% fewer evaluations for elevated PSA levels and 21.4% fewer prostate biopsies in the 2 years following the recommendations. Bhindi et al. [15] reported a significant decrease in the overall number of biopsies and noted that the number of monthly biopsies decreased from 58 to 35 in the 12 months following the USPSTF guidelines. More worrisome was a decrease in the absolute number of intermediate to high Gleason grade tumors suggesting that a number of clinically relevant cancers are going undiagnosed. Similarly, Banerji et al. [16] reported a 31% decrease in the absolute number of biopsies and a 33% higher relative risk of being diagnosed with high-risk prostate cancer. In the 2 and a half years after the USPSTF recommendations, patients were more likely to be diagnosed with high-risk as opposed to intermediate risk disease. These 2 studies were the first to show a significant impact of reduced screening on Gleason score at diagnosis.
In order to evaluate the effect of the USPSTF recommendations on prostate cancer diagnoses in a large suburban private practice setting and whether decreased screening leads to a higher incidence of high grade disease, we compared biopsy results from 2011 before the USPSTF recommendation and 2014 after the guidelines were widely adopted.
MATERIALS AND METHODS
We utilized data from a large urology group practice composed of 30 urologists at 2 free standing urology centers. No significant change in urology or pathology staffing or the referring practices occurred during the study period. We retrospectively collected data from all patients who underwent transrectal ultrasound guided prostate needle biopsy (PNB) in 2011 and 2014. The study was reviewed by our internal research committee. It was determined that this research project would qualify as exempt from an IRB review since the project involved research pertaining to the collection and analysis of existing data, documents, records, pathologic reports, and diagnostic specimens in such a manner that subjects could not be identified, directly or through identifiers linked to the subjects. As such, there was no potential harm to individual patients. All biopsies were submitted to a central pathology lab and reviewed by a dedicated uropathologist. Patient demographics, PSA, percent positive biopsies and Gleason scores were collected and compared between patient cohorts undergoing PNB in 2011 and those in 2014.
Data was summarized using descriptive statistics including frequency and percentage for categorical data and means and standard deviation for continuous data. Patient characteristics were compared between the 2 cohorts using a t-test for continuous variables (mean age) and a Pearson chi-square test for categorical variables (categorized age, PSA, and Gleason score). PSA values were not normally distributed and hence were analyzed as categorical data. Statistical significance testing was performed using a test p-value of 0.05 or less as a cutoff for significance. All analyses were performed using SAS 9.4 (SAS Institute Inc., Cary, NC, USA). Statistical testing was 2 sided with a threshold of statistical significance at p<0.5.
RESULTS
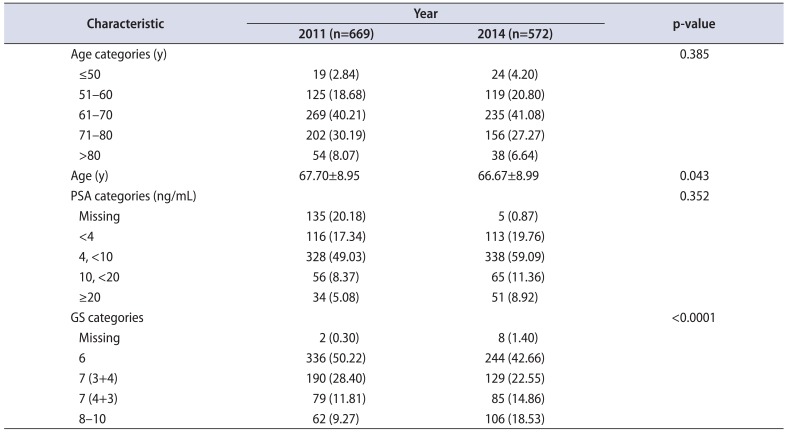
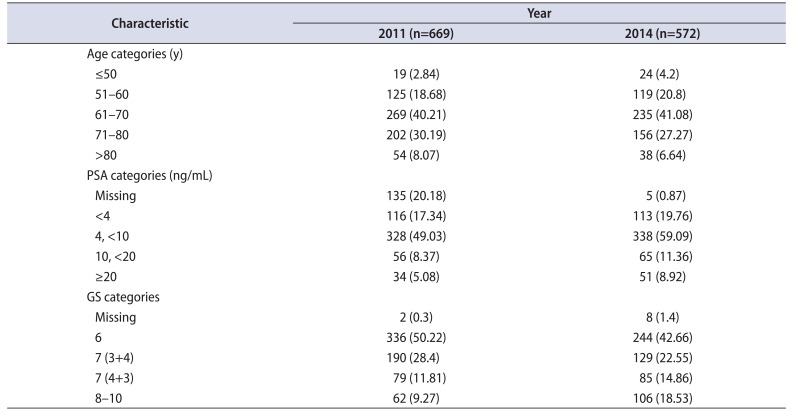
A total of 4,178 biopsies were identified – 2,513 in 2011 and 1,665 in 2014. The baseline patient characteristics for the 2 years are shown in Table 1. The percentage of positive biopsies was 27% in 2011 versus 34% in 2014 (p<0.0001). After the USPSTF recommendations, 34% fewer biopsies were performed with a 29% increase in positive biopsy rates. For the 2011 cohort, the median age was 68 years (range, 44–95 years), the median PSA was 5.3 ng/mL (range, 0.2–978 ng/mL) and the median Gleason score was 6 (range, 6–10). The 2014 cohort had a median age of 67 years (range, 40–92 years), a median PSA of 5.8 ng/mL (range, 0.05–1,016 ng/mL) and a median Gleason score of 7 (range, 6–10). The PSA values did not differ between the 2 years analyzed (chi-square; p=0.352).
Among patients with positive biopsies, we found statistically significant differences between the 2 cohorts in the median ages and Gleason scores. Patients were about 1 year younger in 2014 compared to 2011 (t-test; p=0.043). The percentage of patients with positive biopsies having high grade disease doubled in 2014. High Gleason scores (8–10) were diagnosed in 18.5% of the 2014 positive biopsies versus 9% in the 2011 positive biopsies (chi-square; p<0.0001). Age, PSA, and Gleason score differences of the patients in the two cohorts are depicted in Table 2.
DISCUSSION
After the introduction of widespread PSA screening in the US, the lifetime risk of prostate cancer rose from 9% in 1985 to 16% in 2009 with nearly 90% detected through screening. These screening detected cancers are more likely to be localized and less likely to be poorly differentiated [17]. During this same period, the lifetime risk of dying from prostate cancer fell from 3% to 2.4%. This decline in mortality is attributed to earlier detection and treatment as well as improvement in the various treatment modalities [18]. The 2012 USPTSTF guidelines have dramatically changed prostate cancer management in the US through declines in PSA screening, prostate biopsies, and prostate cancer diagnoses [1213]. In recommending against PSA screening, the USPSTF described false positive tests, overdiagnosis, and overtreatment of indolent disease as a major source of unnecessary harm from screening. However newer biomarkers and imaging techniques are refining the screening process and are helpful in identifying patients at greater risk of having intermediate and high-risk disease. Prostate Health Index multibiomarker test, PCA3 and TMPRSS2:ERG, and the 4K score panel are validated biomarkers that can be added to the prebiopsy algorithm to help determine which of the patients with an elevated screening PSA are most likely to benefit from a biopsy [19]. Multiparametric magnetic resonance imaging (Mp-MRI) has a high negative predictive value of 80%–90% and it is has been suggested that patients with elevated screening PSA who have PIRADS 1 and 2 lesions do not require biopsy. Conversely, those with PIRADS 4 and 5 lesions are likely to have significant cancers and biopsy is warranted. Due to interobserver variability, there is less consistency regarding PIRAD 3 lesions however Liddel et al. [20] reported that only 6.5% of these patients are found to have cancer and noted that lesions in the transition zone were more likely to represent a benign process. Thus, the use of emerging biomarkers along with prebiopsy Mp-MRI is an evolving improvement over PSA alone in distinguishing between indolent and clinically significant prostate cancers and may help clarify which patients require prostate biopsy.
A significant portion of the PSA screening controversy is related to the economic impact of prostate cancer on the US health care system. Although the PSA test is not expensive, the downstream effects of an elevated PSA including biopsy and management of postbiopsy complications are significant. In a Surveillance, Epidemiology, and End Results-Medicare analysis of PSA screening and subsequent related procedures from 2007 through 2009, Ma et al. [21] reported an annual expenditure of US $450 million. Prostate biopsies and management of postprocedure complications accounted for 72% of the total cost. The economic burden of screening must be weighed against the potential cost savings of earlier diagnoses as studies have shown a direct correlation between treatment cost per patient and the risk group at time of diagnosis [2223]. One way to assess the cost effectiveness of PSA screening is to assess the value added by various screening strategies. Roth et al. [24] created a microsimulation model and tested 18 PSA screening strategies. The screening costs, deaths prevented, additional life years, and quality of life years (QALY) were compared to a no screening approach. All strategies achieved added life years and increased expenditure with the costs ranging from US $7,335 to US $21,649 per life year. With selective treatment including conservative management of low risk patients, all strategies were associated with increased QALY and several were cost effective in terms of cost per QALY. Additional information regarding new screening tests, ideal screening population, proper testing intervals, and appropriate treatment interventions will help define the most cost effective screening protocol.
While decreased screening can reduce the diagnosis of indolent cancers and avoid unnecessary treatment, it also may lead to missed opportunities to diagnose prostate cancers when they are lower in grade and stage and may be more curable. Widespread PSA screening has changed the clinical characteristics of patients at the time of diagnosis. In an analysis from the Cleveland Clinic, patients diagnosed between 1986 and 1992 (pre-PSA) had more aggressive cancers evidenced by higher Gleason scores and T stage compared with those diagnosed from 1993 to 1996 (post-PSA). Additionally, PSA screening has resulted in a decreased burden of metastatic prostate cancer. Even when controlling for variables known to impact outcome, a significant difference in rates of metastases has been reported – with 18% of screened patients developing metastases compared with 26% in the pre PSA era [25]. If the pre-PSA era rates of metastatic disease at diagnosis were present in the modern US population – the total number of men presenting with metastases would be triple the current rate observed [26]. The inherent danger in abandoning PSA testing is that the reduction in unnecessary biopsies may be at the cost of detecting clinically relevant cancers when they are most treatable. Given the relatively indolent nature of many prostate cancers, the impact of reduced screening and biopsies on prostate cancer specific mortality will take more than 10 years to become evident [3]. A more readily available surrogate measure is a change in the Gleason score distribution.
CONCLUSIONS
After widespread implementation of the USPSTF guidelines, our center performed 34% fewer biopsies and found a significantly higher incidence of high grade disease. The percentage of patients with positive biopsies having Gleason score 8–10 doubled within 2 years of the recommendations against screening. During this period, no significant change in urology or pathology staffing or the referring practices occurred. The only change was that the primary care physicians increasingly accepted a no screening policy. Our findings are similar to those of Banerji et al. [16] who reported a 31% decrease in biopsies and a 33% higher relative risk of being diagnosed with high-risk prostate cancer. These results provide evidence to the growing concern that if PSA testing continues to be abandoned, we will lose the ability to identify patients with low to intermediate grade disease and encounter higher mortality rates.
 XML Download